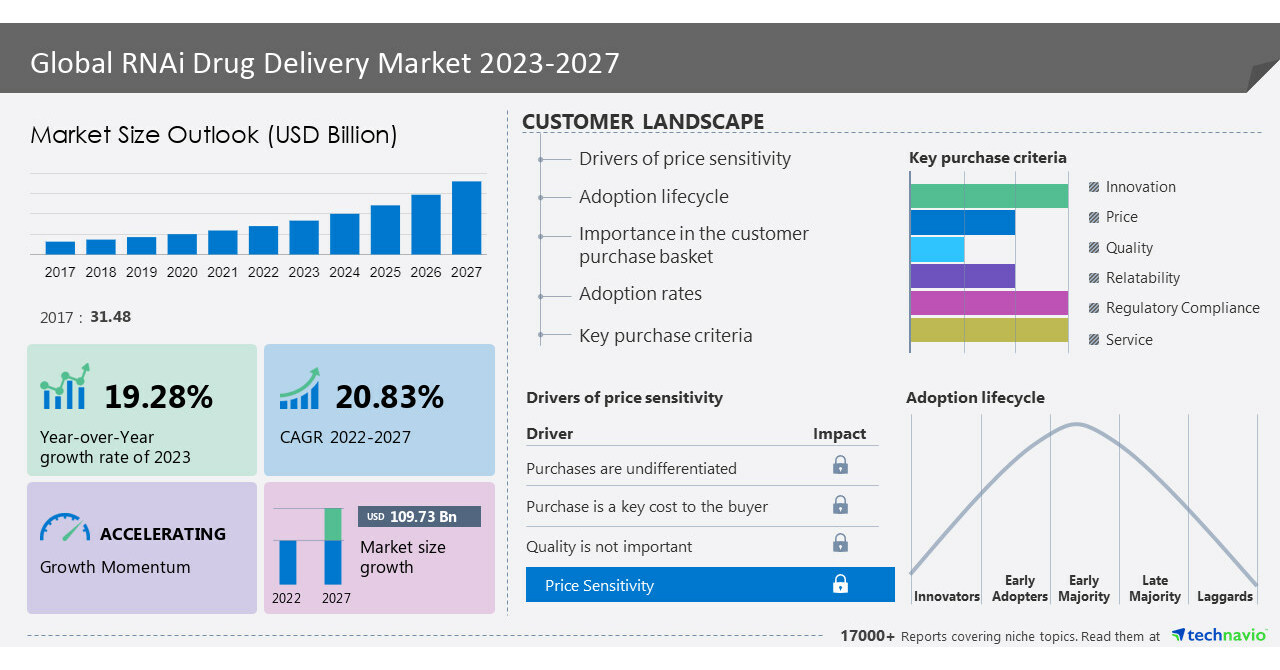
NEW YORK, July 27, 2023 /PRNewswire/ — The RNAi drug delivery market is expected to grow by USD 109.73 billion from 2022 to 2027, progressing at a CAGR of 20.83% as per the latest Technavio market research report. North America is going to have lucrative growth during the forecast period. About 46% of the market’s overall growth is expected to originate from North America. The rising number of cancer and metabolic diseases in the region is due to excessive smoking and alcohol consumption which has increased the demand for improved diagnostic modalities. As a result, market vendors, and researchers are focusing on new RNAi therapies. The US is the major contributor to the demand for RNAi therapies. Alnylam entered a development and commercialization collaboration with Dicerna to develop investigational RNAi therapeutics for the treatment of alpha-1 liver disease. Hence, these factors will drive market growth in the region during the forecast period. For more insights on the market share of various regions- Download a sample report in MINUTES
What’s New?
- Special coverage on the Russia–Ukraine war; global inflation; recovery analysis from COVID-19; supply chain disruptions, global trade tensions; and risk of recession
- Global competitiveness and key competitor positions
- Market presence across multiple geographical footprints – Strong/Active/Niche/Trivial buy the report!
RNAi Drug Delivery Market: Market Dynamics
Key Drivers
The high target affinity and specificity of RNAi therapeutics is a key factor driving market growth. This is because they have achieved high results toward their specific targets. Ability to potentially target any gene in the genome, can be administrated through multiple routes such as intravenous (IV), subcutaneous, and inhalation delivery, and Highly potent and durable effects are the various benefits offered by RNAi therapeutics. Furthermore, RNAi binds to the target gene with a very high affinity due to the base pair. Hence, these factors are expected to drive market growth during the forecast period.
Major Trends
The increasing R&D for RNAi therapy by vendors is the major trend in the market. This is to expand their product offering to the end-users and gain more customer base. For example, Alnylam started platform advancements that helped in the development of new conjugate delivery technology, C16. As a result, they can target new extrahepatic tissues, which include the eye, the lung, and the central nervous system. Thus, these trends will positively impact the growth of the market during the forecast period.
Significant Challenges
The high price of RNAi drugs is a significant challenge that affects market growth. These drugs by various companies are very useful for the treatment of chronic diseases. However, the high cost of these drugs makes them unaffordable for patients. A highly technically skilled workforce and complex manufacturing and scaling-up facilities are key factors that are responsible for the high cost of RNAi drugs in the market. Hence, the above-mentioned factors are expected to restrict market growth during the forecast period.
To know about more drivers, trends along with challenges – Download a sample now!
Some of the key RNAi Drug Delivery Market Players:
The RNAi drug delivery market is fragmented, and the vendors are deploying organic and inorganic growth strategies to compete in the market.
Alnylam Pharmaceuticals Inc., Arbutus Biopharma Corp., Arrowhead Pharmaceuticals Inc., Bayer AG, Benitec Biopharma Inc., BioNTech SE, Bristol Myers Squibb Co., CureVac AG, e therapeutics plc, F. Hoffmann La Roche Ltd., Novartis AG, Novo Nordisk AS, Phio Pharmaceuticals, Sanofi, Silence Therapeutics plc, Silenseed Inc., siRNAgen Therapeutics Corp., Sirnaomics Inc., Sylentis S.A., Thermo Fisher Scientific Inc., and TransCode Therapeutics Inc.
RNAi Drug Delivery Market: Segmentation Analysis
This market research report segments the RNAi drug delivery market by technology (nanoparticle drug delivery, pulmonary drug delivery, nucleic acid drug delivery, and aptamer drug delivery), application (infectious diseases, oncology, cardiology, neurology, and others), and geography (North America, Europe, Asia, and Rest of World (ROW)).
- The market share growth by the nanoparticle drug delivery segment will be significant during the forecast period. These systems are employed to serve as therapeutic agents to targeted sites in a controlled manner and are rapidly developing materials in the nanoscale range. The various advantages, such as the treatment of chronic human diseases by delivering precise medications to specified locations and targets, are provided by Nanotechnology. Hence, these factors are expected to drive segment growth during the forecast period.
For additional information on the market contribution of each segment – Grab an Exclusive Sample Report
Vendor Landscape
- Vendors covered
- Vendor classification
- Market positioning of vendors
- Competitive scenario
Gain instant access to 17,000+ market research reports.
Technavio’s SUBSCRIPTION platform
Related Reports:
The artificial bone market is estimated to grow by USD 170.77 million at a CAGR of 8.5% between 2022 and 2027. Furthermore, this report extensively covers market segmentation by material (ceramics, hydroxyapatite, composite, polymer, and others), end-user (hospitals, specialty clinics, and research organizations), and geography (North America, Europe, Asia, and the Rest of the World (ROW)). The increasing awareness and accessibility to advanced medical treatments are key factors driving the market growth during the forecast period.
The ophthalmic handheld surgical instruments market is estimated to grow by USD 360.3 million at a CAGR of 3.3% between 2022 and 2027. Furthermore, this report extensively covers market segmentation by end-user (hospitals, ophthalmic clinics, and others), product (ophthalmic knives, forceps, scissors, and others), and geography (North America, Europe, Asia, and the Rest of the World (ROW)). The increasing detection of ophthalmic diseases is a key factor driving the market growth during the forecast period.
|
RNAi Drug Delivery Market Scope |
|
|
Report Coverage |
Details |
|
Base year |
2022 |
|
Historic period |
2017-2021 |
|
Forecast period |
2023-2027 |
|
Growth momentum & CAGR |
Accelerate at a CAGR of 20.83% |
|
Market growth 2023-2027 |
USD 109.73 billion |
|
Market structure |
Fragmented |
|
YoY growth 2022-2023 (%) |
19.28 |
|
Regional analysis |
North America, Europe, Asia, and the Rest of the World (ROW) |
|
Performing market contribution |
North America at 46% |
|
Key countries |
US, Canada, UK, Germany, and China |
|
Competitive landscape |
Leading Vendors, Market Positioning of Vendors, Competitive Strategies, and Industry Risks |
|
Key companies profiled |
Alnylam Pharmaceuticals Inc., Arbutus Biopharma Corp., Arrowhead Pharmaceuticals Inc., Bayer AG, Benitec Biopharma Inc., BioNTech SE, Bristol Myers Squibb Co., CureVac AG, e therapeutics plc, F. Hoffmann La Roche Ltd., Novartis AG, Novo Nordisk AS, Phio Pharmaceuticals, Sanofi, Silence Therapeutics plc, Silenseed Inc., siRNAgen Therapeutics Corp., Sirnaomics Inc., Sylentis S.A., Thermo Fisher Scientific Inc., and TransCode Therapeutics Inc. |
|
Market dynamics |
Parent market analysis, Market growth inducers and obstacles, Fast-growing and slow-growing segment analysis, COVID-19 impact and recovery analysis and future consumer dynamics, and Market condition analysis for the forecast period. |
|
Customization purview |
If our report has not included the data that you are looking for, you can reach out to our analysts and get segments customized. |
Table of Contents
1 Executive Summary
- 1.1 Market Overview
- Exhibit 01: Executive Summary – Chart on Market Overview
- Exhibit 02: Executive Summary – Data Table on Market Overview
- Exhibit 03: Executive Summary – Chart on Global Market Characteristics
- Exhibit 04: Executive Summary – Chart on Market by Geography
- Exhibit 05: Executive Summary – Chart on Market Segmentation by Technology
- Exhibit 06: Executive Summary – Chart on Market Segmentation by Application
- Exhibit 07: Executive Summary – Chart on Incremental Growth
- Exhibit 08: Executive Summary – Data Table on Incremental Growth
- Exhibit 09: Executive Summary – Chart on Vendor Market Positioning
2 Market Landscape
- 2.1 Market ecosystem
- Exhibit 10: Parent market
- Exhibit 11: Market Characteristics
3 Market Sizing
- 3.1 Market definition
- Exhibit 12: Offerings of vendors included in the market definition
- 3.2 Market segment analysis
- Exhibit 13: Market segments
- 3.4 Market outlook: Forecast for 2022-2027
- Exhibit 14: Chart on Global – Market size and forecast 2022-2027 ($ billion)
- Exhibit 15: Data Table on Global – Market size and forecast 2022-2027 ($ billion)
- Exhibit 16: Chart on Global Market: Year-over-year growth 2022-2027 (%)
- Exhibit 17: Data Table on Global Market: Year-over-year growth 2022-2027 (%)
4 Historic Market Size
- 4.1 Global RNAi drug delivery market 2017 – 2021
- Exhibit 18: Historic Market Size – Data Table on global rnai drug delivery market 2017 – 2021 ($ billion)
- 4.2 Technology Segment Analysis 2017 – 2021
- Exhibit 19: Historic Market Size – Technology Segment 2017 – 2021 ($ billion)
- 4.3 Application Segment Analysis 2017 – 2021
- Exhibit 20: Historic Market Size – Application Segment 2017 – 2021 ($ billion)
- 4.4 Geography Segment Analysis 2017 – 2021
- Exhibit 21: Historic Market Size – Geography Segment 2017 – 2021 ($ billion)
- 4.5 Country Segment Analysis 2017 – 2021
- Exhibit 22: Historic Market Size – Country Segment 2017 – 2021 ($ billion)
5 Five Forces Analysis
- 5.1 Five forces summary
- Exhibit 23: Five forces analysis – Comparison between 2022 and 2027
- 5.2 Bargaining power of buyers
- Exhibit 24: Chart on Bargaining power of buyers – Impact of key factors 2022 and 2027
- 5.3 Bargaining power of suppliers
- Exhibit 25: Bargaining power of suppliers – Impact of key factors in 2022 and 2027
- 5.4 Threat of new entrants
- Exhibit 26: Threat of new entrants – Impact of key factors in 2022 and 2027
- 5.5 Threat of substitutes
- Exhibit 27: Threat of substitutes – Impact of key factors in 2022 and 2027
- 5.6 Threat of rivalry
- Exhibit 28: Threat of rivalry – Impact of key factors in 2022 and 2027
- 5.7 Market condition
- Exhibit 29: Chart on Market condition – Five forces 2022 and 2027
6 Market Segmentation by Technology
- 6.1 Market segments
- Exhibit 30: Chart on Technology – Market share 2022-2027 (%)
- Exhibit 31: Data Table on Technology – Market share 2022-2027 (%)
- 6.2 Comparison by Technology
- Exhibit 32: Chart on Comparison by Technology
- Exhibit 33: Data Table on Comparison by Technology
- 6.3 Nanoparticle drug delivery – Market size and forecast 2022-2027
- Exhibit 34: Chart on Nanoparticle drug delivery – Market size and forecast 2022-2027 ($ billion)
- Exhibit 35: Data Table on Nanoparticle drug delivery – Market size and forecast 2022-2027 ($ billion)
- Exhibit 36: Chart on Nanoparticle drug delivery – Year-over-year growth 2022-2027 (%)
- Exhibit 37: Data Table on Nanoparticle drug delivery – Year-over-year growth 2022-2027 (%)
- 6.4 Pulmonary drug delivery – Market size and forecast 2022-2027
- Exhibit 38: Chart on Pulmonary drug delivery – Market size and forecast 2022-2027 ($ billion)
- Exhibit 39: Data Table on Pulmonary drug delivery – Market size and forecast 2022-2027 ($ billion)
- Exhibit 40: Chart on Pulmonary drug delivery – Year-over-year growth 2022-2027 (%)
- Exhibit 41: Data Table on Pulmonary drug delivery – Year-over-year growth 2022-2027 (%)
- 6.5 Nucleic acid drug delivery – Market size and forecast 2022-2027
- Exhibit 42: Chart on Nucleic acid drug delivery – Market size and forecast 2022-2027 ($ billion)
- Exhibit 43: Data Table on Nucleic acid drug delivery – Market size and forecast 2022-2027 ($ billion)
- Exhibit 44: Chart on Nucleic acid drug delivery – Year-over-year growth 2022-2027 (%)
- Exhibit 45: Data Table on Nucleic acid drug delivery – Year-over-year growth 2022-2027 (%)
- 6.6 Aptamer drug delivery – Market size and forecast 2022-2027
- Exhibit 46: Chart on Aptamer drug delivery – Market size and forecast 2022-2027 ($ billion)
- Exhibit 47: Data Table on Aptamer drug delivery – Market size and forecast 2022-2027 ($ billion)
- Exhibit 48: Chart on Aptamer drug delivery – Year-over-year growth 2022-2027 (%)
- Exhibit 49: Data Table on Aptamer drug delivery – Year-over-year growth 2022-2027 (%)
- 6.7 Market opportunity by Technology
- Exhibit 50: Market opportunity by Technology ($ billion)
- Exhibit 51: Data Table on Market opportunity by Technology ($ billion)
7 Market Segmentation by Application
- 7.1 Market segments
- Exhibit 52: Chart on Application – Market share 2022-2027 (%)
- Exhibit 53: Data Table on Application – Market share 2022-2027 (%)
- 7.2 Comparison by Application
- Exhibit 54: Chart on Comparison by Application
- Exhibit 55: Data Table on Comparison by Application
- 7.3 Infectious diseases – Market size and forecast 2022-2027
- Exhibit 56: Chart on Infectious diseases – Market size and forecast 2022-2027 ($ billion)
- Exhibit 57: Data Table on Infectious diseases – Market size and forecast 2022-2027 ($ billion)
- Exhibit 58: Chart on Infectious diseases – Year-over-year growth 2022-2027 (%)
- Exhibit 59: Data Table on Infectious diseases – Year-over-year growth 2022-2027 (%)
- 7.4 Oncology – Market size and forecast 2022-2027
- Exhibit 60: Chart on Oncology – Market size and forecast 2022-2027 ($ billion)
- Exhibit 61: Data Table on Oncology – Market size and forecast 2022-2027 ($ billion)
- Exhibit 62: Chart on Oncology – Year-over-year growth 2022-2027 (%)
- Exhibit 63: Data Table on Oncology – Year-over-year growth 2022-2027 (%)
- 7.5 Cardiology – Market size and forecast 2022-2027
- Exhibit 64: Chart on Cardiology – Market size and forecast 2022-2027 ($ billion)
- Exhibit 65: Data Table on Cardiology – Market size and forecast 2022-2027 ($ billion)
- Exhibit 66: Chart on Cardiology – Year-over-year growth 2022-2027 (%)
- Exhibit 67: Data Table on Cardiology – Year-over-year growth 2022-2027 (%)
- 7.6 Neurology – Market size and forecast 2022-2027
- Exhibit 68: Chart on Neurology – Market size and forecast 2022-2027 ($ billion)
- Exhibit 69: Data Table on Neurology – Market size and forecast 2022-2027 ($ billion)
- Exhibit 70: Chart on Neurology – Year-over-year growth 2022-2027 (%)
- Exhibit 71: Data Table on Neurology – Year-over-year growth 2022-2027 (%)
- 7.7 Others – Market size and forecast 2022-2027
- Exhibit 72: Chart on Others – Market size and forecast 2022-2027 ($ billion)
- Exhibit 73: Data Table on Others – Market size and forecast 2022-2027 ($ billion)
- Exhibit 74: Chart on Others – Year-over-year growth 2022-2027 (%)
- Exhibit 75: Data Table on Others – Year-over-year growth 2022-2027 (%)
- 7.8 Market opportunity by Application
- Exhibit 76: Market opportunity by Application ($ billion)
- Exhibit 77: Data Table on Market opportunity by Application ($ billion)
8 Customer Landscape
- 8.1 Customer landscape overview
- Exhibit 78: Analysis of price sensitivity, lifecycle, customer purchase basket, adoption rates, and purchase criteria
9 Geographic Landscape
- 9.1 Geographic segmentation
- Exhibit 79: Chart on Market share by geography 2022-2027 (%)
- Exhibit 80: Data Table on Market share by geography 2022-2027 (%)
- 9.2 Geographic comparison
- Exhibit 81: Chart on Geographic comparison
- Exhibit 82: Data Table on Geographic comparison
- 9.3 North America – Market size and forecast 2022-2027
- Exhibit 83: Chart on North America – Market size and forecast 2022-2027 ($ billion)
- Exhibit 84: Data Table on North America – Market size and forecast 2022-2027 ($ billion)
- Exhibit 85: Chart on North America – Year-over-year growth 2022-2027 (%)
- Exhibit 86: Data Table on North America – Year-over-year growth 2022-2027 (%)
- 9.4 Europe – Market size and forecast 2022-2027
- Exhibit 87: Chart on Europe – Market size and forecast 2022-2027 ($ billion)
- Exhibit 88: Data Table on Europe – Market size and forecast 2022-2027 ($ billion)
- Exhibit 89: Chart on Europe – Year-over-year growth 2022-2027 (%)
- Exhibit 90: Data Table on Europe – Year-over-year growth 2022-2027 (%)
- 9.5 Asia – Market size and forecast 2022-2027
- Exhibit 91: Chart on Asia – Market size and forecast 2022-2027 ($ billion)
- Exhibit 92: Data Table on Asia – Market size and forecast 2022-2027 ($ billion)
- Exhibit 93: Chart on Asia – Year-over-year growth 2022-2027 (%)
- Exhibit 94: Data Table on Asia – Year-over-year growth 2022-2027 (%)
- 9.6 Rest of World (ROW) – Market size and forecast 2022-2027
- Exhibit 95: Chart on Rest of World (ROW) – Market size and forecast 2022-2027 ($ billion)
- Exhibit 96: Data Table on Rest of World (ROW) – Market size and forecast 2022-2027 ($ billion)
- Exhibit 97: Chart on Rest of World (ROW) – Year-over-year growth 2022-2027 (%)
- Exhibit 98: Data Table on Rest of World (ROW) – Year-over-year growth 2022-2027 (%)
- 9.7 US – Market size and forecast 2022-2027
- Exhibit 99: Chart on US – Market size and forecast 2022-2027 ($ billion)
- Exhibit 100: Data Table on US – Market size and forecast 2022-2027 ($ billion)
- Exhibit 101: Chart on US – Year-over-year growth 2022-2027 (%)
- Exhibit 102: Data Table on US – Year-over-year growth 2022-2027 (%)
- 9.8 UK – Market size and forecast 2022-2027
- Exhibit 103: Chart on UK – Market size and forecast 2022-2027 ($ billion)
- Exhibit 104: Data Table on UK – Market size and forecast 2022-2027 ($ billion)
- Exhibit 105: Chart on UK – Year-over-year growth 2022-2027 (%)
- Exhibit 106: Data Table on UK – Year-over-year growth 2022-2027 (%)
- 9.9 Germany – Market size and forecast 2022-2027
- Exhibit 107: Chart on Germany – Market size and forecast 2022-2027 ($ billion)
- Exhibit 108: Data Table on Germany – Market size and forecast 2022-2027 ($ billion)
- Exhibit 109: Chart on Germany – Year-over-year growth 2022-2027 (%)
- Exhibit 110: Data Table on Germany – Year-over-year growth 2022-2027 (%)
- 9.10 China – Market size and forecast 2022-2027
- Exhibit 111: Chart on China – Market size and forecast 2022-2027 ($ billion)
- Exhibit 112: Data Table on China – Market size and forecast 2022-2027 ($ billion)
- Exhibit 113: Chart on China – Year-over-year growth 2022-2027 (%)
- Exhibit 114: Data Table on China – Year-over-year growth 2022-2027 (%)
- 9.11 Canada – Market size and forecast 2022-2027
- Exhibit 115: Chart on Canada – Market size and forecast 2022-2027 ($ billion)
- Exhibit 116: Data Table on Canada – Market size and forecast 2022-2027 ($ billion)
- Exhibit 117: Chart on Canada – Year-over-year growth 2022-2027 (%)
- Exhibit 118: Data Table on Canada – Year-over-year growth 2022-2027 (%)
- 9.12 Market opportunity by geography
- Exhibit 119: Market opportunity by geography ($ billion)
- Exhibit 120: Data Tables on Market opportunity by geography ($ billion)
10 Drivers, Challenges, and Trends
- 10.3 Impact of drivers and challenges
- Exhibit 121: Impact of drivers and challenges in 2022 and 2027
11 Vendor Landscape
- 11.2 Vendor landscape
- Exhibit 122: Overview on Criticality of inputs and Factors of differentiation
- 11.3 Landscape disruption
- Exhibit 123: Overview on factors of disruption
- 11.4 Industry risks
- Exhibit 124: Impact of key risks on business
12 Vendor Analysis
- 12.1 Vendors covered
- Exhibit 125: Vendors covered
- 12.2 Market positioning of vendors
- Exhibit 126: Matrix on vendor position and classification
- 12.3 Alnylam Pharmaceuticals Inc.
- Exhibit 127: Alnylam Pharmaceuticals Inc. – Overview
- Exhibit 128: Alnylam Pharmaceuticals Inc. – Product / Service
- Exhibit 129: Alnylam Pharmaceuticals Inc. – Key news
- Exhibit 130: Alnylam Pharmaceuticals Inc. – Key offerings
- 12.4 Arbutus Biopharma Corp.
- Exhibit 131: Arbutus Biopharma Corp. – Overview
- Exhibit 132: Arbutus Biopharma Corp. – Product / Service
- Exhibit 133: Arbutus Biopharma Corp. – Key offerings
- 12.5 Arrowhead Pharmaceuticals Inc.
- Exhibit 134: Arrowhead Pharmaceuticals Inc. – Overview
- Exhibit 135: Arrowhead Pharmaceuticals Inc. – Business segments
- Exhibit 136: Arrowhead Pharmaceuticals Inc. – Key offerings
- Exhibit 137: Arrowhead Pharmaceuticals Inc. – Segment focus
- 12.6 Bayer AG
- Exhibit 138: Bayer AG – Overview
- Exhibit 139: Bayer AG – Business segments
- Exhibit 140: Bayer AG – Key news
- Exhibit 141: Bayer AG – Key offerings
- Exhibit 142: Bayer AG – Segment focus
- 12.7 BioNTech SE
- Exhibit 143: BioNTech SE – Overview
- Exhibit 144: BioNTech SE – Product / Service
- Exhibit 145: BioNTech SE – Key offerings
- 12.8 Bristol Myers Squibb Co.
- Exhibit 146: Bristol Myers Squibb Co. – Overview
- Exhibit 147: Bristol Myers Squibb Co. – Product / Service
- Exhibit 148: Bristol Myers Squibb Co. – Key news
- Exhibit 149: Bristol Myers Squibb Co. – Key offerings
- 12.9 F. Hoffmann La Roche Ltd.
- Exhibit 150: F. Hoffmann La Roche Ltd. – Overview
- Exhibit 151: F. Hoffmann La Roche Ltd. – Business segments
- Exhibit 152: F. Hoffmann La Roche Ltd. – Key news
- Exhibit 153: F. Hoffmann La Roche Ltd. – Key offerings
- Exhibit 154: F. Hoffmann La Roche Ltd. – Segment focus
- 12.10 Novartis AG
- Exhibit 155: Novartis AG – Overview
- Exhibit 156: Novartis AG – Business segments
- Exhibit 157: Novartis AG – Key offerings
- Exhibit 158: Novartis AG – Segment focus
- 12.11 Novo Nordisk AS
- Exhibit 159: Novo Nordisk AS – Overview
- Exhibit 160: Novo Nordisk AS – Business segments
- Exhibit 161: Novo Nordisk AS – Key offerings
- Exhibit 162: Novo Nordisk AS – Segment focus
- 12.12 Phio Pharmaceuticals
- Exhibit 163: Phio Pharmaceuticals – Overview
- Exhibit 164: Phio Pharmaceuticals – Product / Service
- Exhibit 165: Phio Pharmaceuticals – Key offerings
- 12.13 Sanofi
- Exhibit 166: Sanofi – Overview
- Exhibit 167: Sanofi – Business segments
- Exhibit 168: Sanofi – Key news
- Exhibit 169: Sanofi – Key offerings
- Exhibit 170: Sanofi – Segment focus
- 12.14 Silence Therapeutics plc
- Exhibit 171: Silence Therapeutics plc – Overview
- Exhibit 172: Silence Therapeutics plc – Product / Service
- Exhibit 173: Silence Therapeutics plc – Key offerings
- 12.15 Sirnaomics Inc.
- Exhibit 174: Sirnaomics Inc. – Overview
- Exhibit 175: Sirnaomics Inc. – Product / Service
- Exhibit 176: Sirnaomics Inc. – Key offerings
- 12.16 Sylentis S.A.
- Exhibit 177: Sylentis S.A. – Overview
- Exhibit 178: Sylentis S.A. – Product / Service
- Exhibit 179: Sylentis S.A. – Key offerings
- 12.17 Thermo Fisher Scientific Inc.
- Exhibit 180: Thermo Fisher Scientific Inc. – Overview
- Exhibit 181: Thermo Fisher Scientific Inc. – Business segments
- Exhibit 182: Thermo Fisher Scientific Inc. – Key news
- Exhibit 183: Thermo Fisher Scientific Inc. – Key offerings
- Exhibit 184: Thermo Fisher Scientific Inc. – Segment focus
13 Appendix
- 13.2 Inclusions and exclusions checklist
- Exhibit 185: Inclusions checklist
- Exhibit 186: Exclusions checklist
- 13.3 Currency conversion rates for US$
- Exhibit 187: Currency conversion rates for US$
- 13.4 Research methodology
- Exhibit 188: Research methodology
- Exhibit 189: Validation techniques employed for market sizing
- Exhibit 190: Information sources
- 13.5 List of abbreviations
- Exhibit 191: List of abbreviations
About Technavio
Technavio is a leading global technology research and advisory company. Their research and analysis focus on emerging market trends and provide actionable insights to help businesses identify market opportunities and develop effective strategies to optimize their market positions.
With over 500 specialized analysts, Technavio’s report library consists of more than 17,000 reports and counting, covering 800 technologies, spanning 50 countries. Their client base consists of enterprises of all sizes, including more than 100 Fortune 500 companies. This growing client base relies on Technavio’s comprehensive coverage, extensive research, and actionable market insights to identify opportunities in existing and potential markets and assess their competitive positions within changing market scenarios.
Contacts
Technavio Research
Jesse Maida
Media & Marketing Executive
US: +1 844 364 1100
UK: +44 203 893 3200
Email: [email protected]
Website: www.technavio.com
SOURCE Technavio
