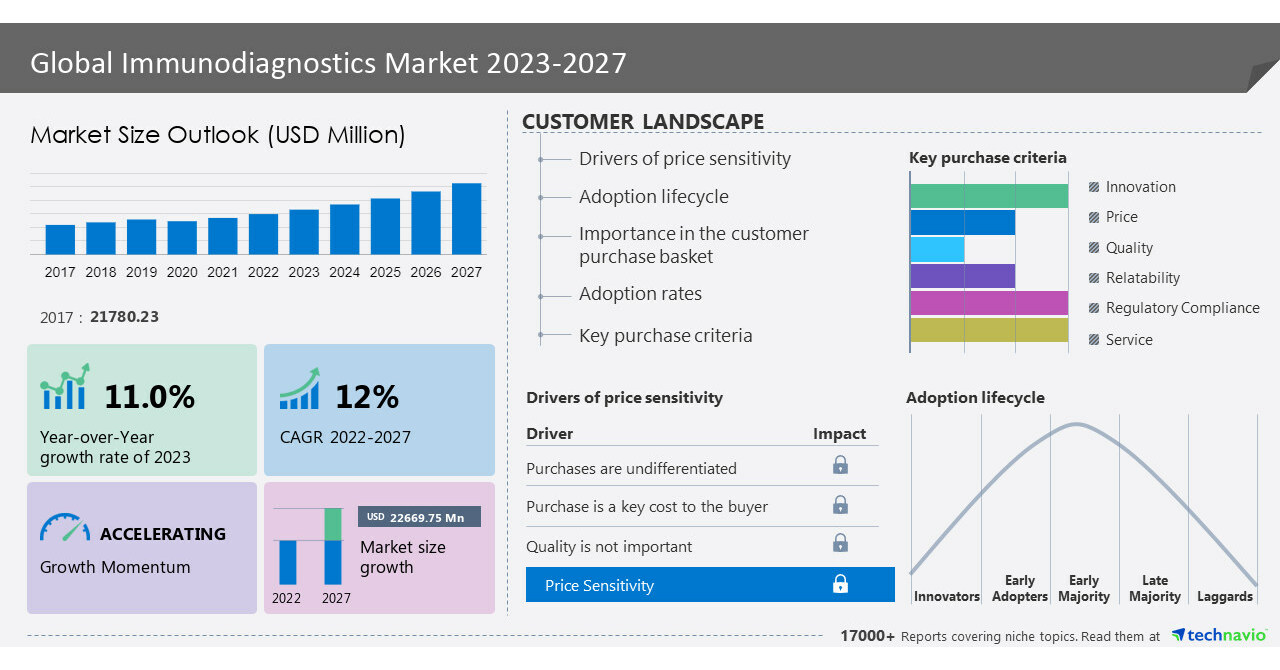
NEW YORK, July 28, 2023 /PRNewswire/ — The immunodiagnostics market size is set to grow by USD 22,669.75 million between 2022 and 2027 and register an accelerating CAGR of 12%, according to Technavio’s latest market research report estimates. With a focus on identifying dominant industry influencers, Technavio’s reports present a detailed study by the way of synthesis, and summation of data from multiple sources. This report offers an up-to-date analysis of the current market scenario, the latest trends and drivers, and the overall market environment. Read our Sample Report
The report also covers the following areas:
Immunodiagnostics Market 2023-2027: Segmentation
- Product
- Reagents And Consumables
- Immunodiagnostic Systems
- Application
- Oncology And Endocrinology
- Hepatitis And Retrovirus
- Infectious Disease
- GI Stool
- Other Applications
- Geography
- North America
- Europe
- Asia
- Rest Of World (ROW)
The market share growth by the reagents and consumables segment is significant during the forecast period. There is an increasing demand for reagents and consumables segment due to the rising demand for high-throughput screening with the help of immunoassays which has resulted in the production of new reagents to detect antigens. Furthermore, there is a rise in the implementation of fluorescence and chemiluminescence technology with new reagents which has fuelled the growth of this segment. hence, such factors are expected to fuel the growth of this segment which in turn will drive the market during the forecast period.
Detail Insights on the impact of each segment and make informed business decisions, request a sample report now!
Immunodiagnostics Market 2023-2027: Vendor Analysis and Scope
The market is fragmented, and the degree of fragmentation will accelerate during the forecast period. To help businesses improve their market position, Technavio’s report provides a detailed analysis of around 15+ vendors operating in the market. Some of these vendors include Abbott Laboratories, Adaptive Biotechnologies Corp., and AESKU.GROUP GmbH and Co. KG, bioMerieux SA, Danaher Corp., Exagen Inc., F. Hoffmann La Roche Ltd., HUMAN Gesellschaft fur Biochemica und Diagnostica mbH, Nexus Dx Inc., Omega Diagnostics Group Plc, QuidelOrtho Corp., Seramun Diagnostica GmbH, Siemens AG, SQI Diagnostics Inc., Sysmex Corp., Thermo Fisher Scientific Inc., Werfenlife SA, Tecan Trading AG, OraSure Technologies Inc., and DiaSorin SpA.
Vendor Offerings
- Abbott Laboratories: The company offers immunodiagnostics solutions through its subsidiary Abbott Diagnostics.
- Adaptive Biotechnologies Corp: The company offers immunodiagnostics solutions such as clonoSEQ, and immunoSEQ Dx.
- AESKU.GROUP GmbH and Co: The company offers immunodiagnostics solutions such as AESKU.RAPID SARS CoV 2 Rapid Test.
Immunodiagnostics Market 2023-2027: Market Dynamics
Key Drivers
The rising demand for biomarker-based tests drives the global immunodiagnostics market growth during the forecast period. The increasing utilization of sophisticated research and development in the fields of nucleic acid expression, proteomics, and sequencing has resulted in the development of biomarkers. Molecular biomarkers can be referred to as proteins, genes, hormones, and other molecular entities that help identify the presence or absence of disease. The advancement in technology has facilitated several manufacturers to develop assays for rapidly growing clinical areas, including cancer, heart disease, and women’s health. Hence, such factors are expected to replace traditional drug therapy with personalized devices, which in turn is expected to drive the immunodiagnostics market growth during the forecast period.
Major Trends
The increase in demand for personalized medicine is a primary trend in the global immunodiagnostics market during the forecast period. There is an increasing shift in preference toward personalized medicine, which requires precision diagnostics. Immunodiagnostics plays a major role in precision medicine by facilitating accurate diagnosis and monitoring of diseases at the molecular level. Personalized medicine can be defined as the tailoring of medical treatment to the specific characteristics of each patient. In personalized medicine, the prescription of medicine is done by accurate diagnosis by age, disease, gender, and criticality of disease. Hence, such a personalized approach essentially requires the use of biomarkers that are expected to positively impact the market. Hence, such factors are expected to drive market growth during the forecast period.
Significant Challenges
The high cost associated with immunodiagnostics tests is a significant challenge hindering the global immunodiagnostics market growth during the forecast period. The cost associated with immunodiagnostic testing cannot be affordable to some people leading to limited access to care. This is significant in low- and middle-income developing countries where resources may be scarce. Some of the key factors which contributed to the high cost of immunodiagnostic tests include sophisticated techniques, specialized equipment, and highly skilled personnel. Furthermore, the raw materials and reagents used in immunodiagnostic tests are expensive, adding to the overall costs. Hence, such factors are expected to negatively impact the market, which in turn will hinder the global immunodiagnostics market growth during the forecast period.
What’s New? –
- Special coverage on the Russia–Ukraine war; global inflation; recovery analysis from COVID-19; supply chain disruptions, global trade tensions; and risk of recession
- Global competitiveness and key competitor positions
- Market presence across multiple geographical footprints – Strong/Active/Niche/Trivial – Buy the report!
Immunodiagnostics Market 2023-2027: Key Highlights
- CAGR of the market during the forecast period 2023-2027
- Detailed information on factors that will assist immunodiagnostics market growth during the next five years
- Estimation of the immunodiagnostics market size and its contribution to the parent market
- Predictions on upcoming trends and changes in consumer behavior
- The growth of the immunodiagnostics market
- Analysis of the market’s competitive landscape and detailed information on vendors
- Comprehensive details of factors that will challenge the growth of immunodiagnostics market vendors
Gain instant access to 17,000+ market research reports.
Technavio’s SUBSCRIPTION platform
Related Reports:
The direct-to-consumer (DTC) laboratory testing market size is estimated to grow by USD 9,703.47 million at a CAGR of 31.59% between 2022 and 2027. The market is segmented by type (blood, urine, saliva, and others), application(routine clinical testing, diabetes testing, genetic testing, thyroid-stimulating hormone testing, and others), and geography(North America, Europe, Asia, and Rest of World (ROW)). The see and convenience of DTC laboratory testing significantly drive the market growth.
The vitamin D testing market size is estimated to grow by USD 193.53 million at a CAGR of 5.44% between 2022 and 2027. The market is segmented by Product (25-hydroxyvitamin D testing and 1 25-dihydroxy vitamin D testing ), End-user (diagnostic laboratories, hospitals, physician clinics, and home care settings ), and Geography(North America, Europe, Asia, and the Rest of the World (ROW)). The growing prevalence of vitamin D deficiency-related disorders is the key factor driving the growth of the market.
|
Immunodiagnostics Market Scope |
|
|
Report Coverage |
Details |
|
Base year |
2022 |
|
Historic period |
2017-2021 |
|
Forecast period |
2023-2027 |
|
Growth momentum & CAGR |
Accelerate at a CAGR of 12% |
|
Market growth 2023-2027 |
USD 22,669.75 million |
|
Market structure |
Fragmented |
|
YoY growth 2022-2023(%) |
11.0 |
|
Regional analysis |
North America, Europe, Asia, and the Rest of the World (ROW) |
|
Performing market contribution |
North America at 35% |
|
Key countries |
US, Canada, UK, Germany, and China |
|
Competitive landscape |
Leading Vendors, Market Positioning of Vendors, Competitive Strategies, and Industry Risks |
|
Key companies profiled |
Abbott Laboratories, Adaptive Biotechnologies Corp., AESKU.GROUP GmbH and Co. KG, bioMerieux SA, Danaher Corp., Exagen Inc., F. Hoffmann La Roche Ltd., HUMAN Gesellschaft fur Biochemica und Diagnostica mbH, Nexus Dx Inc., Omega Diagnostics Group Plc, QuidelOrtho Corp., Seramun Diagnostica GmbH, Siemens AG, SQI Diagnostics Inc., Sysmex Corp., Thermo Fisher Scientific Inc., Werfenlife SA, Tecan Trading AG, OraSure Technologies Inc., and DiaSorin SpA |
|
Market dynamics |
Parent market analysis, Market growth inducers and obstacles, Fast-growing and slow-growing segment analysis, COVID-19 impact and recovery analysis and future consumer dynamics, Market condition analysis for the forecast period |
|
Customization purview |
If our report has not included the data that you are looking for, you can reach out to our analysts and get segments customized. |
Table of Contents
1 Executive Summary
- 1.1 Market overview
- Exhibit 01: Executive Summary – Chart on Market Overview
- Exhibit 02: Executive Summary – Data Table on Market Overview
- Exhibit 03: Executive Summary – Chart on Global Market Characteristics
- Exhibit 04: Executive Summary – Chart on Market by Geography
- Exhibit 05: Executive Summary – Chart on Market Segmentation by Product
- Exhibit 06: Executive Summary – Chart on Market Segmentation by Application
- Exhibit 07: Executive Summary – Chart on Incremental Growth
- Exhibit 08: Executive Summary – Data Table on Incremental Growth
- Exhibit 09: Executive Summary – Chart on Vendor Market Positioning
2 Market Landscape
- 2.1 Market ecosystem
- Exhibit 10: Parent market
- Exhibit 11: Market Characteristics
3 Market Sizing
- 3.1 Market definition
- Exhibit 12: Offerings of vendors included in the market definition
- 3.2 Market segment analysis
- Exhibit 13: Market segments
- 3.4 Market outlook: Forecast for 2022-2027
- Exhibit 14: Chart on Global – Market size and forecast 2022-2027 ($ million)
- Exhibit 15: Data Table on Global – Market size and forecast 2022-2027 ($ million)
- Exhibit 16: Chart on Global Market: Year-over-year growth 2022-2027 (%)
- Exhibit 17: Data Table on Global Market: Year-over-year growth 2022-2027 (%)
4 Historic Market Size
- 4.1 Global immunodiagnostics market 2017 – 2021
- Exhibit 18: Historic Market Size – Data Table on global immunodiagnostics market 2017 – 2021 ($ million)
- 4.2 Product Segment Analysis 2017 – 2021
- Exhibit 19: Historic Market Size – Product Segment 2017 – 2021 ($ million)
- 4.3 Application Segment Analysis 2017 – 2021
- Exhibit 20: Historic Market Size – Application Segment 2017 – 2021 ($ million)
- 4.4 Geography Segment Analysis 2017 – 2021
- Exhibit 21: Historic Market Size – Geography Segment 2017 – 2021 ($ million)
- 4.5 Country Segment Analysis 2017 – 2021
- Exhibit 22: Historic Market Size – Country Segment 2017 – 2021 ($ million)
5 Five Forces Analysis
- 5.1 Five forces summary
- Exhibit 23: Five forces analysis – Comparison between 2022 and 2027
- 5.2 Bargaining power of buyers
- Exhibit 24: Chart on Bargaining power of buyers – Impact of key factors 2022 and 2027
- 5.3 Bargaining power of suppliers
- Exhibit 25: Bargaining power of suppliers – Impact of key factors in 2022 and 2027
- 5.4 Threat of new entrants
- Exhibit 26: Threat of new entrants – Impact of key factors in 2022 and 2027
- 5.5 Threat of substitutes
- Exhibit 27: Threat of substitutes – Impact of key factors in 2022 and 2027
- 5.6 Threat of rivalry
- Exhibit 28: Threat of rivalry – Impact of key factors in 2022 and 2027
- 5.7 Market condition
- Exhibit 29: Chart on Market condition – Five forces 2022 and 2027
6 Market Segmentation by Product
- 6.1 Market segments
- Exhibit 30: Chart on Product – Market share 2022-2027 (%)
- Exhibit 31: Data Table on Product – Market share 2022-2027 (%)
- 6.2 Comparison by Product
- Exhibit 32: Chart on Comparison by Product
- Exhibit 33: Data Table on Comparison by Product
- 6.3 Reagents and consumables – Market size and forecast 2022-2027
- Exhibit 34: Chart on Reagents and consumables – Market size and forecast 2022-2027 ($ million)
- Exhibit 35: Data Table on Reagents and consumables – Market size and forecast 2022-2027 ($ million)
- Exhibit 36: Chart on Reagents and consumables – Year-over-year growth 2022-2027 (%)
- Exhibit 37: Data Table on Reagents and consumables – Year-over-year growth 2022-2027 (%)
- 6.4 Immunodiagnostic systems – Market size and forecast 2022-2027
- Exhibit 38: Chart on Immunodiagnostic systems – Market size and forecast 2022-2027 ($ million)
- Exhibit 39: Data Table on Immunodiagnostic systems – Market size and forecast 2022-2027 ($ million)
- Exhibit 40: Chart on Immunodiagnostic systems – Year-over-year growth 2022-2027 (%)
- Exhibit 41: Data Table on Immunodiagnostic systems – Year-over-year growth 2022-2027 (%)
- 6.5 Market opportunity by Product
- Exhibit 42: Market opportunity by Product ($ million)
- Exhibit 43: Data Table on Market opportunity by Product ($ million)
7 Market Segmentation by Application
- 7.1 Market segments
- Exhibit 44: Chart on Application – Market share 2022-2027 (%)
- Exhibit 45: Data Table on Application – Market share 2022-2027 (%)
- 7.2 Comparison by Application
- Exhibit 46: Chart on Comparison by Application
- Exhibit 47: Data Table on Comparison by Application
- 7.3 Oncology and endocrinology – Market size and forecast 2022-2027
- Exhibit 48: Chart on Oncology and endocrinology – Market size and forecast 2022-2027 ($ million)
- Exhibit 49: Data Table on Oncology and endocrinology – Market size and forecast 2022-2027 ($ million)
- Exhibit 50: Chart on Oncology and endocrinology – Year-over-year growth 2022-2027 (%)
- Exhibit 51: Data Table on Oncology and endocrinology – Year-over-year growth 2022-2027 (%)
- 7.4 Hepatitis and retrovirus – Market size and forecast 2022-2027
- Exhibit 52: Chart on Hepatitis and retrovirus – Market size and forecast 2022-2027 ($ million)
- Exhibit 53: Data Table on Hepatitis and retrovirus – Market size and forecast 2022-2027 ($ million)
- Exhibit 54: Chart on Hepatitis and retrovirus – Year-over-year growth 2022-2027 (%)
- Exhibit 55: Data Table on Hepatitis and retrovirus – Year-over-year growth 2022-2027 (%)
- 7.5 Infectious disease – Market size and forecast 2022-2027
- Exhibit 56: Chart on Infectious disease – Market size and forecast 2022-2027 ($ million)
- Exhibit 57: Data Table on Infectious disease – Market size and forecast 2022-2027 ($ million)
- Exhibit 58: Chart on Infectious disease – Year-over-year growth 2022-2027 (%)
- Exhibit 59: Data Table on Infectious disease – Year-over-year growth 2022-2027 (%)
- 7.6 GI stool – Market size and forecast 2022-2027
- Exhibit 60: Chart on GI stool – Market size and forecast 2022-2027 ($ million)
- Exhibit 61: Data Table on GI stool – Market size and forecast 2022-2027 ($ million)
- Exhibit 62: Chart on GI stool – Year-over-year growth 2022-2027 (%)
- Exhibit 63: Data Table on GI stool – Year-over-year growth 2022-2027 (%)
- 7.7 Other applications – Market size and forecast 2022-2027
- Exhibit 64: Chart on Other applications – Market size and forecast 2022-2027 ($ million)
- Exhibit 65: Data Table on Other applications – Market size and forecast 2022-2027 ($ million)
- Exhibit 66: Chart on Other applications – Year-over-year growth 2022-2027 (%)
- Exhibit 67: Data Table on Other applications – Year-over-year growth 2022-2027 (%)
- 7.8 Market opportunity by Application
- Exhibit 68: Market opportunity by Application ($ million)
- Exhibit 69: Data Table on Market opportunity by Application ($ million)
8 Customer Landscape
- 8.1 Customer landscape overview
- Exhibit 70: Analysis of price sensitivity, lifecycle, customer purchase basket, adoption rates, and purchase criteria
9 Geographic Landscape
- 9.1 Geographic segmentation
- Exhibit 71: Chart on Market share by geography 2022-2027 (%)
- Exhibit 72: Data Table on Market share by geography 2022-2027 (%)
- 9.2 Geographic comparison
- Exhibit 73: Chart on Geographic comparison
- Exhibit 74: Data Table on Geographic comparison
- 9.3 North America – Market size and forecast 2022-2027
- Exhibit 75: Chart on North America – Market size and forecast 2022-2027 ($ million)
- Exhibit 76: Data Table on North America – Market size and forecast 2022-2027 ($ million)
- Exhibit 77: Chart on North America – Year-over-year growth 2022-2027 (%)
- Exhibit 78: Data Table on North America – Year-over-year growth 2022-2027 (%)
- 9.4 Europe – Market size and forecast 2022-2027
- Exhibit 79: Chart on Europe – Market size and forecast 2022-2027 ($ million)
- Exhibit 80: Data Table on Europe – Market size and forecast 2022-2027 ($ million)
- Exhibit 81: Chart on Europe – Year-over-year growth 2022-2027 (%)
- Exhibit 82: Data Table on Europe – Year-over-year growth 2022-2027 (%)
- 9.5 Asia – Market size and forecast 2022-2027
- Exhibit 83: Chart on Asia – Market size and forecast 2022-2027 ($ million)
- Exhibit 84: Data Table on Asia – Market size and forecast 2022-2027 ($ million)
- Exhibit 85: Chart on Asia – Year-over-year growth 2022-2027 (%)
- Exhibit 86: Data Table on Asia – Year-over-year growth 2022-2027 (%)
- 9.6 Rest of World (ROW) – Market size and forecast 2022-2027
- Exhibit 87: Chart on Rest of World (ROW) – Market size and forecast 2022-2027 ($ million)
- Exhibit 88: Data Table on Rest of World (ROW) – Market size and forecast 2022-2027 ($ million)
- Exhibit 89: Chart on Rest of World (ROW) – Year-over-year growth 2022-2027 (%)
- Exhibit 90: Data Table on Rest of World (ROW) – Year-over-year growth 2022-2027 (%)
- 9.7 US – Market size and forecast 2022-2027
- Exhibit 91: Chart on US – Market size and forecast 2022-2027 ($ million)
- Exhibit 92: Data Table on US – Market size and forecast 2022-2027 ($ million)
- Exhibit 93: Chart on US – Year-over-year growth 2022-2027 (%)
- Exhibit 94: Data Table on US – Year-over-year growth 2022-2027 (%)
- 9.8 UK – Market size and forecast 2022-2027
- Exhibit 95: Chart on UK – Market size and forecast 2022-2027 ($ million)
- Exhibit 96: Data Table on UK – Market size and forecast 2022-2027 ($ million)
- Exhibit 97: Chart on UK – Year-over-year growth 2022-2027 (%)
- Exhibit 98: Data Table on UK – Year-over-year growth 2022-2027 (%)
- 9.9 Germany – Market size and forecast 2022-2027
- Exhibit 99: Chart on Germany – Market size and forecast 2022-2027 ($ million)
- Exhibit 100: Data Table on Germany – Market size and forecast 2022-2027 ($ million)
- Exhibit 101: Chart on Germany – Year-over-year growth 2022-2027 (%)
- Exhibit 102: Data Table on Germany – Year-over-year growth 2022-2027 (%)
- 9.10 Canada – Market size and forecast 2022-2027
- Exhibit 103: Chart on Canada – Market size and forecast 2022-2027 ($ million)
- Exhibit 104: Data Table on Canada – Market size and forecast 2022-2027 ($ million)
- Exhibit 105: Chart on Canada – Year-over-year growth 2022-2027 (%)
- Exhibit 106: Data Table on Canada – Year-over-year growth 2022-2027 (%)
- 9.11 China – Market size and forecast 2022-2027
- Exhibit 107: Chart on China – Market size and forecast 2022-2027 ($ million)
- Exhibit 108: Data Table on China – Market size and forecast 2022-2027 ($ million)
- Exhibit 109: Chart on China – Year-over-year growth 2022-2027 (%)
- Exhibit 110: Data Table on China – Year-over-year growth 2022-2027 (%)
- 9.12 Market opportunity by geography
- Exhibit 111: Market opportunity by geography ($ million)
- Exhibit 112: Data Tables on Market opportunity by geography ($ million)
10 Drivers, Challenges, and Trends
- 10.3 Impact of drivers and challenges
- Exhibit 113: Impact of drivers and challenges in 2022 and 2027
11 Vendor Landscape
- 11.2 Vendor landscape
- Exhibit 114: Overview on Criticality of inputs and Factors of differentiation
- 11.3 Landscape disruption
- Exhibit 115: Overview on factors of disruption
- 11.4 Industry risks
- Exhibit 116: Impact of key risks on business
12 Vendor Analysis
- 12.1 Vendors covered
- Exhibit 117: Vendors covered
- 12.2 Market positioning of vendors
- Exhibit 118: Matrix on vendor position and classification
- 12.3 Abbott Laboratories
- Exhibit 119: Abbott Laboratories – Overview
- Exhibit 120: Abbott Laboratories – Business segments
- Exhibit 121: Abbott Laboratories – Key news
- Exhibit 122: Abbott Laboratories – Key offerings
- Exhibit 123: Abbott Laboratories – Segment focus
- 12.4 Adaptive Biotechnologies Corp.
- Exhibit 124: Adaptive Biotechnologies Corp. – Overview
- Exhibit 125: Adaptive Biotechnologies Corp. – Product / Service
- Exhibit 126: Adaptive Biotechnologies Corp. – Key offerings
- 12.5 AESKU.GROUP GmbH and Co. KG
- Exhibit 127: AESKU.GROUP GmbH and Co. KG – Overview
- Exhibit 128: AESKU.GROUP GmbH and Co. KG – Product / Service
- Exhibit 129: AESKU.GROUP GmbH and Co. KG – Key offerings
- 12.6 bioMerieux SA
- Exhibit 130: bioMerieux SA – Overview
- Exhibit 131: bioMerieux SA – Product / Service
- Exhibit 132: bioMerieux SA – Key offerings
- 12.7 Danaher Corp.
- Exhibit 133: Danaher Corp. – Overview
- Exhibit 134: Danaher Corp. – Business segments
- Exhibit 135: Danaher Corp. – Key news
- Exhibit 136: Danaher Corp. – Key offerings
- Exhibit 137: Danaher Corp. – Segment focus
- 12.8 DiaSorin SpA
- Exhibit 138: DiaSorin SpA – Overview
- Exhibit 139: DiaSorin SpA – Business segments
- Exhibit 140: DiaSorin SpA – Key news
- Exhibit 141: DiaSorin SpA – Key offerings
- Exhibit 142: DiaSorin SpA – Segment focus
- 12.9 F. Hoffmann La Roche Ltd.
- Exhibit 143: F. Hoffmann La Roche Ltd. – Overview
- Exhibit 144: F. Hoffmann La Roche Ltd. – Business segments
- Exhibit 145: F. Hoffmann La Roche Ltd. – Key news
- Exhibit 146: F. Hoffmann La Roche Ltd. – Key offerings
- Exhibit 147: F. Hoffmann La Roche Ltd. – Segment focus
- 12.10 HUMAN Gesellschaft fur Biochemica und Diagnostica mbH
- Exhibit 148: HUMAN Gesellschaft fur Biochemica und Diagnostica mbH – Overview
- Exhibit 149: HUMAN Gesellschaft fur Biochemica und Diagnostica mbH – Product / Service
- Exhibit 150: HUMAN Gesellschaft fur Biochemica und Diagnostica mbH – Key offerings
- 12.11 OraSure Technologies Inc.
- Exhibit 151: OraSure Technologies Inc. – Overview
- Exhibit 152: OraSure Technologies Inc. – Business segments
- Exhibit 153: OraSure Technologies Inc. – Key offerings
- Exhibit 154: OraSure Technologies Inc. – Segment focus
- 12.12 QuidelOrtho Corp.
- Exhibit 155: QuidelOrtho Corp. – Overview
- Exhibit 156: QuidelOrtho Corp. – Product / Service
- Exhibit 157: QuidelOrtho Corp. – Key offerings
- 12.13 Siemens AG
- Exhibit 158: Siemens AG – Overview
- Exhibit 159: Siemens AG – Business segments
- Exhibit 160: Siemens AG – Key news
- Exhibit 161: Siemens AG – Key offerings
- Exhibit 162: Siemens AG – Segment focus
- 12.14 SQI Diagnostics Inc.
- Exhibit 163: SQI Diagnostics Inc. – Overview
- Exhibit 164: SQI Diagnostics Inc. – Product / Service
- Exhibit 165: SQI Diagnostics Inc. – Key offerings
- 12.15 Sysmex Corp.
- Exhibit 166: Sysmex Corp. – Overview
- Exhibit 167: Sysmex Corp. – Business segments
- Exhibit 168: Sysmex Corp. – Key offerings
- Exhibit 169: Sysmex Corp. – Segment focus
- 12.16 Tecan Trading AG
- Exhibit 170: Tecan Trading AG – Overview
- Exhibit 171: Tecan Trading AG – Business segments
- Exhibit 172: Tecan Trading AG – Key offerings
- Exhibit 173: Tecan Trading AG – Segment focus
- 12.17 Thermo Fisher Scientific Inc.
- Exhibit 174: Thermo Fisher Scientific Inc. – Overview
- Exhibit 175: Thermo Fisher Scientific Inc. – Business segments
- Exhibit 176: Thermo Fisher Scientific Inc. – Key news
- Exhibit 177: Thermo Fisher Scientific Inc. – Key offerings
- Exhibit 178: Thermo Fisher Scientific Inc. – Segment focus
13 Appendix
- 13.2 Inclusions and exclusions checklist
- Exhibit 179: Inclusions checklist
- Exhibit 180: Exclusions checklist
- 13.3 Currency conversion rates for US$
- Exhibit 181: Currency conversion rates for US$
- 13.4 Research methodology
- Exhibit 182: Research methodology
- Exhibit 183: Validation techniques employed for market sizing
- Exhibit 184: Information sources
- 13.5 List of abbreviations
- Exhibit 185: List of abbreviations
About Us
Technavio is a leading global technology research and advisory company. Their research and analysis focus on emerging market trends and provides actionable insights to help businesses identify market opportunities and develop effective strategies to optimize their market positions. With over 500 specialized analysts, Technavio’s report library consists of more than 17,000 reports and counting, covering 800 technologies, spanning across 50 countries. Their client base consists of enterprises of all sizes, including more than 100 Fortune 500 companies. This growing client base relies on Technavio’s comprehensive coverage, extensive research, and actionable market insights to identify opportunities in existing and potential markets and assess their competitive positions within changing market scenarios.
Contact
Technavio Research
Jesse Maida
Media & Marketing Executive
US: +1 844 364 1100
UK: +44 203 893 3200
Email: [email protected]
Website: www.technavio.com
SOURCE Technavio
