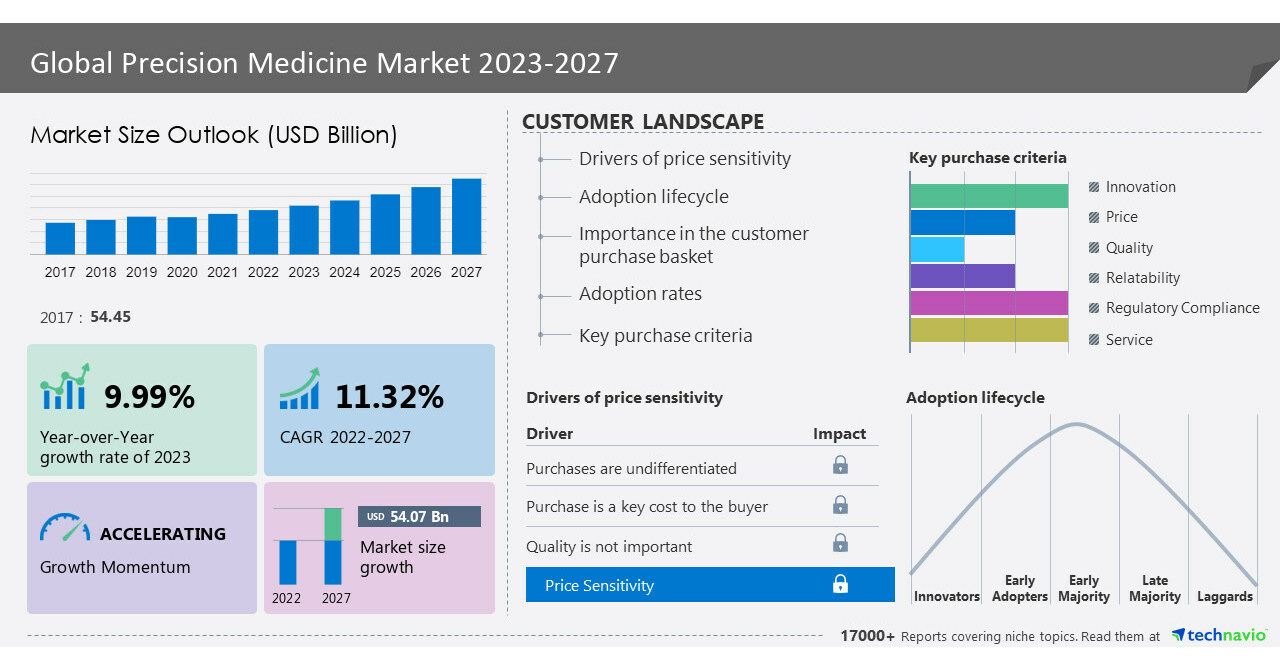
NEW YORK, June 5, 2023 /PRNewswire/ — The precision medicine market size is estimated to grow by USD 54.07 billion from 2022 to 2027. The market is estimated to be growing at a CAGR of 11.32% during the forecast period. For Comprehensive details on the market size of the historic period(2017 to 2021) and the forecast period (2023-2027) – View a Sample report
Precision Medicine Market – Market Dynamics
Factors such as the growing prevalence of chronic diseases, growing demand for personalized medicine, and the advancements in genomics and proteomics will drive the growth of the Precision Medicine Market during 2023-2027. However, data privacy and security issues associated with precision medicine might hamper the market growth.
Key Drivers
The growing prevalence of chronic diseases notably drives market growth. Diabetes, cardiovascular disease, cancer, respiratory diseases, and neurological disorders are some of the common chronic diseases. The growing geriatric population also drives the market demand for precision medicines during the forecast period.
For instance, according to the World Health Organization (WHO), the number of people aged 60 years and above will double to 2.1 billion by 2050 globally. Other factors that drive the market demand include changes in lifestyle, such as lack of physical activity, poor diet, and tobacco use. Hence, the growing prevalence of chronic diseases is expected to drive the growth of the global precision medicine market during the forecast period.
Significant Trends
A leading trend in the precision medicine market is the growing use of artificial intelligence (AI) and machine learning (ML). As a result of the use of these technologies, vast amounts of patient data can be analyzed in a short time to develop targeted and personalized treatments.
Additionally, the integration of AI/ML algorithms with precision medicine helps clinicians, doctors, and researchers solve challenging issues in personalized healthcare. Also, AI and ML can help identify potential drug targets and predict the efficacy of new drugs, in turn, speeding up the drug discovery process. Hence, the growing use of AI and ML in precision medicine is expected to support the growth of the global precision medicine market during the forecast period.
Major Challenges
A major challenge hindering the precision medicine market is data privacy and security issues. These medicines depend on the collection and analysis of large amounts of patient data, such as genetic and molecular information, medical history, and lifestyle factors. But this data is vulnerable to cyberattacks and data breaches and thus, researchers and healthcare providers should implement strong security measures to protect patient data.
Furthermore, it is important to ensure that the use of patient data is in compliance with data protection regulations. Before collecting and using their data, researchers and healthcare providers should obtain informed consent from patients. Hence, data privacy and security issues associated with precision medicine are expected to inhibit the growth of the global precision medicine market during the forecast period.
Technavio has identified key trends, drivers, and challenges in the market, which will help clients improve their strategies to stay ahead of their competitors. – View Sample Report
Company Profiles
The precision medicine market report provides complete insights on key vendors including AbbVie Inc., Amgen Inc., AstraZeneca Plc, Biocrates Life Sciences AG, Bristol Myers Squibb Co., Catalent Inc., Eli Lilly and Co., F. Hoffmann La Roche Ltd., Gilead Sciences Inc., IQVIA Holdings Inc., Johnson and Johnson Services Inc., Lonza Group Ltd., Merck and Co. Inc., Novartis AG, Parexel International Corp., Pfizer Inc., QIAGEN NV, Sanofi SA, Takeda Pharmaceutical Co. Ltd., and Thermo Fisher Scientific Inc..
What’s New? –
- Special coverage on the Russia–Ukraine war; global inflation; recovery analysis from COVID-19; supply chain disruptions, global trade tensions; and risk of recession
- Global competitiveness and key competitor positions
- Market presence across multiple geographical footprints – Strong/Active/Niche/Trivial – Buy the report!
Precision Medicine Market – Competitive Analysis
The report includes competitive analysis, a proprietary tool to analyze and evaluate the position of companies based on their industry position score and market performance score. The tool uses various factors for categorizing the players into four categories. Some of these factors considered for analysis are financial performance over the last 3 years, growth strategies, innovation score, new product launches, investments, growth in market share, etc.
Precision Medicine Market – Market Segmentation
This precision medicine market report extensively covers market segmentation by application (oncology, CNS, respiratory, immunology, and others), technology (bioinformatics, gene sequencing, drug discovery, precision molecular diagnostic, and big data analytics), and geography (North America, Europe, Asia, and Rest of World (ROW)).
- The market share growth by the oncology segment will be significant for overall market growth during the forecast period. Generally, precision medicines allow doctors to develop personalized treatment plans tailored to specific genetic mutations. With this technology, doctors can identify specific molecular pathways involved in the development and progression of cancer. Such drugs are more effective and have fewer side effects when compared to traditional chemotherapy. Precision medicine also inhibits the growth and spread of cancer while minimizing damage to healthy tissues. Hence, the increasing use of precision medicine in oncology will drive the growth of this segment during the forecast period.
For more information on segments and their impact on market growth, request a sample report!
Gain instant access to 17,000+ market research reports
Technavio’s SUBSCRIPTION platform
Related Reports:
The nuclear medicine market is estimated to grow at a CAGR of 16.48% between 2022 and 2027. The size of the market is forecast to increase by USD 8,057.89 million. This report extensively covers market segmentation by product (radiotherapeutics, equipment SPECT and PET), application (oncology, cardiology, neurology, and others.), and geography (North America, Asia, Europe, and Rest of World (ROW)). The growing adoption of SPECT/CT hybrid imaging systems is notably driving the market growth.
Based on Technavio’s market sizing methodology, the regenerative medicines market size is predicted to surge by USD 28.67 billion from 2021 to 2026 at a CAGR of 14.57%. This report further entails regenerative medicines market segmentation by technology (Cell and tissue-based and Gene therapy), and geography (North America, Europe, Asia, and Rest of World (ROW)). The increasing prevalence of chronic diseases is notably driving the regenerative medicines market growth.
|
Precision Medicine Market Scope |
|
|
Report Coverage |
Details |
|
Base year |
2022 |
|
Historic period |
2017-2021 |
|
Forecast period |
2023-2027 |
|
Growth momentum & CAGR |
Accelerate at a CAGR of 11.32% |
|
Market growth 2023-2027 |
USD 54.07 billion |
|
Market structure |
Fragmented |
|
YoY growth 2022-2023 (%) |
9.99 |
|
Regional analysis |
North America, Europe, Asia, and Rest of World (ROW) |
|
Performing market contribution |
North America at 44% |
|
Key countries |
US, Germany, UK, China, and Japan |
|
Competitive landscape |
Leading Vendors, Market Positioning of Vendors, Competitive Strategies, and Industry Risks |
|
Key companies profiled |
AbbVie Inc., Amgen Inc., AstraZeneca Plc, Biocrates Life Sciences AG, Bristol Myers Squibb Co., Catalent Inc., Eli Lilly and Co., F. Hoffmann La Roche Ltd., Gilead Sciences Inc., IQVIA Holdings Inc., Johnson and Johnson Services Inc., Lonza Group Ltd., Merck and Co. Inc., Novartis AG, Parexel International Corp., Pfizer Inc., QIAGEN NV, Sanofi SA, Takeda Pharmaceutical Co. Ltd., and Thermo Fisher Scientific Inc. |
|
Market dynamics |
Parent market analysis, Market growth inducers and obstacles, Fast-growing and slow-growing segment analysis, COVID-19 impact and recovery analysis and future consumer dynamics, Market condition analysis for forecast period. |
|
Customization purview |
If our report has not included the data that you are looking for, you can reach out to our analysts and get segments customized. |
Table of Contents
1 Executive Summary
- 1.1 Market overview
- Exhibit 01: Executive Summary – Chart on Market Overview
- Exhibit 02: Executive Summary – Data Table on Market Overview
- Exhibit 03: Executive Summary – Chart on Global Market Characteristics
- Exhibit 04: Executive Summary – Chart on Market by Geography
- Exhibit 05: Executive Summary – Chart on Market Segmentation by Application
- Exhibit 06: Executive Summary – Chart on Market Segmentation by Technology
- Exhibit 07: Executive Summary – Chart on Incremental Growth
- Exhibit 08: Executive Summary – Data Table on Incremental Growth
- Exhibit 09: Executive Summary – Chart on Vendor Market Positioning
2 Market Landscape
- 2.1 Market ecosystem
- Exhibit 10: Parent market
- Exhibit 11: Market Characteristics
3 Market Sizing
- 3.1 Market definition
- Exhibit 12: Offerings of vendors included in the market definition
- 3.2 Market segment analysis
- Exhibit 13: Market segments
- 3.4 Market outlook: Forecast for 2022-2027
- Exhibit 14: Chart on Global – Market size and forecast 2022-2027 ($ billion)
- Exhibit 15: Data Table on Global – Market size and forecast 2022-2027 ($ billion)
- Exhibit 16: Chart on Global Market: Year-over-year growth 2022-2027 (%)
- Exhibit 17: Data Table on Global Market: Year-over-year growth 2022-2027 (%)
4 Historic Market Size
- 4.1 Global precision medicine market 2017 – 2021
- Exhibit 18: Historic Market Size – Data Table on global precision medicine market 2017 – 2021 ($ billion)
- 4.2 Application Segment Analysis 2017 – 2021
- Exhibit 19: Historic Market Size – Application Segment 2017 – 2021 ($ billion)
- 4.3 Technology Segment Analysis 2017 – 2021
- Exhibit 20: Historic Market Size – Technology Segment 2017 – 2021 ($ billion)
- 4.4 Geography Segment Analysis 2017 – 2021
- Exhibit 21: Historic Market Size – Geography Segment 2017 – 2021 ($ billion)
- 4.5 Country Segment Analysis 2017 – 2021
- Exhibit 22: Historic Market Size – Country Segment 2017 – 2021 ($ billion)
5 Five Forces Analysis
- 5.1 Five forces summary
- Exhibit 23: Five forces analysis – Comparison between 2022 and 2027
- 5.2 Bargaining power of buyers
- Exhibit 24: Chart on Bargaining power of buyers – Impact of key factors 2022 and 2027
- 5.3 Bargaining power of suppliers
- Exhibit 25: Bargaining power of suppliers – Impact of key factors in 2022 and 2027
- 5.4 Threat of new entrants
- Exhibit 26: Threat of new entrants – Impact of key factors in 2022 and 2027
- 5.5 Threat of substitutes
- Exhibit 27: Threat of substitutes – Impact of key factors in 2022 and 2027
- 5.6 Threat of rivalry
- Exhibit 28: Threat of rivalry – Impact of key factors in 2022 and 2027
- 5.7 Market condition
- Exhibit 29: Chart on Market condition – Five forces 2022 and 2027
6 Market Segmentation by Application
- 6.1 Market segments
- Exhibit 30: Chart on Application – Market share 2022-2027 (%)
- Exhibit 31: Data Table on Application – Market share 2022-2027 (%)
- 6.2 Comparison by Application
- Exhibit 32: Chart on Comparison by Application
- Exhibit 33: Data Table on Comparison by Application
- 6.3 Oncology – Market size and forecast 2022-2027
- Exhibit 34: Chart on Oncology – Market size and forecast 2022-2027 ($ billion)
- Exhibit 35: Data Table on Oncology – Market size and forecast 2022-2027 ($ billion)
- Exhibit 36: Chart on Oncology – Year-over-year growth 2022-2027 (%)
- Exhibit 37: Data Table on Oncology – Year-over-year growth 2022-2027 (%)
- 6.4 CNS – Market size and forecast 2022-2027
- Exhibit 38: Chart on CNS – Market size and forecast 2022-2027 ($ billion)
- Exhibit 39: Data Table on CNS – Market size and forecast 2022-2027 ($ billion)
- Exhibit 40: Chart on CNS – Year-over-year growth 2022-2027 (%)
- Exhibit 41: Data Table on CNS – Year-over-year growth 2022-2027 (%)
- 6.5 Respiratory – Market size and forecast 2022-2027
- Exhibit 42: Chart on Respiratory – Market size and forecast 2022-2027 ($ billion)
- Exhibit 43: Data Table on Respiratory – Market size and forecast 2022-2027 ($ billion)
- Exhibit 44: Chart on Respiratory – Year-over-year growth 2022-2027 (%)
- Exhibit 45: Data Table on Respiratory – Year-over-year growth 2022-2027 (%)
- 6.6 Immunology – Market size and forecast 2022-2027
- Exhibit 46: Chart on Immunology – Market size and forecast 2022-2027 ($ billion)
- Exhibit 47: Data Table on Immunology – Market size and forecast 2022-2027 ($ billion)
- Exhibit 48: Chart on Immunology – Year-over-year growth 2022-2027 (%)
- Exhibit 49: Data Table on Immunology – Year-over-year growth 2022-2027 (%)
- 6.7 Others – Market size and forecast 2022-2027
- Exhibit 50: Chart on Others – Market size and forecast 2022-2027 ($ billion)
- Exhibit 51: Data Table on Others – Market size and forecast 2022-2027 ($ billion)
- Exhibit 52: Chart on Others – Year-over-year growth 2022-2027 (%)
- Exhibit 53: Data Table on Others – Year-over-year growth 2022-2027 (%)
- 6.8 Market opportunity by Application
- Exhibit 54: Market opportunity by Application ($ billion)
- Exhibit 55: Data Table on Market opportunity by Application ($ billion)
7 Market Segmentation by Technology
- 7.1 Market segments
- Exhibit 56: Chart on Technology – Market share 2022-2027 (%)
- Exhibit 57: Data Table on Technology – Market share 2022-2027 (%)
- 7.2 Comparison by Technology
- Exhibit 58: Chart on Comparison by Technology
- Exhibit 59: Data Table on Comparison by Technology
- 7.3 Bioinformatics – Market size and forecast 2022-2027
- Exhibit 60: Chart on Bioinformatics – Market size and forecast 2022-2027 ($ billion)
- Exhibit 61: Data Table on Bioinformatics – Market size and forecast 2022-2027 ($ billion)
- Exhibit 62: Chart on Bioinformatics – Year-over-year growth 2022-2027 (%)
- Exhibit 63: Data Table on Bioinformatics – Year-over-year growth 2022-2027 (%)
- 7.4 Gene sequencing – Market size and forecast 2022-2027
- Exhibit 64: Chart on Gene sequencing – Market size and forecast 2022-2027 ($ billion)
- Exhibit 65: Data Table on Gene sequencing – Market size and forecast 2022-2027 ($ billion)
- Exhibit 66: Chart on Gene sequencing – Year-over-year growth 2022-2027 (%)
- Exhibit 67: Data Table on Gene sequencing – Year-over-year growth 2022-2027 (%)
- 7.5 Drug discovery – Market size and forecast 2022-2027
- Exhibit 68: Chart on Drug discovery – Market size and forecast 2022-2027 ($ billion)
- Exhibit 69: Data Table on Drug discovery – Market size and forecast 2022-2027 ($ billion)
- Exhibit 70: Chart on Drug discovery – Year-over-year growth 2022-2027 (%)
- Exhibit 71: Data Table on Drug discovery – Year-over-year growth 2022-2027 (%)
- 7.6 Precision molecular diagnostic – Market size and forecast 2022-2027
- Exhibit 72: Chart on Precision molecular diagnostic – Market size and forecast 2022-2027 ($ billion)
- Exhibit 73: Data Table on Precision molecular diagnostic – Market size and forecast 2022-2027 ($ billion)
- Exhibit 74: Chart on Precision molecular diagnostic – Year-over-year growth 2022-2027 (%)
- Exhibit 75: Data Table on Precision molecular diagnostic – Year-over-year growth 2022-2027 (%)
- 7.7 Big data analytics – Market size and forecast 2022-2027
- Exhibit 76: Chart on Big data analytics – Market size and forecast 2022-2027 ($ billion)
- Exhibit 77: Data Table on Big data analytics – Market size and forecast 2022-2027 ($ billion)
- Exhibit 78: Chart on Big data analytics – Year-over-year growth 2022-2027 (%)
- Exhibit 79: Data Table on Big data analytics – Year-over-year growth 2022-2027 (%)
- 7.8 Market opportunity by Technology
- Exhibit 80: Market opportunity by Technology ($ billion)
- Exhibit 81: Data Table on Market opportunity by Technology ($ billion)
8 Customer Landscape
- 8.1 Customer landscape overview
- Exhibit 82: Analysis of price sensitivity, lifecycle, customer purchase basket, adoption rates, and purchase criteria
9 Geographic Landscape
- 9.1 Geographic segmentation
- Exhibit 83: Chart on Market share by geography 2022-2027 (%)
- Exhibit 84: Data Table on Market share by geography 2022-2027 (%)
- 9.2 Geographic comparison
- Exhibit 85: Chart on Geographic comparison
- Exhibit 86: Data Table on Geographic comparison
- 9.3 North America – Market size and forecast 2022-2027
- Exhibit 87: Chart on North America – Market size and forecast 2022-2027 ($ billion)
- Exhibit 88: Data Table on North America – Market size and forecast 2022-2027 ($ billion)
- Exhibit 89: Chart on North America – Year-over-year growth 2022-2027 (%)
- Exhibit 90: Data Table on North America – Year-over-year growth 2022-2027 (%)
- 9.4 Europe – Market size and forecast 2022-2027
- Exhibit 91: Chart on Europe – Market size and forecast 2022-2027 ($ billion)
- Exhibit 92: Data Table on Europe – Market size and forecast 2022-2027 ($ billion)
- Exhibit 93: Chart on Europe – Year-over-year growth 2022-2027 (%)
- Exhibit 94: Data Table on Europe – Year-over-year growth 2022-2027 (%)
- 9.5 Asia – Market size and forecast 2022-2027
- Exhibit 95: Chart on Asia – Market size and forecast 2022-2027 ($ billion)
- Exhibit 96: Data Table on Asia – Market size and forecast 2022-2027 ($ billion)
- Exhibit 97: Chart on Asia – Year-over-year growth 2022-2027 (%)
- Exhibit 98: Data Table on Asia – Year-over-year growth 2022-2027 (%)
- 9.6 Rest of World (ROW) – Market size and forecast 2022-2027
- Exhibit 99: Chart on Rest of World (ROW) – Market size and forecast 2022-2027 ($ billion)
- Exhibit 100: Data Table on Rest of World (ROW) – Market size and forecast 2022-2027 ($ billion)
- Exhibit 101: Chart on Rest of World (ROW) – Year-over-year growth 2022-2027 (%)
- Exhibit 102: Data Table on Rest of World (ROW) – Year-over-year growth 2022-2027 (%)
- 9.7 US – Market size and forecast 2022-2027
- Exhibit 103: Chart on US – Market size and forecast 2022-2027 ($ billion)
- Exhibit 104: Data Table on US – Market size and forecast 2022-2027 ($ billion)
- Exhibit 105: Chart on US – Year-over-year growth 2022-2027 (%)
- Exhibit 106: Data Table on US – Year-over-year growth 2022-2027 (%)
- 9.8 Germany – Market size and forecast 2022-2027
- Exhibit 107: Chart on Germany – Market size and forecast 2022-2027 ($ billion)
- Exhibit 108: Data Table on Germany – Market size and forecast 2022-2027 ($ billion)
- Exhibit 109: Chart on Germany – Year-over-year growth 2022-2027 (%)
- Exhibit 110: Data Table on Germany – Year-over-year growth 2022-2027 (%)
- 9.9 China – Market size and forecast 2022-2027
- Exhibit 111: Chart on China – Market size and forecast 2022-2027 ($ billion)
- Exhibit 112: Data Table on China – Market size and forecast 2022-2027 ($ billion)
- Exhibit 113: Chart on China – Year-over-year growth 2022-2027 (%)
- Exhibit 114: Data Table on China – Year-over-year growth 2022-2027 (%)
- 9.10 UK – Market size and forecast 2022-2027
- Exhibit 115: Chart on UK – Market size and forecast 2022-2027 ($ billion)
- Exhibit 116: Data Table on UK – Market size and forecast 2022-2027 ($ billion)
- Exhibit 117: Chart on UK – Year-over-year growth 2022-2027 (%)
- Exhibit 118: Data Table on UK – Year-over-year growth 2022-2027 (%)
- 9.11 Japan – Market size and forecast 2022-2027
- Exhibit 119: Chart on Japan – Market size and forecast 2022-2027 ($ billion)
- Exhibit 120: Data Table on Japan – Market size and forecast 2022-2027 ($ billion)
- Exhibit 121: Chart on Japan – Year-over-year growth 2022-2027 (%)
- Exhibit 122: Data Table on Japan – Year-over-year growth 2022-2027 (%)
- 9.12 Market opportunity by geography
- Exhibit 123: Market opportunity by geography ($ billion)
- Exhibit 124: Data Tables on Market opportunity by geography ($ billion)
10 Drivers, Challenges, and Trends
- 10.3 Impact of drivers and challenges
- Exhibit 125: Impact of drivers and challenges in 2022 and 2027
11 Vendor Landscape
- 11.2 Vendor landscape
- Exhibit 126: Overview on Criticality of inputs and Factors of differentiation
- 11.3 Landscape disruption
- Exhibit 127: Overview on factors of disruption
- 11.4 Industry risks
- Exhibit 128: Impact of key risks on business
12 Vendor Analysis
- 12.1 Vendors covered
- Exhibit 129: Vendors covered
- 12.2 Market positioning of vendors
- Exhibit 130: Matrix on vendor position and classification
- 12.3 Amgen Inc.
- Exhibit 131: Amgen Inc. – Overview
- Exhibit 132: Amgen Inc. – Product / Service
- Exhibit 133: Amgen Inc. – Key offerings
- 12.4 AstraZeneca Plc
- Exhibit 134: AstraZeneca Plc – Overview
- Exhibit 135: AstraZeneca Plc – Product / Service
- Exhibit 136: AstraZeneca Plc – Key news
- Exhibit 137: AstraZeneca Plc – Key offerings
- 12.5 Bristol Myers Squibb Co.
- Exhibit 138: Bristol Myers Squibb Co. – Overview
- Exhibit 139: Bristol Myers Squibb Co. – Product / Service
- Exhibit 140: Bristol Myers Squibb Co. – Key news
- Exhibit 141: Bristol Myers Squibb Co. – Key offerings
- 12.6 Catalent Inc.
- Exhibit 142: Catalent Inc. – Overview
- Exhibit 143: Catalent Inc. – Business segments
- Exhibit 144: Catalent Inc. – Key news
- Exhibit 145: Catalent Inc. – Key offerings
- Exhibit 146: Catalent Inc. – Segment focus
- 12.7 Eli Lilly and Co.
- Exhibit 147: Eli Lilly and Co. – Overview
- Exhibit 148: Eli Lilly and Co. – Product / Service
- Exhibit 149: Eli Lilly and Co. – Key offerings
- 12.8 F. Hoffmann La Roche Ltd.
- Exhibit 150: F. Hoffmann La Roche Ltd. – Overview
- Exhibit 151: F. Hoffmann La Roche Ltd. – Business segments
- Exhibit 152: F. Hoffmann La Roche Ltd. – Key news
- Exhibit 153: F. Hoffmann La Roche Ltd. – Key offerings
- Exhibit 154: F. Hoffmann La Roche Ltd. – Segment focus
- 12.9 Gilead Sciences Inc.
- Exhibit 155: Gilead Sciences Inc. – Overview
- Exhibit 156: Gilead Sciences Inc. – Product / Service
- Exhibit 157: Gilead Sciences Inc. – Key news
- Exhibit 158: Gilead Sciences Inc. – Key offerings
- 12.10 Johnson and Johnson Services Inc.
- Exhibit 159: Johnson and Johnson Services Inc. – Overview
- Exhibit 160: Johnson and Johnson Services Inc. – Business segments
- Exhibit 161: Johnson and Johnson Services Inc. – Key news
- Exhibit 162: Johnson and Johnson Services Inc. – Key offerings
- Exhibit 163: Johnson and Johnson Services Inc. – Segment focus
- 12.11 Lonza Group Ltd.
- Exhibit 164: Lonza Group Ltd. – Overview
- Exhibit 165: Lonza Group Ltd. – Business segments
- Exhibit 166: Lonza Group Ltd. – Key news
- Exhibit 167: Lonza Group Ltd. – Key offerings
- Exhibit 168: Lonza Group Ltd. – Segment focus
- 12.12 Merck and Co. Inc.
- Exhibit 169: Merck and Co. Inc. – Overview
- Exhibit 170: Merck and Co. Inc. – Business segments
- Exhibit 171: Merck and Co. Inc. – Key news
- Exhibit 172: Merck and Co. Inc. – Key offerings
- Exhibit 173: Merck and Co. Inc. – Segment focus
- 12.13 Novartis AG
- Exhibit 174: Novartis AG – Overview
- Exhibit 175: Novartis AG – Business segments
- Exhibit 176: Novartis AG – Key offerings
- Exhibit 177: Novartis AG – Segment focus
- 12.14 Pfizer Inc.
- Exhibit 178: Pfizer Inc. – Overview
- Exhibit 179: Pfizer Inc. – Product / Service
- Exhibit 180: Pfizer Inc. – Key news
- Exhibit 181: Pfizer Inc. – Key offerings
- 12.15 Sanofi SA
- Exhibit 182: Sanofi SA – Overview
- Exhibit 183: Sanofi SA – Business segments
- Exhibit 184: Sanofi SA – Key news
- Exhibit 185: Sanofi SA – Key offerings
- Exhibit 186: Sanofi SA – Segment focus
- 12.16 Takeda Pharmaceutical Co. Ltd.
- Exhibit 187: Takeda Pharmaceutical Co. Ltd. – Overview
- Exhibit 188: Takeda Pharmaceutical Co. Ltd. – Product / Service
- Exhibit 189: Takeda Pharmaceutical Co. Ltd. – Key news
- Exhibit 190: Takeda Pharmaceutical Co. Ltd. – Key offerings
- 12.17 Thermo Fisher Scientific Inc.
- Exhibit 191: Thermo Fisher Scientific Inc. – Overview
- Exhibit 192: Thermo Fisher Scientific Inc. – Business segments
- Exhibit 193: Thermo Fisher Scientific Inc. – Key news
- Exhibit 194: Thermo Fisher Scientific Inc. – Key offerings
- Exhibit 195: Thermo Fisher Scientific Inc. – Segment focus
13 Appendix
- 13.1 Scope of the report
- 13.2 Inclusions and exclusions checklist
- Exhibit 196: Inclusions checklist
- Exhibit 197: Exclusions checklist
- 13.3 Currency conversion rates for US$
- Exhibit 198: Currency conversion rates for US$
- 13.4 Research methodology
- Exhibit 199: Research methodology
- Exhibit 200: Validation techniques employed for market sizing
- Exhibit 201: Information sources
- 13.5 List of abbreviations
- Exhibit 202: List of abbreviations
About Us
Technavio is a leading global technology research and advisory company. Their research and analysis focus on emerging market trends and provides actionable insights to help businesses identify market opportunities and develop effective strategies to optimize their market positions. With over 500 specialized analysts, Technavio’s report library consists of more than 17,000 reports and counting, covering 800 technologies, spanning across 50 countries. Their client base consists of enterprises of all sizes, including more than 100 Fortune 500 companies. This growing client base relies on Technavio’s comprehensive coverage, extensive research, and actionable market insights to identify opportunities in existing and potential markets and assess their competitive positions within changing market scenarios.
Contact
Technavio Research
Jesse Maida
Media & Marketing Executive
US: +1 844 364 1100
UK: +44 203 893 3200
Email: [email protected]
Website: www.technavio.com
SOURCE Technavio
