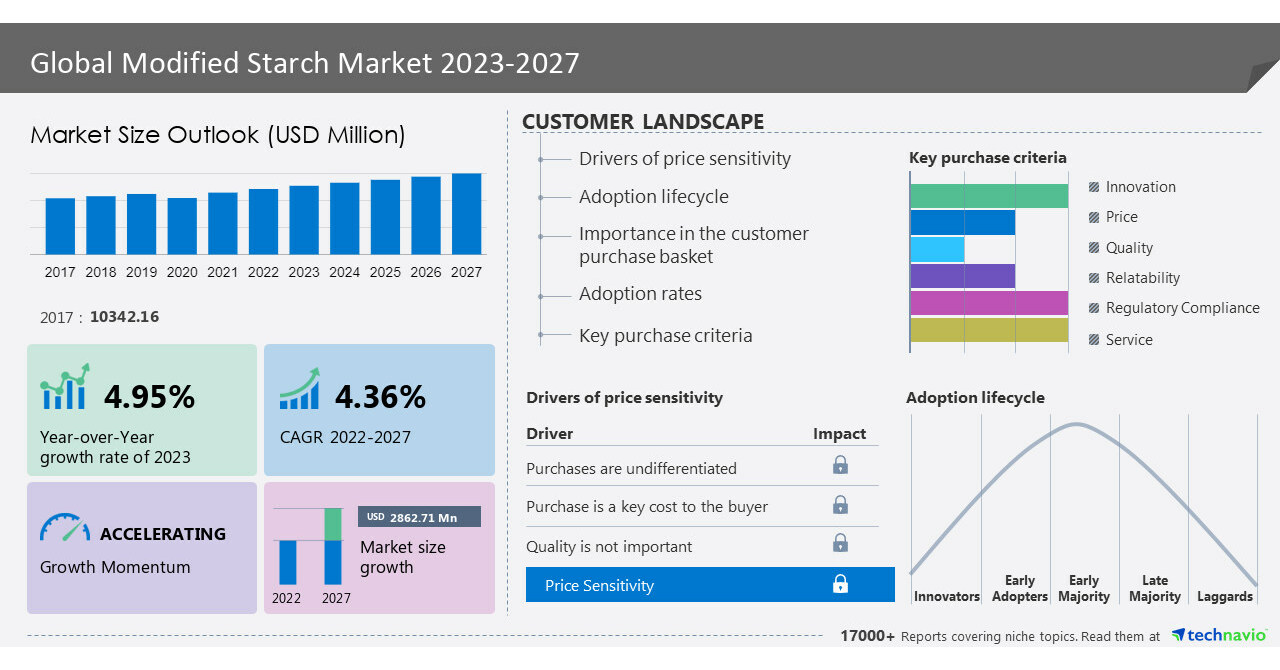
NEW YORK, Aug. 11, 2023 /PRNewswire/ — The modified starch market size is expected to grow by USD 2,862.71 million during 2022-2027, progressing at a CAGR of 4.36% as per the latest Technavio market research report. North America is estimated to account for 35% of the global market growth during the forecast period. The demand for modified starch in the region is expected to be moderate during the forecast period. The most commonly used modified starch in North America is glucose syrup. In addition, the demand for maltodextrin is growing significantly in the region. Moreover, native starch is available in abundance. North America is a leading producer of modified starch. In addition, the demand for corn starch is increasing owing to its cost-effectiveness. Such factors will fuel market growth in the regional market during the forecast period. For more insights on the market share of various regions- Download sample report in MINUTES
Modified Starch Market: Increasing demand for modified starch as thickeners to drive growth
The high demand for corn starch is driving the market growth. The demand for corn starch is increasing in the food and beverage industry due to its wide application areas and abundance, especially in agriculture-rich countries such as India and China. Corn is a major source for the production of modified starch. It is used in gluten-free products.
Moreover, modified corn starch is less expensive than wheat or tapioca starches. It is used as a thickening agent and a major source of energy. In addition, the use of cornstarch lowers blood sugar. It is also used in cosmetics for skin issues. These factors will fuel market growth during the forecast period.
Modified Starch Market: Emergence Of Modified Starch-based Plastics
The use of novel technologies for the production and development of physically modified starches is an emerging market trend. These physically modified starches include cold-water-soluble or pregelatinized granular starch and granular cold-water-swellable (CWS) starch. This new approach involves maintaining starch granule integrity while providing cold water thickening.
Furthermore, technologies like disrupting starch granules, and using controlled acid-catalyzed hydrolysis for corn starch, create a starch fat replacer with various applications, including frostings, margarine, salad dressings, and frozen novelties. Hence, such trends fuel the growth of the modified starch market during the forecast period.
To know about more drivers, trends along with challenges – Download a sample now!
Some of the key Modified Starch Market Players:
The modified starch market is fragmented and the vendors are deploying organic and inorganic growth strategies to compete in the market. Some of the market players are mentioned below:
Angel Starch and Food Pvt. Ltd., Archer Daniels Midland Co., Beneo GmbH, Cooperatie Koninklijke Avebe U.A., Emsland Starke GmbH, Everest Starch India Pvt. Ltd., Global Bio chem Technology Group Co. Ltd., Grain Processing Corp., Ingredion Inc., Qingdao CBH Co. Ltd., Roquette Freres SA, SAMYANG HOLDINGS Corp., Shubham Starch Chem Pvt. Ltd., SMS Corp. Co. Ltd., SPAC Starch Products India Pvt. Ltd., Sudzucker AG, Tate and Lyle Plc, Universal Starch Chem Allied Ltd., AGRANA BEteilgungs AG, and Cargill Inc.
What’s New?
- Special coverage on the Russia–Ukraine war; global inflation; recovery analysis from COVID-19; supply chain disruptions, global trade tensions; and risk of recession
- Global competitiveness and key competitor positions
- Market presence across multiple geographical footprints – Strong/Active/Niche/Trivial – buy the report!
Modified Starch Market: Segmentation Analysis
This modified starch market research report extensively covers market segmentation by type (dry and liquid), and end-user (food and beverage, textile and paper, and others), and Geography (North America, APAC, Europe, South America, and Middle East and Africa).
- The market share growth by the dry segment will be significant for the market’s growth during the forecast period. Dry-modified starch is an important and useful component used in the preparation of different types of foods. Modified starch is used in various industries, such as food, paper, cosmetics, personal care, and textiles. The increasing demand for natural ingredients will drive the growth of the dry segment in the global market during the forecast period.
Gain instant access to 17,000+ market research reports
Technavio’s SUBSCRIPTION platform
Related Reports:
The starch polymer market size is expected to increase by USD 365.16 million from 2021 to 2026, and the market’s growth momentum will accelerate at a CAGR of 4.89%. Furthermore, this report extensively covers starch polymer market segmentation by end-user (packaging, textile, agriculture, and others) and geography (Europe, APAC, North America, South America, and the Middle East and Africa). The rise in consumer adoption of biodegradable plastics for packaging is one of the major drivers impacting the starch polymer market growth.
The industrial starch market size is expected to increase to USD 31.30 billion from 2021 to 2026, and the market’s growth momentum will accelerate at a CAGR of 5.7%. Furthermore, this report extensively covers market segmentation by application (food and beverage, feed, pharmaceuticals, cardboard and corrugating, and others) and geography (North America, Europe, APAC, South America, and Middle East and Africa). The increased use of industrial starch as a thickener is notably driving the industrial starch market growth.
|
Modified Starch Market Scope |
|
|
Report Coverage |
Details |
|
Base year |
2022 |
|
Historic period |
2017-2021 |
|
Forecast period |
2023-2027 |
|
Growth momentum & CAGR |
Accelerate at a CAGR of 4.36% |
|
Market growth 2023-2027 |
USD 2,862.71 million |
|
Market structure |
Fragmented |
|
YoY growth 2022-2023 (%) |
4.95 |
|
Regional analysis |
North America, APAC, Europe, South America, and Middle East and Africa |
|
Performing market contribution |
North America at 35% |
|
Key countries |
US, Canada, China, Germany, and UK |
|
Competitive landscape |
Leading Vendors, Market Positioning of Vendors, Competitive Strategies, and Industry Risks |
|
Key companies profiled |
Angel Starch and Food Pvt. Ltd., Archer Daniels Midland Co., Beneo GmbH, Cooperatie Koninklijke Avebe U.A., Emsland Starke GmbH, Everest Starch India Pvt. Ltd., Global Bio chem Technology Group Co. Ltd., Grain Processing Corp., Ingredion Inc., Qingdao CBH Co. Ltd., Roquette Freres SA, SAMYANG HOLDINGS Corp., Shubham Starch Chem Pvt. Ltd., SMS Corp. Co. Ltd., SPAC Starch Products India Pvt. Ltd., Sudzucker AG, Tate and Lyle Plc, Universal Starch Chem Allied Ltd., AGRANA BEteilgungs AG, and Cargill Inc. |
|
Market dynamics |
Parent market analysis, Market growth inducers and obstacles, Fast-growing and slow-growing segment analysis, COVID-19 impact and recovery analysis and future consumer dynamics, Market condition analysis for the forecast period. |
|
Customization purview |
If our report has not included the data that you are looking for, you can reach out to our analysts and get segments customized. |
Table of Contents
1 Executive Summary
- 1.1 Market overview
- Exhibit 01: Executive Summary – Chart on Market Overview
- Exhibit 02: Executive Summary – Data Table on Market Overview
- Exhibit 03: Executive Summary – Chart on Global Market Characteristics
- Exhibit 04: Executive Summary – Chart on Market by Geography
- Exhibit 05: Executive Summary – Chart on Market Segmentation by Type
- Exhibit 06: Executive Summary – Chart on Market Segmentation by End-user
- Exhibit 07: Executive Summary – Chart on Incremental Growth
- Exhibit 08: Executive Summary – Data Table on Incremental Growth
- Exhibit 09: Executive Summary – Chart on Vendor Market Positioning
2 Market Landscape
- 2.1 Market ecosystem
- Exhibit 10: Parent market
- Exhibit 11: Market Characteristics
3 Market Sizing
- 3.1 Market definition
- Exhibit 12: Offerings of vendors included in the market definition
- 3.2 Market segment analysis
- Exhibit 13: Market segments
- 3.4 Market outlook: Forecast for 2022-2027
- Exhibit 14: Chart on Global – Market size and forecast 2022-2027 ($ million)
- Exhibit 15: Data Table on Global – Market size and forecast 2022-2027 ($ million)
- Exhibit 16: Chart on Global Market: Year-over-year growth 2022-2027 (%)
- Exhibit 17: Data Table on Global Market: Year-over-year growth 2022-2027 (%)
4 Historic Market Size
- 4.1 Global modified starch market 2017 – 2021
- Exhibit 18: Historic Market Size – Data Table on Global modified starch market 2017 – 2021 ($ million)
- 4.2 Type Segment Analysis 2017 – 2021
- Exhibit 19: Historic Market Size – Type Segment 2017 – 2021 ($ million)
- 4.3 End user Segment Analysis 2017 – 2021
- Exhibit 20: Historic Market Size – End user Segment 2017 – 2021 ($ million)
- 4.4 Geography Segment Analysis 2017 – 2021
- Exhibit 21: Historic Market Size – Geography Segment 2017 – 2021 ($ million)
- 4.5 Country Segment Analysis 2017 – 2021
- Exhibit 22: Historic Market Size – Country Segment 2017 – 2021 ($ million)
5 Five Forces Analysis
- 5.1 Five forces summary
- Exhibit 23: Five forces analysis – Comparison between 2022 and 2027
- 5.2 Bargaining power of buyers
- Exhibit 24: Chart on Bargaining power of buyers – Impact of key factors 2022 and 2027
- 5.3 Bargaining power of suppliers
- Exhibit 25: Bargaining power of suppliers – Impact of key factors in 2022 and 2027
- 5.4 Threat of new entrants
- Exhibit 26: Threat of new entrants – Impact of key factors in 2022 and 2027
- 5.5 Threat of substitutes
- Exhibit 27: Threat of substitutes – Impact of key factors in 2022 and 2027
- 5.6 Threat of rivalry
- Exhibit 28: Threat of rivalry – Impact of key factors in 2022 and 2027
- 5.7 Market condition
- Exhibit 29: Chart on Market condition – Five forces 2022 and 2027
6 Market Segmentation by Type
- 6.1 Market segments
- Exhibit 30: Chart on Type – Market share 2022-2027 (%)
- Exhibit 31: Data Table on Type – Market share 2022-2027 (%)
- 6.2 Comparison by Type
- Exhibit 32: Chart on Comparison by Type
- Exhibit 33: Data Table on Comparison by Type
- 6.3 Dry – Market size and forecast 2022-2027
- Exhibit 34: Chart on Dry – Market size and forecast 2022-2027 ($ million)
- Exhibit 35: Data Table on Dry – Market size and forecast 2022-2027 ($ million)
- Exhibit 36: Chart on Dry – Year-over-year growth 2022-2027 (%)
- Exhibit 37: Data Table on Dry – Year-over-year growth 2022-2027 (%)
- 6.4 Liquid – Market size and forecast 2022-2027
- Exhibit 38: Chart on Liquid – Market size and forecast 2022-2027 ($ million)
- Exhibit 39: Data Table on Liquid – Market size and forecast 2022-2027 ($ million)
- Exhibit 40: Chart on Liquid – Year-over-year growth 2022-2027 (%)
- Exhibit 41: Data Table on Liquid – Year-over-year growth 2022-2027 (%)
- 6.5 Market opportunity by Type
- Exhibit 42: Market opportunity by Type ($ million)
7 Market Segmentation by End-user
- 7.1 Market segments
- Exhibit 43: Chart on End-user – Market share 2022-2027 (%)
- Exhibit 44: Data Table on End-user – Market share 2022-2027 (%)
- 7.2 Comparison by End-user
- Exhibit 45: Chart on Comparison by End-user
- Exhibit 46: Data Table on Comparison by End-user
- 7.3 Food and beverage – Market size and forecast 2022-2027
- Exhibit 47: Chart on Food and beverage – Market size and forecast 2022-2027 ($ million)
- Exhibit 48: Data Table on Food and beverage – Market size and forecast 2022-2027 ($ million)
- Exhibit 49: Chart on Food and beverage – Year-over-year growth 2022-2027 (%)
- Exhibit 50: Data Table on Food and beverage – Year-over-year growth 2022-2027 (%)
- 7.4 Textile and paper – Market size and forecast 2022-2027
- Exhibit 51: Chart on Textile and paper – Market size and forecast 2022-2027 ($ million)
- Exhibit 52: Data Table on Textile and paper – Market size and forecast 2022-2027 ($ million)
- Exhibit 53: Chart on Textile and paper – Year-over-year growth 2022-2027 (%)
- Exhibit 54: Data Table on Textile and paper – Year-over-year growth 2022-2027 (%)
- 7.5 Others – Market size and forecast 2022-2027
- Exhibit 55: Chart on Others – Market size and forecast 2022-2027 ($ million)
- Exhibit 56: Data Table on Others – Market size and forecast 2022-2027 ($ million)
- Exhibit 57: Chart on Others – Year-over-year growth 2022-2027 (%)
- Exhibit 58: Data Table on Others – Year-over-year growth 2022-2027 (%)
- 7.6 Market opportunity by End-user
- Exhibit 59: Market opportunity by End-user ($ million)
8 Customer Landscape
- 8.1 Customer landscape overview
- Exhibit 60: Analysis of price sensitivity, lifecycle, customer purchase basket, adoption rates, and purchase criteria
9 Geographic Landscape
- 9.1 Geographic segmentation
- Exhibit 61: Chart on Market share by geography 2022-2027 (%)
- Exhibit 62: Data Table on Market share by geography 2022-2027 (%)
- 9.2 Geographic comparison
- Exhibit 63: Chart on Geographic comparison
- Exhibit 64: Data Table on Geographic comparison
- 9.3 North America – Market size and forecast 2022-2027
- Exhibit 65: Chart on North America – Market size and forecast 2022-2027 ($ million)
- Exhibit 66: Data Table on North America – Market size and forecast 2022-2027 ($ million)
- Exhibit 67: Chart on North America – Year-over-year growth 2022-2027 (%)
- Exhibit 68: Data Table on North America – Year-over-year growth 2022-2027 (%)
- 9.4 APAC – Market size and forecast 2022-2027
- Exhibit 69: Chart on APAC – Market size and forecast 2022-2027 ($ million)
- Exhibit 70: Data Table on APAC – Market size and forecast 2022-2027 ($ million)
- Exhibit 71: Chart on APAC – Year-over-year growth 2022-2027 (%)
- Exhibit 72: Data Table on APAC – Year-over-year growth 2022-2027 (%)
- 9.5 Europe – Market size and forecast 2022-2027
- Exhibit 73: Chart on Europe – Market size and forecast 2022-2027 ($ million)
- Exhibit 74: Data Table on Europe – Market size and forecast 2022-2027 ($ million)
- Exhibit 75: Chart on Europe – Year-over-year growth 2022-2027 (%)
- Exhibit 76: Data Table on Europe – Year-over-year growth 2022-2027 (%)
- 9.6 South America – Market size and forecast 2022-2027
- Exhibit 77: Chart on South America – Market size and forecast 2022-2027 ($ million)
- Exhibit 78: Data Table on South America – Market size and forecast 2022-2027 ($ million)
- Exhibit 79: Chart on South America – Year-over-year growth 2022-2027 (%)
- Exhibit 80: Data Table on South America – Year-over-year growth 2022-2027 (%)
- 9.7 Middle East and Africa – Market size and forecast 2022-2027
- Exhibit 81: Chart on Middle East and Africa – Market size and forecast 2022-2027 ($ million)
- Exhibit 82: Data Table on Middle East and Africa – Market size and forecast 2022-2027 ($ million)
- Exhibit 83: Chart on Middle East and Africa – Year-over-year growth 2022-2027 (%)
- Exhibit 84: Data Table on Middle East and Africa – Year-over-year growth 2022-2027 (%)
- 9.8 US – Market size and forecast 2022-2027
- Exhibit 85: Chart on US – Market size and forecast 2022-2027 ($ million)
- Exhibit 86: Data Table on US – Market size and forecast 2022-2027 ($ million)
- Exhibit 87: Chart on US – Year-over-year growth 2022-2027 (%)
- Exhibit 88: Data Table on US – Year-over-year growth 2022-2027 (%)
- 9.9 China – Market size and forecast 2022-2027
- Exhibit 89: Chart on China – Market size and forecast 2022-2027 ($ million)
- Exhibit 90: Data Table on China – Market size and forecast 2022-2027 ($ million)
- Exhibit 91: Chart on China – Year-over-year growth 2022-2027 (%)
- Exhibit 92: Data Table on China – Year-over-year growth 2022-2027 (%)
- 9.10 Canada – Market size and forecast 2022-2027
- Exhibit 93: Chart on Canada – Market size and forecast 2022-2027 ($ million)
- Exhibit 94: Data Table on Canada – Market size and forecast 2022-2027 ($ million)
- Exhibit 95: Chart on Canada – Year-over-year growth 2022-2027 (%)
- Exhibit 96: Data Table on Canada – Year-over-year growth 2022-2027 (%)
- 9.11 Germany – Market size and forecast 2022-2027
- Exhibit 97: Chart on Germany – Market size and forecast 2022-2027 ($ million)
- Exhibit 98: Data Table on Germany – Market size and forecast 2022-2027 ($ million)
- Exhibit 99: Chart on Germany – Year-over-year growth 2022-2027 (%)
- Exhibit 100: Data Table on Germany – Year-over-year growth 2022-2027 (%)
- 9.12 UK – Market size and forecast 2022-2027
- Exhibit 101: Chart on UK – Market size and forecast 2022-2027 ($ million)
- Exhibit 102: Data Table on UK – Market size and forecast 2022-2027 ($ million)
- Exhibit 103: Chart on UK – Year-over-year growth 2022-2027 (%)
- Exhibit 104: Data Table on UK – Year-over-year growth 2022-2027 (%)
- 9.13 Market opportunity by geography
- Exhibit 105: Market opportunity by geography ($ million)
10 Drivers, Challenges, and Trends
- 10.3 Impact of drivers and challenges
- Exhibit 106: Impact of drivers and challenges in 2022 and 2027
11 Vendor Landscape
- 11.2 Vendor landscape
- Exhibit 107: Overview on Criticality of inputs and Factors of differentiation
- 11.3 Landscape disruption
- Exhibit 108: Overview on factors of disruption
- 11.4 Industry risks
- Exhibit 109: Impact of key risks on business
12 Vendor Analysis
- 12.1 Vendors covered
- Exhibit 110: Vendors covered
- 12.2 Market positioning of vendors
- Exhibit 111: Matrix on vendor position and classification
- 12.3 AGRANA BEteilgungs AG
- Exhibit 112: AGRANA BEteilgungs AG – Overview
- Exhibit 113: AGRANA BEteilgungs AG – Business segments
- Exhibit 114: AGRANA BEteilgungs AG – Key offerings
- Exhibit 115: AGRANA BEteilgungs AG – Segment focus
- 12.4 Angel Starch and Food Pvt. Ltd.
- Exhibit 116: Angel Starch and Food Pvt. Ltd. – Overview
- Exhibit 117: Angel Starch and Food Pvt. Ltd. – Product / Service
- Exhibit 118: Angel Starch and Food Pvt. Ltd. – Key offerings
- 12.5 Archer Daniels Midland Co.
- Exhibit 119: Archer Daniels Midland Co. – Overview
- Exhibit 120: Archer Daniels Midland Co. – Business segments
- Exhibit 121: Archer Daniels Midland Co. – Key offerings
- Exhibit 122: Archer Daniels Midland Co. – Segment focus
- 12.6 Beneo GmbH
- Exhibit 123: Beneo GmbH – Overview
- Exhibit 124: Beneo GmbH – Product / Service
- Exhibit 125: Beneo GmbH – Key offerings
- 12.7 Cargill Inc.
- Exhibit 126: Cargill Inc. – Overview
- Exhibit 127: Cargill Inc. – Product / Service
- Exhibit 128: Cargill Inc. – Key news
- Exhibit 129: Cargill Inc. – Key offerings
- 12.8 Cooperatie Koninklijke Avebe U.A.
- Exhibit 130: Cooperatie Koninklijke Avebe U.A. – Overview
- Exhibit 131: Cooperatie Koninklijke Avebe U.A. – Product / Service
- Exhibit 132: Cooperatie Koninklijke Avebe U.A. – Key offerings
- 12.9 Emsland Starke GmbH
- Exhibit 133: Emsland Starke GmbH – Overview
- Exhibit 134: Emsland Starke GmbH – Product / Service
- Exhibit 135: Emsland Starke GmbH – Key offerings
- 12.10 Global Bio chem Technology Group Co. Ltd.
- Exhibit 136: Global Bio chem Technology Group Co. Ltd. – Overview
- Exhibit 137: Global Bio chem Technology Group Co. Ltd. – Business segments
- Exhibit 138: Global Bio chem Technology Group Co. Ltd. – Key offerings
- Exhibit 139: Global Bio chem Technology Group Co. Ltd. – Segment focus
- 12.11 Grain Processing Corp.
- Exhibit 140: Grain Processing Corp. – Overview
- Exhibit 141: Grain Processing Corp. – Product / Service
- Exhibit 142: Grain Processing Corp. – Key offerings
- 12.12 Ingredion Inc.
- Exhibit 143: Ingredion Inc. – Overview
- Exhibit 144: Ingredion Inc. – Business segments
- Exhibit 145: Ingredion Inc. – Key news
- Exhibit 146: Ingredion Inc. – Key offerings
- Exhibit 147: Ingredion Inc. – Segment focus
- 12.13 Qingdao CBH Co. Ltd.
- Exhibit 148: Qingdao CBH Co. Ltd. – Overview
- Exhibit 149: Qingdao CBH Co. Ltd. – Product / Service
- Exhibit 150: Qingdao CBH Co. Ltd. – Key offerings
- 12.14 Roquette Freres SA
- Exhibit 151: Roquette Freres SA – Overview
- Exhibit 152: Roquette Freres SA – Product / Service
- Exhibit 153: Roquette Freres SA – Key offerings
- 12.15 SMS Corp. Co. Ltd.
- Exhibit 154: SMS Corp. Co. Ltd. – Overview
- Exhibit 155: SMS Corp. Co. Ltd. – Product / Service
- Exhibit 156: SMS Corp. Co. Ltd. – Key offerings
- 12.16 Sudzucker AG
- Exhibit 157: Sudzucker AG – Overview
- Exhibit 158: Sudzucker AG – Business segments
- Exhibit 159: Sudzucker AG – Key offerings
- Exhibit 160: Sudzucker AG – Segment focus
- 12.17 Tate and Lyle Plc
- Exhibit 161: Tate and Lyle Plc – Overview
- Exhibit 162: Tate and Lyle Plc – Business segments
- Exhibit 163: Tate and Lyle Plc – Key news
- Exhibit 164: Tate and Lyle Plc – Key offerings
- Exhibit 165: Tate and Lyle Plc – Segment focus
13 Appendix
- 13.1 Scope of the report
- 13.2 Inclusions and exclusions checklist
- Exhibit 166: Inclusions checklist
- Exhibit 167: Exclusions checklist
- 13.3 Currency conversion rates for US$
- Exhibit 168: Currency conversion rates for US$
- 13.4 Research methodology
- Exhibit 169: Research methodology
- Exhibit 170: Validation techniques employed for market sizing
- Exhibit 171: Information sources
- 13.5 List of abbreviations
- Exhibit 172: List of abbreviations
About Technavio
Technavio is a leading global technology research and advisory company. Their research and analysis focuses on emerging market trends and provides actionable insights to help businesses identify market opportunities and develop effective strategies to optimize their market positions.
With over 500 specialized analysts, Technavio’s report library consists of more than 17,000 reports and counting, covering 800 technologies, spanning across 50 countries. Their client base consists of enterprises of all sizes, including more than 100 Fortune 500 companies. This growing client base relies on Technavio’s comprehensive coverage, extensive research, and actionable market insights to identify opportunities in existing and potential markets and assess their competitive positions within changing market scenarios.
Contacts
Technavio Research
Jesse Maida
Media & Marketing Executive
US: +1 844 364 1100
UK: +44 203 893 3200
Email: [email protected]
Website: www.technavio.com
SOURCE Technavio
