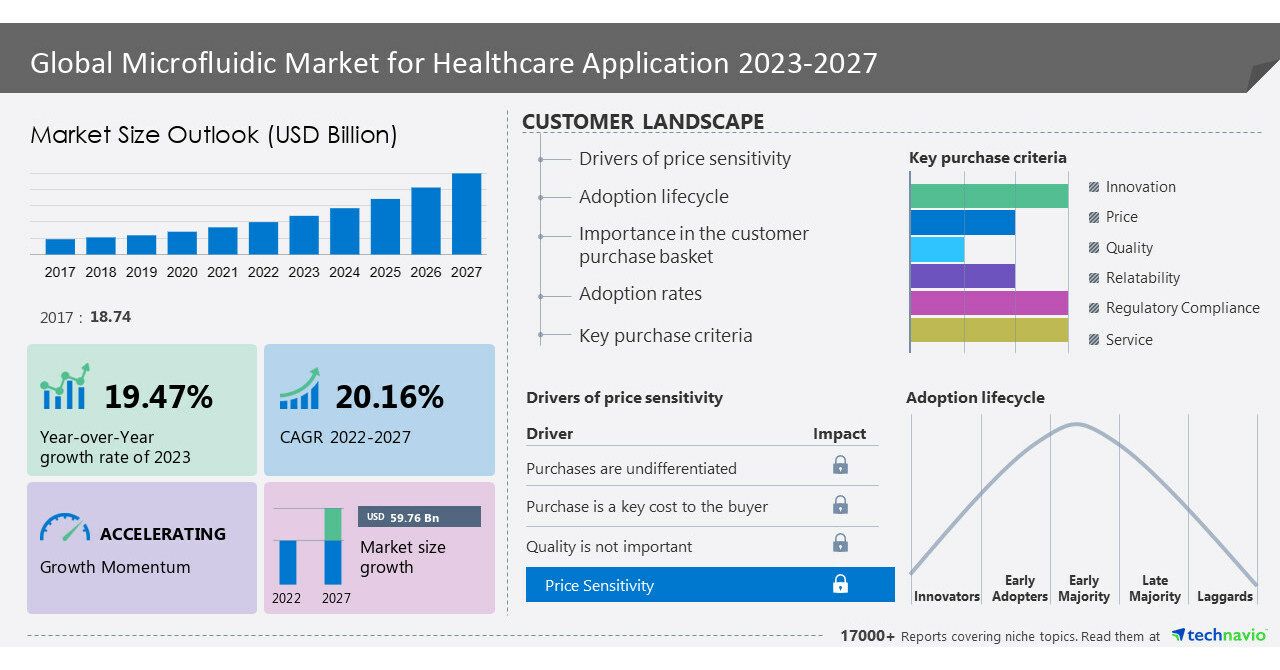
NEW YORK, June 22, 2023 /PRNewswire/ — The microfluidics market for healthcare application market size is set to grow by USD 59.76 billion from 2022 to 2027 progressing at a CAGR of 20.16% during the forecast period. The report offers an up-to-date analysis regarding the current global market scenario, the latest trends and drivers, and the overall market environment. The compact size of microfluidic devices is notably driving the microfluidics market for healthcare application growth. They are compact and use fewer reagents, resulting in lower costs and less medical waste. However, the large surface area-to-volume ratio and low thermal mass of these devices facilitate precise temperature control, rapid heat transfer, and rapid adaptation to temperature changes. The rapid diffusion of liquids improves the accuracy and speed of reactions due to the small size of microfluidic devices. This enhances the performance of microfluidic assays, shortens measurement times, and expands assay sensitivity. For instance, microfluidic devices can help reduce dispersion broadening in electrophoretic separations by rapidly dissipating Joule heat. Shortening the measurement time reduces peak broadening and thus improves sensitivity for some separations. Furthermore, microfluidic devices are used to recycle fluid temperature by forcing the fluid to flow through different chip regions at different temperatures. Therefore, such factors are expected to drive the growth of the microfluidics market for healthcare applications during the forecast period. Here is an Exclusive report talking about Market scenarios with a historical period (2017-2021) and a forecast period (2023-2027). Download Sample Report in minutes!
The microfluidics market for healthcare application covers the following areas:
Microfluidics Market For Healthcare Application Sizing
Microfluidics Market For Healthcare Application Forecast
Microfluidics Market For Healthcare Application Analysis
The report on the microfluidics market for healthcare application provides a holistic update, market size and forecast, trends, growth drivers, and challenges, as well as vendor analysis.
Microfluidics Market For Healthcare Application 2023-2027 – Market Dynamics
Significant Trend
The use of paper-based microfluidic devices is an emerging trend influencing the microfluidics market for healthcare application growth. Paper-based microfluidic devices use hydrophobic channel walls printed on paper. These hydrophobic walls guarantee controlled velocity and direction of liquid flow. Paper-based technology was limited to simple design devices in 2020. Moreover, the fabrication of microfluidic devices from paper technology is anticipated to have a substantial impact on the microfluidics market during the forecast period. Further, these devices and equipment require trained professionals to operate, further raising costs. To overcome these concerns, researchers are focusing on developing paper-based microfluidic devices. In this process, the substrate for generating micro fluids consists of paper. Paper microfluidic devices are inexpensive and environmentally friendly. Thus, these devices are in great demand in both developed and developing countries. Another significance of making paper microfluidics a major trend in the global microfluidics market for healthcare applications is the ability to immediately perform multiple medical tests using chips. This can be done when there is an urgent need or in remote areas where basic facilities such as electricity are not available to power medical equipment. Therefore, such factors make them highly attractive and are likely to drive the growth of the market.
Major Challenge
The changes in the properties of fluids at the microscopic level are challenging the microfluidics market for healthcare application growth. Microfluidics is the study of fluids at the microscopic scale. At this scale, the physical properties of fluids change significantly, and new phenomena emerge. For example, surface tension, fluid resistance, and energy dissipation become much more important. The Reynolds number is a dimensionless quantity that compares the momentum of a fluid to its viscosity. It is used to determine whether a fluid flow is laminar or turbulent. Another important property to consider in drug testing is slip resistance. At the microscopic scale, no slip occurs between liquids and solids. This means that the liquid molecules adhere to the solid surface and move with it. This results in the formation of shear stress, which is an important factor in cell interactions. Shear stress must be considered when designing microfluidic chips. Increased shear stress can inhibit cell interactions, so it is important to control the shear stress in the chip design. This can be done by modeling or calculating the shear stress, or by using techniques to reduce the shear stress. Such factors are expected to hinder the growth of the microfluidics market for healthcare application during the forecast period.
What’s New? –
- Special coverage on the Russia–Ukraine war; global inflation; recovery analysis from COVID-19; supply chain disruptions, global trade tensions; and risk of recession
- Global competitiveness and key competitor positions
- Market presence across multiple geographical footprints – Strong/Active/Niche/Trivial – Buy the report!
Microfluidics Market For Healthcare Application 2022-2027: Market Segmentation
This microfluidics market for healthcare application report extensively covers market segmentation by application (In-vitro diagnostics, pharmaceutical research, and drug delivery services), material (polymer-based, glass-based, and silicon-based), and geography (North America, Europe, APAC, South America, and Middle East and Africa).
- The market share growth by the in-vitro diagnostics segment will be significant during the forecast period. Microfluidics is a promising technology for in-vitro diagnostics (IVD). IVD is a broad term that encompasses a wide range of diagnostic tests that are performed outside of the human body. Microfluidic diagnostic kits are compact and integrated systems that can provide rapid turnaround times and immediate results. This can lead to significant cost savings and improved patient outcomes. One example of a microfluidic diagnostic kit is Cepheid’s automated microfluidic polymerase chain reaction (PCR) system. This system is used for the rapid screening and diagnosis of methicillin-resistant Staphylococcus aureus (MRSA) infections in hospitals. It can also be used by doctors to track their patients’ health regularly and by patients to monitor their own health. The advantages of microfluidic IVD kits have led to a surge of investment in the market. This is expected to continue as the technology continues to develop. This report presents a detailed picture of the market by way of study, synthesis, and summation of data from multiple sources through an analysis of key parameters- View Sample Report
Companies Mentioned
- 908 Devices Inc.
- Agilent Technologies Inc.
- bioMerieux SA
- Bio Rad Laboratories Inc.
- Blacktrace Holdings Ltd.
- Cellix Ltd.
- Danaher Corp.
- Elveflow
- Fluigent SA
- General Electric Co.
- Hamilton Bonaduz AG
- Illumina Inc.
- Microfluidic Chipshop GmbH
- MICRUX FLUIDIC S.L.
- Perkin Elmer Inc.
- SMC Corp.
- Teledyne Technologies Inc.
- Thermo Fisher Scientific Inc.
- uFluidix Inc.
- QIAGEN NV
VENDOR OFFERING
- 908 Devices Inc. – The company offers microfluidics for healthcare applications such as microfluidic CE.
- Agilent Technologies Inc. – The company offers microfluidics for healthcare applications such as Agilent 2100 Bioanalyzer.
- bioMerieux SA – The company offers microfluidics for healthcare applications such as Nuclisens EasyQ.
Gain instant access to 17,000+ market research reports.
Technavio’s SUBSCRIPTION platform
Related Reports:
The 3D printing market in the healthcare industry size is estimated to grow at a CAGR of 18.12% between 2022 and 2027. This report extensively covers market segmentation by application (orthopaedic and spinal, dental, hearing aids, and others), technology (stereolithography, granular materials binding, and others), and geography (North America, Europe, Asia, and the Rest of the World (ROW)). Increased demand for personalized or customized medical devices is the key factor driving the growth of the global 3D printing market in the healthcare industry.
The microfluidics technology market share is expected to increase by USD 29.41 billion from 2021 to 2026, and the market’s growth momentum will accelerate at a CAGR of 19.42%. This report extensively covers the microfluidics technology market segmentation by material (polymer-based microfluidics, glass-based microfluidics, silicon-based microfluidics, and others), end-user (hospitals, diagnostic centers, and academic institutes), and geographic landscape (North America, Europe, Asia, and the Rest of the World (ROW)). Increasing applications in molecular biology is one of the key drivers supporting the microfluidics technology market growth.
|
Microfluidics Market For Healthcare Application Scope |
|
|
Report Coverage |
Details |
|
Base year |
2022 |
|
Historic period |
2017-2021 |
|
Forecast period |
2023-2027 |
|
Growth momentum & CAGR |
Accelerate at a CAGR of 20.16% |
|
Market growth 2023-2027 |
USD 59.76 billion |
|
Market structure |
Fragmented |
|
YoY growth 2022-2023(%) |
19.47 |
|
Regional analysis |
North America, Europe, APAC, South America, and Middle East and Africa |
|
Performing market contribution |
North America at 45% |
|
Key countries |
US, China, Japan, Germany, and UK |
|
Competitive landscape |
Leading Vendors, Market Positioning of Vendors, Competitive Strategies, and Industry Risks |
|
Key companies profiled |
908 Devices Inc., Agilent Technologies Inc., bioMerieux SA, Bio Rad Laboratories Inc., Blacktrace Holdings Ltd., Cellix Ltd., Danaher Corp., Elveflow, Fluigent SA, General Electric Co., Hamilton Bonaduz AG, Illumina Inc., Microfluidic Chipshop GmbH, MICRUX FLUIDIC S.L., Perkin Elmer Inc., SMC Corp., Teledyne Technologies Inc., Thermo Fisher Scientific Inc., uFluidix Inc., and QIAGEN NV |
|
Market dynamics |
Parent market analysis, Market growth inducers and obstacles, Fast-growing and slow-growing segment analysis, COVID 19 impact and recovery analysis and future consumer dynamics, Market condition analysis for forecast period |
|
Customization purview |
If our report has not included the data that you are looking for, you can reach out to our analysts and get segments customized. |
Key Topics Covered:
1 Executive Summary
- 1.1 Market overview
- Exhibit 01: Executive Summary – Chart on Market Overview
- Exhibit 02: Executive Summary – Data Table on Market Overview
- Exhibit 03: Executive Summary – Chart on Global Market Characteristics
- Exhibit 04: Executive Summary – Chart on Market by Geography
- Exhibit 05: Executive Summary – Chart on Market Segmentation by Application
- Exhibit 06: Executive Summary – Chart on Market Segmentation by Material
- Exhibit 07: Executive Summary – Chart on Incremental Growth
- Exhibit 08: Executive Summary – Data Table on Incremental Growth
- Exhibit 09: Executive Summary – Chart on Vendor Market Positioning
2 Market Landscape
- 2.1 Market ecosystem
- Exhibit 10: Parent market
- Exhibit 11: Market Characteristics
3 Market Sizing
- 3.1 Market definition
- Exhibit 12: Offerings of vendors included in the market definition
- 3.2 Market segment analysis
- Exhibit 13: Market segments
- 3.4 Market outlook: Forecast for 2022-2027
- Exhibit 14: Chart on Global – Market size and forecast 2022-2027 ($ billion)
- Exhibit 15: Data Table on Global – Market size and forecast 2022-2027 ($ billion)
- Exhibit 16: Chart on Global Market: Year-over-year growth 2022-2027 (%)
- Exhibit 17: Data Table on Global Market: Year-over-year growth 2022-2027 (%)
4 Historic Market Size
- 4.1 Global microfluidic market for healthcare application 2017 – 2021
- Exhibit 18: Historic Market Size – Data Table on Global microfluidic market for healthcare application 2017 – 2021 ($ billion)
- 4.2 Application Segment Analysis 2017 – 2021
- Exhibit 19: Historic Market Size – Application Segment 2017 – 2021 ($ billion)
- 4.3 Material Segment Analysis 2017 – 2021
- Exhibit 20: Historic Market Size – Material Segment 2017 – 2021 ($ billion)
- 4.4 Geography Segment Analysis 2017 – 2021
- Exhibit 21: Historic Market Size – Geography Segment 2017 – 2021 ($ billion)
- 4.5 Country Segment Analysis 2017 – 2021
- Exhibit 22: Historic Market Size – Country Segment 2017 – 2021 ($ billion)
5 Five Forces Analysis
- 5.1 Five forces summary
- Exhibit 23: Five forces analysis – Comparison between 2022 and 2027
- 5.2 Bargaining power of buyers
- Exhibit 24: Chart on Bargaining power of buyers – Impact of key factors 2022 and 2027
- 5.3 Bargaining power of suppliers
- Exhibit 25: Bargaining power of suppliers – Impact of key factors in 2022 and 2027
- 5.4 Threat of new entrants
- Exhibit 26: Threat of new entrants – Impact of key factors in 2022 and 2027
- 5.5 Threat of substitutes
- Exhibit 27: Threat of substitutes – Impact of key factors in 2022 and 2027
- 5.6 Threat of rivalry
- Exhibit 28: Threat of rivalry – Impact of key factors in 2022 and 2027
- 5.7 Market condition
- Exhibit 29: Chart on Market condition – Five forces 2022 and 2027
6 Market Segmentation by Application
- 6.1 Market segments
- Exhibit 30: Chart on Application – Market share 2022-2027 (%)
- Exhibit 31: Data Table on Application – Market share 2022-2027 (%)
- 6.2 Comparison by Application
- Exhibit 32: Chart on Comparison by Application
- Exhibit 33: Data Table on Comparison by Application
- 6.3 In-vitro diagnostics – Market size and forecast 2022-2027
- Exhibit 34: Chart on In-vitro diagnostics – Market size and forecast 2022-2027 ($ billion)
- Exhibit 35: Data Table on In-vitro diagnostics – Market size and forecast 2022-2027 ($ billion)
- Exhibit 36: Chart on In-vitro diagnostics – Year-over-year growth 2022-2027 (%)
- Exhibit 37: Data Table on In-vitro diagnostics – Year-over-year growth 2022-2027 (%)
- 6.4 Pharmaceutical research – Market size and forecast 2022-2027
- Exhibit 38: Chart on Pharmaceutical research – Market size and forecast 2022-2027 ($ billion)
- Exhibit 39: Data Table on Pharmaceutical research – Market size and forecast 2022-2027 ($ billion)
- Exhibit 40: Chart on Pharmaceutical research – Year-over-year growth 2022-2027 (%)
- Exhibit 41: Data Table on Pharmaceutical research – Year-over-year growth 2022-2027 (%)
- 6.5 Drug delivery services – Market size and forecast 2022-2027
- Exhibit 42: Chart on Drug delivery services – Market size and forecast 2022-2027 ($ billion)
- Exhibit 43: Data Table on Drug delivery services – Market size and forecast 2022-2027 ($ billion)
- Exhibit 44: Chart on Drug delivery services – Year-over-year growth 2022-2027 (%)
- Exhibit 45: Data Table on Drug delivery services – Year-over-year growth 2022-2027 (%)
- 6.6 Market opportunity by Application
- Exhibit 46: Market opportunity by Application ($ billion)
- Exhibit 47: Data Table on Market opportunity by Application ($ billion)
7 Market Segmentation by Material
- 7.1 Market segments
- Exhibit 48: Chart on Material – Market share 2022-2027 (%)
- Exhibit 49: Data Table on Material – Market share 2022-2027 (%)
- 7.2 Comparison by Material
- Exhibit 50: Chart on Comparison by Material
- Exhibit 51: Data Table on Comparison by Material
- 7.3 Polymer-based – Market size and forecast 2022-2027
- Exhibit 52: Chart on Polymer-based – Market size and forecast 2022-2027 ($ billion)
- Exhibit 53: Data Table on Polymer-based – Market size and forecast 2022-2027 ($ billion)
- Exhibit 54: Chart on Polymer-based – Year-over-year growth 2022-2027 (%)
- Exhibit 55: Data Table on Polymer-based – Year-over-year growth 2022-2027 (%)
- 7.4 Glass-based – Market size and forecast 2022-2027
- Exhibit 56: Chart on Glass-based – Market size and forecast 2022-2027 ($ billion)
- Exhibit 57: Data Table on Glass-based – Market size and forecast 2022-2027 ($ billion)
- Exhibit 58: Chart on Glass-based – Year-over-year growth 2022-2027 (%)
- Exhibit 59: Data Table on Glass-based – Year-over-year growth 2022-2027 (%)
- 7.5 Silicon-based – Market size and forecast 2022-2027
- Exhibit 60: Chart on Silicon-based – Market size and forecast 2022-2027 ($ billion)
- Exhibit 61: Data Table on Silicon-based – Market size and forecast 2022-2027 ($ billion)
- Exhibit 62: Chart on Silicon-based – Year-over-year growth 2022-2027 (%)
- Exhibit 63: Data Table on Silicon-based – Year-over-year growth 2022-2027 (%)
- 7.6 Market opportunity by Material
- Exhibit 64: Market opportunity by Material ($ billion)
- Exhibit 65: Data Table on Market opportunity by Material ($ billion)
8 Customer Landscape
- 8.1 Customer landscape overview
- Exhibit 66: Analysis of price sensitivity, lifecycle, customer purchase basket, adoption rates, and purchase criteria
9 Geographic Landscape
- 9.1 Geographic segmentation
- Exhibit 67: Chart on Market share by geography 2022-2027 (%)
- Exhibit 68: Data Table on Market share by geography 2022-2027 (%)
- 9.2 Geographic comparison
- Exhibit 69: Chart on Geographic comparison
- Exhibit 70: Data Table on Geographic comparison
- 9.3 North America – Market size and forecast 2022-2027
- Exhibit 71: Chart on North America – Market size and forecast 2022-2027 ($ billion)
- Exhibit 72: Data Table on North America – Market size and forecast 2022-2027 ($ billion)
- Exhibit 73: Chart on North America – Year-over-year growth 2022-2027 (%)
- Exhibit 74: Data Table on North America – Year-over-year growth 2022-2027 (%)
- 9.4 Europe – Market size and forecast 2022-2027
- Exhibit 75: Chart on Europe – Market size and forecast 2022-2027 ($ billion)
- Exhibit 76: Data Table on Europe – Market size and forecast 2022-2027 ($ billion)
- Exhibit 77: Chart on Europe – Year-over-year growth 2022-2027 (%)
- Exhibit 78: Data Table on Europe – Year-over-year growth 2022-2027 (%)
- 9.5 APAC – Market size and forecast 2022-2027
- Exhibit 79: Chart on APAC – Market size and forecast 2022-2027 ($ billion)
- Exhibit 80: Data Table on APAC – Market size and forecast 2022-2027 ($ billion)
- Exhibit 81: Chart on APAC – Year-over-year growth 2022-2027 (%)
- Exhibit 82: Data Table on APAC – Year-over-year growth 2022-2027 (%)
- 9.6 South America – Market size and forecast 2022-2027
- Exhibit 83: Chart on South America – Market size and forecast 2022-2027 ($ billion)
- Exhibit 84: Data Table on South America – Market size and forecast 2022-2027 ($ billion)
- Exhibit 85: Chart on South America – Year-over-year growth 2022-2027 (%)
- Exhibit 86: Data Table on South America – Year-over-year growth 2022-2027 (%)
- 9.7 Middle East and Africa – Market size and forecast 2022-2027
- Exhibit 87: Chart on Middle East and Africa – Market size and forecast 2022-2027 ($ billion)
- Exhibit 88: Data Table on Middle East and Africa – Market size and forecast 2022-2027 ($ billion)
- Exhibit 89: Chart on Middle East and Africa – Year-over-year growth 2022-2027 (%)
- Exhibit 90: Data Table on Middle East and Africa – Year-over-year growth 2022-2027 (%)
- 9.8 US – Market size and forecast 2022-2027
- Exhibit 91: Chart on US – Market size and forecast 2022-2027 ($ billion)
- Exhibit 92: Data Table on US – Market size and forecast 2022-2027 ($ billion)
- Exhibit 93: Chart on US – Year-over-year growth 2022-2027 (%)
- Exhibit 94: Data Table on US – Year-over-year growth 2022-2027 (%)
- 9.9 China – Market size and forecast 2022-2027
- Exhibit 95: Chart on China – Market size and forecast 2022-2027 ($ billion)
- Exhibit 96: Data Table on China – Market size and forecast 2022-2027 ($ billion)
- Exhibit 97: Chart on China – Year-over-year growth 2022-2027 (%)
- Exhibit 98: Data Table on China – Year-over-year growth 2022-2027 (%)
- 9.10 Germany – Market size and forecast 2022-2027
- Exhibit 99: Chart on Germany – Market size and forecast 2022-2027 ($ billion)
- Exhibit 100: Data Table on Germany – Market size and forecast 2022-2027 ($ billion)
- Exhibit 101: Chart on Germany – Year-over-year growth 2022-2027 (%)
- Exhibit 102: Data Table on Germany – Year-over-year growth 2022-2027 (%)
- 9.11 UK – Market size and forecast 2022-2027
- Exhibit 103: Chart on UK – Market size and forecast 2022-2027 ($ billion)
- Exhibit 104: Data Table on UK – Market size and forecast 2022-2027 ($ billion)
- Exhibit 105: Chart on UK – Year-over-year growth 2022-2027 (%)
- Exhibit 106: Data Table on UK – Year-over-year growth 2022-2027 (%)
- 9.12 Japan – Market size and forecast 2022-2027
- Exhibit 107: Chart on Japan – Market size and forecast 2022-2027 ($ billion)
- Exhibit 108: Data Table on Japan – Market size and forecast 2022-2027 ($ billion)
- Exhibit 109: Chart on Japan – Year-over-year growth 2022-2027 (%)
- Exhibit 110: Data Table on Japan – Year-over-year growth 2022-2027 (%)
- 9.13 Market opportunity by geography
- Exhibit 111: Market opportunity by geography ($ billion)
- Exhibit 112: Data Tables on Market opportunity by geography ($ billion)
10 Drivers, Challenges, and Trends
- 10.3 Impact of drivers and challenges
- Exhibit 113: Impact of drivers and challenges in 2022 and 2027
11 Vendor Landscape
- 11.2 Vendor landscape
- Exhibit 114: Overview on Criticality of inputs and Factors of differentiation
- 11.3 Landscape disruption
- Exhibit 115: Overview on factors of disruption
- 11.4 Industry risks
- Exhibit 116: Impact of key risks on business
12 Vendor Analysis
- 12.1 Vendors covered
- Exhibit 117: Vendors covered
- 12.2 Market positioning of vendors
- Exhibit 118: Matrix on vendor position and classification
- 12.3 908 Devices Inc.
- Exhibit 119: 908 Devices Inc. – Overview
- Exhibit 120: 908 Devices Inc. – Product / Service
- Exhibit 121: 908 Devices Inc. – Key offerings
- 12.4 Agilent Technologies Inc.
- Exhibit 122: Agilent Technologies Inc. – Overview
- Exhibit 123: Agilent Technologies Inc. – Business segments
- Exhibit 124: Agilent Technologies Inc. – Key offerings
- Exhibit 125: Agilent Technologies Inc. – Segment focus
- 12.5 bioMerieux SA
- Exhibit 126: bioMerieux SA – Overview
- Exhibit 127: bioMerieux SA – Product / Service
- Exhibit 128: bioMerieux SA – Key offerings
- 12.6 Bio Rad Laboratories Inc.
- Exhibit 129: Bio Rad Laboratories Inc. – Overview
- Exhibit 130: Bio Rad Laboratories Inc. – Business segments
- Exhibit 131: Bio Rad Laboratories Inc. – Key news
- Exhibit 132: Bio Rad Laboratories Inc. – Key offerings
- Exhibit 133: Bio Rad Laboratories Inc. – Segment focus
- 12.7 Blacktrace Holdings Ltd.
- Exhibit 134: Blacktrace Holdings Ltd. – Overview
- Exhibit 135: Blacktrace Holdings Ltd. – Product / Service
- Exhibit 136: Blacktrace Holdings Ltd. – Key offerings
- 12.8 Cellix Ltd.
- Exhibit 137: Cellix Ltd. – Overview
- Exhibit 138: Cellix Ltd. – Product / Service
- Exhibit 139: Cellix Ltd. – Key offerings
- 12.9 Danaher Corp.
- Exhibit 140: Danaher Corp. – Overview
- Exhibit 141: Danaher Corp. – Business segments
- Exhibit 142: Danaher Corp. – Key news
- Exhibit 143: Danaher Corp. – Key offerings
- Exhibit 144: Danaher Corp. – Segment focus
- 12.10 Fluigent SA
- Exhibit 145: Fluigent SA – Overview
- Exhibit 146: Fluigent SA – Product / Service
- Exhibit 147: Fluigent SA – Key offerings
- 12.11 Illumina Inc.
- Exhibit 148: Illumina Inc. – Overview
- Exhibit 149: Illumina Inc. – Business segments
- Exhibit 150: Illumina Inc. – Key news
- Exhibit 151: Illumina Inc. – Key offerings
- Exhibit 152: Illumina Inc. – Segment focus
- 12.12 MICRUX FLUIDIC S.L.
- Exhibit 153: MICRUX FLUIDIC S.L. – Overview
- Exhibit 154: MICRUX FLUIDIC S.L. – Product / Service
- Exhibit 155: MICRUX FLUIDIC S.L. – Key offerings
- 12.13 Perkin Elmer Inc.
- Exhibit 156: Perkin Elmer Inc. – Overview
- Exhibit 157: Perkin Elmer Inc. – Business segments
- Exhibit 158: Perkin Elmer Inc. – Key news
- Exhibit 159: Perkin Elmer Inc. – Key offerings
- Exhibit 160: Perkin Elmer Inc. – Segment focus
- 12.14 QIAGEN NV
- Exhibit 161: QIAGEN NV – Overview
- Exhibit 162: QIAGEN NV – Product / Service
- Exhibit 163: QIAGEN NV – Key news
- Exhibit 164: QIAGEN NV – Key offerings
- 12.15 Teledyne Technologies Inc.
- Exhibit 165: Teledyne Technologies Inc. – Overview
- Exhibit 166: Teledyne Technologies Inc. – Business segments
- Exhibit 167: Teledyne Technologies Inc. – Key news
- Exhibit 168: Teledyne Technologies Inc. – Key offerings
- Exhibit 169: Teledyne Technologies Inc. – Segment focus
- 12.16 Thermo Fisher Scientific Inc.
- Exhibit 170: Thermo Fisher Scientific Inc. – Overview
- Exhibit 171: Thermo Fisher Scientific Inc. – Business segments
- Exhibit 172: Thermo Fisher Scientific Inc. – Key news
- Exhibit 173: Thermo Fisher Scientific Inc. – Key offerings
- Exhibit 174: Thermo Fisher Scientific Inc. – Segment focus
- 12.17 uFluidix Inc.
- Exhibit 175: uFluidix Inc. – Overview
- Exhibit 176: uFluidix Inc. – Product / Service
- Exhibit 177: uFluidix Inc. – Key offerings
13 Appendix
- 13.1 Scope of the report
- 13.2 Inclusions and exclusions checklist
- Exhibit 178: Inclusions checklist
- Exhibit 179: Exclusions checklist
- 13.3 Currency conversion rates for US$
- Exhibit 180: Currency conversion rates for US$
- 13.4 Research methodology
- Exhibit 181: Research methodology
- Exhibit 182: Validation techniques employed for market sizing
- Exhibit 183: Information sources
- 13.5 List of abbreviations
- Exhibit 184: List of abbreviations
About Us
Technavio is a leading global technology research and advisory company. Their research and analysis focus on emerging market trends and provide actionable insights to help businesses identify market opportunities and develop effective strategies to optimize their market positions. With over 500 specialized analysts, Technavio’s report library consists of more than 17,000 reports and counting, covering 800 technologies, spanning 50 countries. Their client base consists of enterprises of all sizes, including more than 100 Fortune 500 companies. This growing client base relies on Technavio’s comprehensive coverage, extensive research, and actionable market insights to identify opportunities in existing and potential markets and assess their competitive positions within changing market scenarios.
Contact
Technavio Research
Jesse Maida
Media & Marketing Executive
US: +1 844 364 1100
UK: +44 203 893 3200
Email: [email protected]
Website: www.technavio.com
SOURCE Technavio
