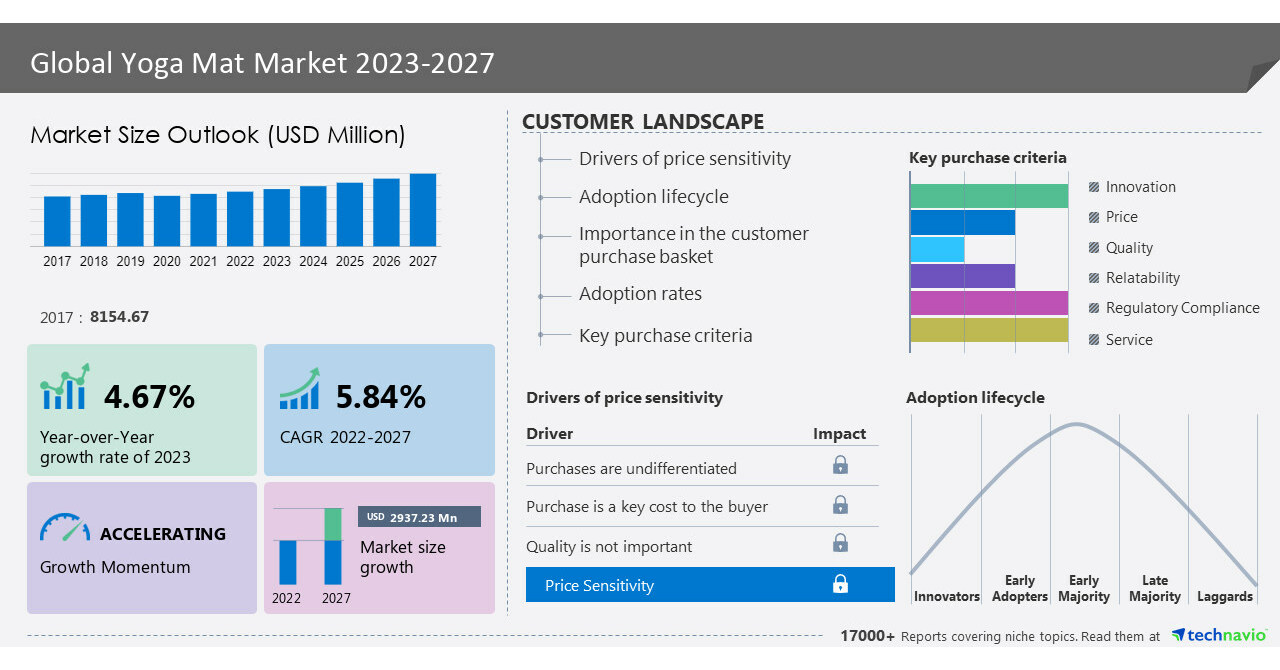
NEW YORK, June 2, 2023 /PRNewswire/ — The global yoga mat market size is estimated to grow by USD 2,937.23 million from 2022 to 2027, according to Technavio. The market is estimated to grow at a CAGR of 5.84%. North America accounted for the highest market share of the global market in 2022 and is estimated to witness an incremental growth of 33% during the forecast period. The steady growth of the yoga mat market in North America can be attributed to the increasing adoption of healthy lifestyles by people in the region. The US is the most lucrative market for yoga mats in the region, primarily driven by the increasing number of fitness centers and health clubs. Canada and Mexico are other significant markets for yoga mats in the region. Yoga is widely practiced across most of the region, which is expected to support the market growth in the region during the forecast period. For more insights on the historic period (2017 to 2021), and forecast market size (2023 to 2027) – Request a sample report.
What’s New?
- Special coverage on the Russia–Ukraine war; global inflation; recovery analysis from COVID-19; supply chain disruptions, global trade tensions; and risk of recession
- Global competitiveness and key competitor positions
- Market presence across multiple geographical footprints – Strong/Active/Niche/Trivial – buy the report!
Yoga mat market – Segmentation assessment
Segment overview
Technavio has segmented the market based on distribution channel (offline and online), end-user (personal and health clubs), and geography (North America, Europe, APAC, South America, and Middle East and Africa).
The market share growth of the offline segment, which includes pharmacies, mono-brand stores, department stores, hypermarkets, supermarkets, and specialty stores, is expected to be significant during the forecast period. Mono-brand stores are retail establishments with a single brand offering. These independent retailers offer a wide range of goods under the same brand. They draw many customers due to their upscale appearance. Hence, the distribution of yoga mats is growing through these stores. Furthermore, yoga mats are available in a wide variety of selections through specialty stores. As a result, the number of specialty stores has been steadily increasing over the past decade. The sales growth in the global market is highly dependent on these retail formats. As a result, retail establishments are using in-house shopping coaches and hosting proactive workshops to connect customers with shared interests or recommend the right products. Hence, these such factors will boost the market segment growth during the forecast period.
To get insights on the market contribution of various segments including country and region wise historic data (2017 to 2021), and forecast market size (2023 to 2027) – Download a sample Report
Yoga mat market – Market dynamics
Key drivers – Product premiumization owing to increasing innovation in yoga accessories is notably driving the market growth. Innovation is critical to the global market as it helps differentiate offerings and improves consumer performance. Several manufacturers have begun offering unique yoga accessories such as mats in various colors, patterns, and styles. Besides, they are offering yoga mats made of natural jute and rubber. For instance, Lululemon Athletica Inc. sells Reversible Mat. It is a natural mat that contains an antibacterial ingredient to keep mounds and mildew away. Benefits such as higher quality and longevity are prompting customers to pay more for premium products. For instance, Sequential Brands Group Inc. offers an 8mm-thick Performance Premium-Grip Yoga Mat under the GAIAM brand. This nonslip mat, made of natural rubber, features an internal stabilizing core, providing comfort and convenience to customers. Hence, the advent of innovative and premium products may boost vendors’ profit margins and help achieve a competitive advantage in the market. These factors will boost the market growth during the projection period.
Leading trends – The increasing availability of custom yoga mats is an emerging trend in the market. Customized yoga mats are increasingly gaining popularity in the global market. Factors such as yoga mat personalization and customization have emerged as key purchase-decision determinants. These variables are driven by factors such as technology, supply chain transformation, and organizational restructuring. Now, yoga mat manufacturers have the ability to produce and supply products based on customer measurements and specifications. For instance, ANYMATIC LLC offers personalized mats, namely customized standard yoga mats, travel yoga mats, and children’s yoga mats. Several market vendors are expected to offer customized yoga mats based on consumer preferences, which, in turn, is estimated to drive the global market growth during the forecast period.
Major challenges – The rising popularity of outdoor sports activities is posing a major challenge for market growth. People are increasingly embracing different sports and including them in their daily routine in line with the growing society’s tendency toward leading active, healthy lifestyles. For instance, the proportion of people who bicycled increased from 7% in 2021 to almost 8% in 2022. Similarly, between 2021 and 2022, triathlon participation escalated by about 13% worldwide. The increasing preference for regular outdoor physical activity can be attributed to many positive health effects, including reduced discomfort of arthritis, accelerated weight loss, lowered blood pressure, and decreased risk of diabetes, certain cancers, osteoporosis, and cardiovascular diseases. Additionally, sports and outdoor physical activity enable people to socialize and meet people with similar interests. As a result of these many benefits of outdoor exercise, there may be a decline in the number of people choosing yoga to enhance their health. Hence, these factors are expected to lower the demand for yoga mats and, in turn, negatively impact the global market during the forecast period.
For insights on market drivers, trends, and challenges, historic period (2017 to 2021), and forecast period (2023 to 2027)-Request a sample report!
What are the key data covered in this yoga mat market report?
- CAGR of the market during the forecast period
- Detailed information on factors that will drive the growth of the yoga mat market between 2023 and 2027
- Precise estimation of the size of the yoga mat market and its contribution to the parent market
- Accurate predictions about upcoming trends and changes in consumer behavior
- Growth of the yoga mat market across North America, Europe, APAC, South America, and Middle East and Africa
- Thorough analysis of the market’s competitive landscape and detailed information about vendors
- Comprehensive analysis of factors that will challenge the growth of yoga mat market vendors
Gain instant access to 17,000+ market research reports.
Technavio’s SUBSCRIPTION platform
Related reports:
The smart yoga mat market size is expected to increase by USD 164.18 million from 2021 to 2026, and the market’s growth momentum will accelerate at a CAGR of 6.43%. This report extensively covers segmentation by distribution channel (offline and online) and geography (North America, Europe, APAC, South America, and Middle East and Africa).
The yoga accessories market size is estimated to increase by USD 6,159.41 million from 2022 to 2027, and the market’s growth momentum will accelerate at a CAGR of 6.9%. This report extensively covers segmentation by product (yoga mats, yoga straps, yoga blocks, and others), distribution channel (offline and online), and geography (North America, Europe, APAC, South America, and the Middle East and Africa).
|
Yoga mat market scope |
|
|
Report Coverage |
Details |
|
Base year |
2022 |
|
Historic period |
2017-2021 |
|
Forecast period |
2023-2027 |
|
Growth momentum & CAGR |
Accelerate at a CAGR of 5.84% |
|
Market growth 2022-2027 |
USD 2,937.23 million |
|
Market structure |
Fragmented |
|
YoY growth 2022-2023 (%) |
4.67 |
|
Regional analysis |
North America, Europe, APAC, South America, and Middle East and Africa |
|
Performing market contribution |
North America at 33% |
|
Key countries |
US, China, India, UK, and Germany |
|
Competitive landscape |
Leading Vendors, Market Positioning of Vendors, Competitive Strategies, and Industry Risks |
|
Key companies profiled |
Adidas AG, Barefoot Yoga Co., Body Solid Inc., Decathlon SA, Hugger Mugger Yoga Products LLC Inc., JadeYoga, La Vie Boheme Yoga, Liforme Ltd., lululemon athletica Inc., Manduka LLC, Merrithew International Inc., New Balance Athletics Inc., Nike Inc., NoCoast Beer Co., OPTP, Second Earth Pty Ltd., Trimax Sports Inc., Yoga Direct LLC, Yogamatters Ltd., and YogiKuti Pvt. Ltd. |
|
Market dynamics |
Parent market analysis, Market growth inducers and obstacles, Fast-growing and slow-growing segment analysis, COVID-19 impact and recovery analysis and future consumer dynamics, Market condition analysis for forecast period. |
|
Customization purview |
If our report has not included the data that you are looking for, you can reach out to our analysts and get segments customized. |
Browse for Technavio Industrials market reports and unlock the potential of your business
Table of contents –
1 Executive Summary
- 1.1 Market overview
- Exhibit 01: Executive Summary – Chart on Market Overview
- Exhibit 02: Executive Summary – Data Table on Market Overview
- Exhibit 03: Executive Summary – Chart on Global Market Characteristics
- Exhibit 04: Executive Summary – Chart on Market by Geography
- Exhibit 05: Executive Summary – Chart on Market Segmentation by Distribution Channel
- Exhibit 06: Executive Summary – Chart on Market Segmentation by End-user
- Exhibit 07: Executive Summary – Chart on Incremental Growth
- Exhibit 08: Executive Summary – Data Table on Incremental Growth
- Exhibit 09: Executive Summary – Chart on Vendor Market Positioning
2 Market Landscape
- 2.1 Market ecosystem
- Exhibit 10: Parent market
- Exhibit 11: Market Characteristics
3 Market Sizing
- 3.1 Market definition
- Exhibit 12: Offerings of vendors included in the market definition
- 3.2 Market segment analysis
- Exhibit 13: Market segments
- 3.4 Market outlook: Forecast for 2022-2027
- Exhibit 14: Chart on Global – Market size and forecast 2022-2027 ($ million)
- Exhibit 15: Data Table on Global – Market size and forecast 2022-2027 ($ million)
- Exhibit 16: Chart on Global Market: Year-over-year growth 2022-2027 (%)
- Exhibit 17: Data Table on Global Market: Year-over-year growth 2022-2027 (%)
4 Historic Market Size
- 4.1 Global yoga mat market 2017 – 2021
- Exhibit 18: Historic Market Size – Data Table on Global yoga mat market 2017 – 2021 ($ million)
- 4.2 Distribution Channel Segment Analysis 2017 – 2021
- Exhibit 19: Historic Market Size – Distribution Channel Segment 2017 – 2021 ($ million)
- 4.3 End-user Segment Analysis 2017 – 2021
- Exhibit 20: Historic Market Size – End-user Segment 2017 – 2021 ($ million)
- 4.4 Geography Segment Analysis 2017 – 2021
- Exhibit 21: Historic Market Size – Geography Segment 2017 – 2021 ($ million)
- 4.5 Country Segment Analysis 2017 – 2021
- Exhibit 22: Historic Market Size – Country Segment 2017 – 2021 ($ million)
5 Five Forces Analysis
- 5.1 Five forces summary
- Exhibit 23: Five forces analysis – Comparison between 2022 and 2027
- 5.2 Bargaining power of buyers
- Exhibit 24: Chart on Bargaining power of buyers – Impact of key factors 2022 and 2027
- 5.3 Bargaining power of suppliers
- Exhibit 25: Bargaining power of suppliers – Impact of key factors in 2022 and 2027
- 5.4 Threat of new entrants
- Exhibit 26: Threat of new entrants – Impact of key factors in 2022 and 2027
- 5.5 Threat of substitutes
- Exhibit 27: Threat of substitutes – Impact of key factors in 2022 and 2027
- 5.6 Threat of rivalry
- Exhibit 28: Threat of rivalry – Impact of key factors in 2022 and 2027
- 5.7 Market condition
- Exhibit 29: Chart on Market condition – Five forces 2022 and 2027
6 Market Segmentation by Distribution Channel
- 6.1 Market segments
- Exhibit 30: Chart on Distribution Channel – Market share 2022-2027 (%)
- Exhibit 31: Data Table on Distribution Channel – Market share 2022-2027 (%)
- 6.2 Comparison by Distribution Channel
- Exhibit 32: Chart on Comparison by Distribution Channel
- Exhibit 33: Data Table on Comparison by Distribution Channel
- 6.3 Offline – Market size and forecast 2022-2027
- Exhibit 34: Chart on Offline – Market size and forecast 2022-2027 ($ million)
- Exhibit 35: Data Table on Offline – Market size and forecast 2022-2027 ($ million)
- Exhibit 36: Chart on Offline – Year-over-year growth 2022-2027 (%)
- Exhibit 37: Data Table on Offline – Year-over-year growth 2022-2027 (%)
- 6.4 Online – Market size and forecast 2022-2027
- Exhibit 38: Chart on Online – Market size and forecast 2022-2027 ($ million)
- Exhibit 39: Data Table on Online – Market size and forecast 2022-2027 ($ million)
- Exhibit 40: Chart on Online – Year-over-year growth 2022-2027 (%)
- Exhibit 41: Data Table on Online – Year-over-year growth 2022-2027 (%)
- 6.5 Market opportunity by Distribution Channel
- Exhibit 42: Market opportunity by Distribution Channel ($ million)
- Exhibit 43: Data Table on Market opportunity by Distribution Channel ($ million)
7 Market Segmentation by End-user
- 7.1 Market segments
- Exhibit 44: Chart on End-user – Market share 2022-2027 (%)
- Exhibit 45: Data Table on End-user – Market share 2022-2027 (%)
- 7.2 Comparison by End-user
- Exhibit 46: Chart on Comparison by End-user
- Exhibit 47: Data Table on Comparison by End-user
- 7.3 Personal – Market size and forecast 2022-2027
- Exhibit 48: Chart on Personal – Market size and forecast 2022-2027 ($ million)
- Exhibit 49: Data Table on Personal – Market size and forecast 2022-2027 ($ million)
- Exhibit 50: Chart on Personal – Year-over-year growth 2022-2027 (%)
- Exhibit 51: Data Table on Personal – Year-over-year growth 2022-2027 (%)
- 7.4 Health clubs – Market size and forecast 2022-2027
- Exhibit 52: Chart on Health clubs – Market size and forecast 2022-2027 ($ million)
- Exhibit 53: Data Table on Health clubs – Market size and forecast 2022-2027 ($ million)
- Exhibit 54: Chart on Health clubs – Year-over-year growth 2022-2027 (%)
- Exhibit 55: Data Table on Health clubs – Year-over-year growth 2022-2027 (%)
- 7.5 Market opportunity by End-user
- Exhibit 56: Market opportunity by End-user ($ million)
- Exhibit 57: Data Table on Market opportunity by End-user ($ million)
8 Customer Landscape
- 8.1 Customer landscape overview
- Exhibit 58: Analysis of price sensitivity, lifecycle, customer purchase basket, adoption rates, and purchase criteria
9 Geographic Landscape
- 9.1 Geographic segmentation
- Exhibit 59: Chart on Market share by geography 2022-2027 (%)
- Exhibit 60: Data Table on Market share by geography 2022-2027 (%)
- 9.2 Geographic comparison
- Exhibit 61: Chart on Geographic comparison
- Exhibit 62: Data Table on Geographic comparison
- 9.3 North America – Market size and forecast 2022-2027
- Exhibit 63: Chart on North America – Market size and forecast 2022-2027 ($ million)
- Exhibit 64: Data Table on North America – Market size and forecast 2022-2027 ($ million)
- Exhibit 65: Chart on North America – Year-over-year growth 2022-2027 (%)
- Exhibit 66: Data Table on North America – Year-over-year growth 2022-2027 (%)
- 9.4 Europe – Market size and forecast 2022-2027
- Exhibit 67: Chart on Europe – Market size and forecast 2022-2027 ($ million)
- Exhibit 68: Data Table on Europe – Market size and forecast 2022-2027 ($ million)
- Exhibit 69: Chart on Europe – Year-over-year growth 2022-2027 (%)
- Exhibit 70: Data Table on Europe – Year-over-year growth 2022-2027 (%)
- 9.5 APAC – Market size and forecast 2022-2027
- Exhibit 71: Chart on APAC – Market size and forecast 2022-2027 ($ million)
- Exhibit 72: Data Table on APAC – Market size and forecast 2022-2027 ($ million)
- Exhibit 73: Chart on APAC – Year-over-year growth 2022-2027 (%)
- Exhibit 74: Data Table on APAC – Year-over-year growth 2022-2027 (%)
- 9.6 South America – Market size and forecast 2022-2027
- Exhibit 75: Chart on South America – Market size and forecast 2022-2027 ($ million)
- Exhibit 76: Data Table on South America – Market size and forecast 2022-2027 ($ million)
- Exhibit 77: Chart on South America – Year-over-year growth 2022-2027 (%)
- Exhibit 78: Data Table on South America – Year-over-year growth 2022-2027 (%)
- 9.7 Middle East and Africa – Market size and forecast 2022-2027
- Exhibit 79: Chart on Middle East and Africa – Market size and forecast 2022-2027 ($ million)
- Exhibit 80: Data Table on Middle East and Africa – Market size and forecast 2022-2027 ($ million)
- Exhibit 81: Chart on Middle East and Africa – Year-over-year growth 2022-2027 (%)
- Exhibit 82: Data Table on Middle East and Africa – Year-over-year growth 2022-2027 (%)
- 9.8 US – Market size and forecast 2022-2027
- Exhibit 83: Chart on US – Market size and forecast 2022-2027 ($ million)
- Exhibit 84: Data Table on US – Market size and forecast 2022-2027 ($ million)
- Exhibit 85: Chart on US – Year-over-year growth 2022-2027 (%)
- Exhibit 86: Data Table on US – Year-over-year growth 2022-2027 (%)
- 9.9 China – Market size and forecast 2022-2027
- Exhibit 87: Chart on China – Market size and forecast 2022-2027 ($ million)
- Exhibit 88: Data Table on China – Market size and forecast 2022-2027 ($ million)
- Exhibit 89: Chart on China – Year-over-year growth 2022-2027 (%)
- Exhibit 90: Data Table on China – Year-over-year growth 2022-2027 (%)
- 9.10 UK – Market size and forecast 2022-2027
- Exhibit 91: Chart on UK – Market size and forecast 2022-2027 ($ million)
- Exhibit 92: Data Table on UK – Market size and forecast 2022-2027 ($ million)
- Exhibit 93: Chart on UK – Year-over-year growth 2022-2027 (%)
- Exhibit 94: Data Table on UK – Year-over-year growth 2022-2027 (%)
- 9.11 Germany – Market size and forecast 2022-2027
- Exhibit 95: Chart on Germany – Market size and forecast 2022-2027 ($ million)
- Exhibit 96: Data Table on Germany – Market size and forecast 2022-2027 ($ million)
- Exhibit 97: Chart on Germany – Year-over-year growth 2022-2027 (%)
- Exhibit 98: Data Table on Germany – Year-over-year growth 2022-2027 (%)
- 9.12 India – Market size and forecast 2022-2027
- Exhibit 99: Chart on India – Market size and forecast 2022-2027 ($ million)
- Exhibit 100: Data Table on India – Market size and forecast 2022-2027 ($ million)
- Exhibit 101: Chart on India – Year-over-year growth 2022-2027 (%)
- Exhibit 102: Data Table on India – Year-over-year growth 2022-2027 (%)
- 9.13 Market opportunity by geography
- Exhibit 103: Market opportunity by geography ($ million)
- Exhibit 104: Data Tables on Market opportunity by geography ($ million)
10 Drivers, Challenges, and Trends
- 10.3 Impact of drivers and challenges
- Exhibit 105: Impact of drivers and challenges in 2022 and 2027
11 Vendor Landscape
- 11.2 Vendor landscape
- Exhibit 106: Overview on Criticality of inputs and Factors of differentiation
- 11.3 Landscape disruption
- Exhibit 107: Overview on factors of disruption
- 11.4 Industry risks
- Exhibit 108: Impact of key risks on business
12 Vendor Analysis
- 12.1 Vendors covered
- Exhibit 109: Vendors covered
- 12.2 Market positioning of vendors
- Exhibit 110: Matrix on vendor position and classification
- 12.3 Adidas AG
- Exhibit 111: Adidas AG – Overview
- Exhibit 112: Adidas AG – Business segments
- Exhibit 113: Adidas AG – Key news
- Exhibit 114: Adidas AG – Key offerings
- Exhibit 115: Adidas AG – Segment focus
- 12.4 Barefoot Yoga Co.
- Exhibit 116: Barefoot Yoga Co. – Overview
- Exhibit 117: Barefoot Yoga Co. – Product / Service
- Exhibit 118: Barefoot Yoga Co. – Key offerings
- 12.5 Body Solid Inc.
- Exhibit 119: Body Solid Inc. – Overview
- Exhibit 120: Body Solid Inc. – Product / Service
- Exhibit 121: Body Solid Inc. – Key offerings
- 12.6 Hugger Mugger Yoga Products LLC Inc.
- Exhibit 122: Hugger Mugger Yoga Products LLC Inc. – Overview
- Exhibit 123: Hugger Mugger Yoga Products LLC Inc. – Product / Service
- Exhibit 124: Hugger Mugger Yoga Products LLC Inc. – Key offerings
- 12.7 JadeYoga
- Exhibit 125: JadeYoga – Overview
- Exhibit 126: JadeYoga – Product / Service
- Exhibit 127: JadeYoga – Key offerings
- 12.8 La Vie Boheme Yoga
- Exhibit 128: La Vie Boheme Yoga – Overview
- Exhibit 129: La Vie Boheme Yoga – Product / Service
- Exhibit 130: La Vie Boheme Yoga – Key offerings
- 12.9 Liforme Ltd.
- Exhibit 131: Liforme Ltd. – Overview
- Exhibit 132: Liforme Ltd. – Product / Service
- Exhibit 133: Liforme Ltd. – Key offerings
- 12.10 lululemon athletica Inc.
- Exhibit 134: lululemon athletica Inc. – Overview
- Exhibit 135: lululemon athletica Inc. – Business segments
- Exhibit 136: lululemon athletica Inc. – Key offerings
- Exhibit 137: lululemon athletica Inc. – Segment focus
- 12.11 Manduka LLC
- Exhibit 138: Manduka LLC – Overview
- Exhibit 139: Manduka LLC – Product / Service
- Exhibit 140: Manduka LLC – Key offerings
- 12.12 Merrithew International Inc.
- Exhibit 141: Merrithew International Inc. – Overview
- Exhibit 142: Merrithew International Inc. – Product / Service
- Exhibit 143: Merrithew International Inc. – Key offerings
- 12.13 New Balance Athletics Inc.
- Exhibit 144: New Balance Athletics Inc. – Overview
- Exhibit 145: New Balance Athletics Inc. – Product / Service
- Exhibit 146: New Balance Athletics Inc. – Key offerings
- 12.14 Nike Inc.
- Exhibit 147: Nike Inc. – Overview
- Exhibit 148: Nike Inc. – Business segments
- Exhibit 149: Nike Inc. – Key news
- Exhibit 150: Nike Inc. – Key offerings
- Exhibit 151: Nike Inc. – Segment focus
- 12.15 OPTP
- Exhibit 152: OPTP – Overview
- Exhibit 153: OPTP – Product / Service
- Exhibit 154: OPTP – Key offerings
- 12.16 Second Earth Pty Ltd.
- Exhibit 155: Second Earth Pty Ltd. – Overview
- Exhibit 156: Second Earth Pty Ltd. – Product / Service
- Exhibit 157: Second Earth Pty Ltd. – Key offerings
- 12.17 Yoga Direct LLC
- Exhibit 158: Yoga Direct LLC – Overview
- Exhibit 159: Yoga Direct LLC – Product / Service
- Exhibit 160: Yoga Direct LLC – Key offerings
13 Appendix
- 13.2 Inclusions and exclusions checklist
- Exhibit 161: Inclusions checklist
- Exhibit 162: Exclusions checklist
- 13.3 Currency conversion rates for US$
- Exhibit 163: Currency conversion rates for US$
- 13.4 Research methodology
- Exhibit 164: Research methodology
- Exhibit 165: Validation techniques employed for market sizing
- Exhibit 166: Information sources
- 13.5 List of abbreviations
- Exhibit 167: List of abbreviations
About Us
Technavio is a leading global technology research and advisory company. Their research and analysis focuses on emerging market trends and provides actionable insights to help businesses identify market opportunities and develop effective strategies to optimize their market positions. With over 500 specialized analysts, Technavio’s report library consists of more than 17,000 reports and counting, covering 800 technologies, spanning across 50 countries. Their client base consists of enterprises of all sizes, including more than 100 Fortune 500 companies. This growing client base relies on Technavio’s comprehensive coverage, extensive research, and actionable market insights to identify opportunities in existing and potential markets and assess their competitive positions within changing market scenarios.
Contact
Technavio Research
Jesse Maida
Media & Marketing Executive
US: +1 844 364 1100
UK: +44 203 893 3200
Email: [email protected]
Website: www.technavio.com
SOURCE Technavio
