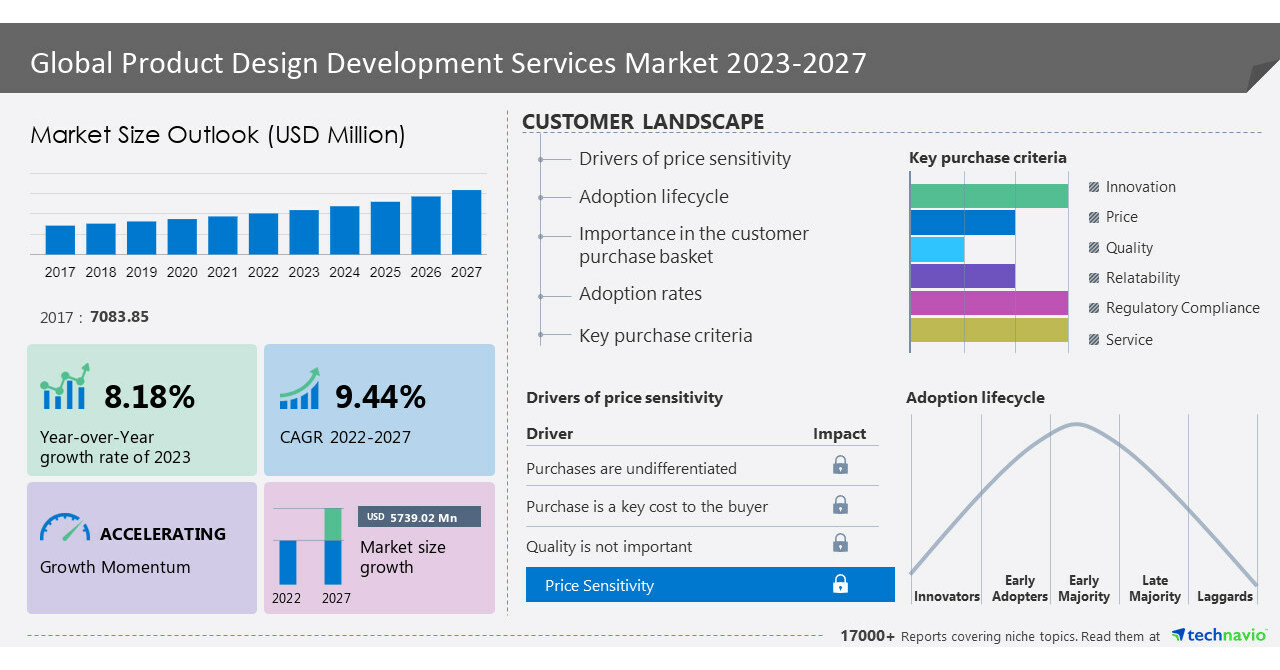
NEW YORK, June 6, 2023 /PRNewswire/ — The market size of product design and development services is estimated to grow at a CAGR of 9.44% during 2022-2027. The market size is expected to grow to USD 5,739.02 million. Market growth is dependent on several factors such as advancements in healthcare technology, increasing prevalence of disease, and increasing demand for medical devices. Advances in technology extensively drive the demand for product design and development services. Wearable devices such as fitness trackers and smartwatches are becoming popular. Such devices can track health metrics, including heart rate, sleep patterns, and physical activity, helping users to monitor and manage their vitals and routines. Therefore, the demand for product design and development services is on the rise. Discover some insights on market size historic period (2017 to 2021) and Forecast (2023 to 2027) before buying the full report – Request a sample report
Product design development services market – Vendor Analysis
Vendor Landscape – The global product design development services market is fragmented, with the presence of several global as well as regional vendors. A few prominent vendors that offer product design development services in the market are Aran Biomedical, Biomerics LLC, Cambridge Design Partnership Ltd., Celestica Inc., Delve, DeviceLab Inc., Flex Ltd., Freudenberg SE, IndiaCADworks, Integrated Computer Solutions Inc., Jabil Inc., KKR BOSE DESIGN SERVICES Pvt. Ltd., Nordson Corp., Nuova Donatella, Planet Innovation Holdings, Plexus Corp., StarFish Product Engineering Inc., Steripack Group Ltd., Veranex, and RA Global Tech Solutions LLP and others.
The global product design development services market is at its growing stage. Vendors are implementing various strategies, such as strategic alliances, partnerships, mergers and acquisitions, geographical expansion, and product/service launches, to enhance their presence in the market.
What’s New? –
- Special coverage on the Russia–Ukraine war; global inflation; recovery analysis from COVID-19; supply chain disruptions, global trade tensions; and risk of recession
- Global competitiveness and key competitor positions
- Market presence across multiple geographical footprints – Strong/Active/Niche/Trivial – Buy the report!
Vendor Offerings –
- Aran Biomedical: The company offers product design development services such as design risk analysis.
- Biomerics LLC: The company offers product design development services such as clinical validation.
- Cambridge Design Partnership Ltd.: The company offers product design development services such as safety critical high integrity systems development.
- For details on the vendor and its offerings – Request a sample report
Product design development services market – Segmentation Assessment
Segment Overview
Technavio has segmented the market based on Application (Surgical instruments, Diagnostic equipment, Therapeutic equipment, Clinical laboratory equipment, and Others), End-user (Medical device companies, Pharmaceutical companies, Biotechnology companies, and Contract research organizations), and Geography (Asia, North America, Europe, and Rest of World (ROW)).
- The market share of the surgical instruments segment is expected to grow significantly during the forecast period. The surgical instruments segment dominated the market with the highest market share in 2022. The main purpose of surgical instruments is to ensure patient safety during surgical procedures. Good product design ensures instrument safety and efficacy, reducing the risk of injury and complications during surgery. Surgical instruments must be designed to reduce physical strain on the surgeon during lengthy operations.
Geography Overview
By geography, the global product design development services market is segmented into Asia, North America, Europe, and Rest of World (ROW). The report provides actionable insights and estimates the contribution of all regions to the growth of the global product design development services market.
- Asia is estimated to contribute 46% to the growth of the global market during the forecast period. Countries such as China and India has significant growth in various industries such as manufacturing, healthcare, and technology. The APAC product design and development services market is driven by growing demand for innovative, high-quality products and the need to reduce costs and improve efficiency. Market growth will also lead to the emergence of specialized design and development firms focusing on specific industries such as medical devices, which is expected to drive the growth of the global product design and development services market during the forecast period.
For insights on global, regional, and country-level parameters with growth opportunities from 2017 to 2027 – Download a Sample Report
Global Product Design Development Services Market – Market Dynamics
Leading Drivers – Advancements in healthcare technology is driving the market: Advances in technology greatly drive the demand for product design and development services. Wearable devices such as fitness trackers and smartwatches are growing in popularity. These devices can track health metrics such as heart rate, sleep patterns, and physical activity, helping users to monitor and manage their health. Demand for product design and development services is increasing as companies strive to develop new and innovative wearable devices that can provide even more advanced health monitoring capabilities.
Telemedicine involves using technology to provide telemedicine and has become increasingly popular in recent years. Telemedicine platforms allow patients to connect with their healthcare providers from home, which is especially beneficial for those with mobility or transportation issues. Demand for product design and development services is increasing as companies look to develop new telemedicine platforms that offer more advanced capabilities.
Artificial intelligence (AI) has the potential to revolutionize healthcare by analyzing big data and providing insights into patient care. AI-powered tools can help healthcare providers make more informed decisions about diagnosis and treatment, and enable patients to better manage their health. Demand for product design and development services is increasing as companies look to develop new AI-powered healthcare products that can improve patient outcomes.
Key Trends – Digitalization of healthcare industry is trending in this industry: Digitization has revolutionized the healthcare industry, changing the way healthcare services are delivered and consumed. With the increasing adoption of digital technologies such as telemedicine, wearables, and IoT devices, the demand for healthcare product design and development services is increasing.
The increasing use of connected, wearable, and IoT devices has created a need for product design and development services to create innovative devices that collect and transmit real-time health data. These devices help healthcare providers remotely monitor patients and make informed treatment decisions. The rise of digital healthcare platforms has created a need for product design and development services to create user-friendly and intuitive platforms that can improve patient engagement and adherence to treatment plans.
Major Challenges – Stringent regulations on medical device manufacturing is a major challenge impeding the growth of product design development services market: Healthcare products must comply with various regulations to ensure patient safety, which can be complex and time-consuming. The market players must comply with regulations such as FDA, HIPAA, and GDPR to ensure that the products meet the required standards. The global regulatory environment for medical devices is becoming increasingly stringent and unpredictable for manufacturers. The FDA and other US regulatory agencies require medical device manufacturers to conduct extensive compliance oversight.
Manufacturers are also subject to regular inspections for compliance with applicable quality system regulations governing the development, manufacture and maintenance of finished medical devices for human use. Therefore, stringent regulations on the design and manufacturing of medical devices may adversely affect the growth of the global product design development services market during the forecast period.
Drivers, trends, and challenges have an impact on market dynamics, which can impact businesses. Find more insights in a free sample report!
What are the key data covered in this Product Design Development Services Market report?
- CAGR of the market during the forecast period
- Detailed information on factors that will drive the growth of the Product Design Development Services Market between 2023 and 2027
- Precise estimation of the size of the Product Design Development Services Market size and its contribution to the market in focus on the parent market
- Accurate predictions about upcoming trends and changes in consumer behavior
- Growth of the Product Design Development Services Market industry across Asia, North America, Europe, and Rest of World (ROW)
- A thorough analysis of the market’s competitive landscape and detailed information about vendors
- Comprehensive analysis of factors that will challenge the growth of Product Design Development Services Market vendors
Gain instant access to 17,000+ market research reports.
Technavio’s SUBSCRIPTION platform
Related Reports:
The rapid application development (RAD) market is estimated to grow at a CAGR of 39.7% between 2022 and 2027. The size of the market is forecast to increase by USD 129.02 billion. This report extensively covers market segmentation by capacity (large enterprises and small and medium enterprises), deployment (on-premise and cloud-based), and geography (North America, Europe, APAC, South America, and Middle East and Africa). The increasing adoption of cloud-based services is notably driving the market growth, although factors such as the complexity involved in application development, planning, and estimation may impede the market growth.
The multiexperience development platforms (MXDP) market size is estimated to grow at a CAGR of 21.9% between 2022 and 2027. The market size is forecast to increase by USD 4,670.38 million. This multiexperience development platforms (MXDP) market report extensively covers market segmentation by end-user (IT and telecom, manufacturing, healthcare, BFSI, and others), deployment (cloud-based and on-premise), and geography (North America, Europe, APAC, Middle East and Africa, and South America). The growing penetration of cloud computing is notably driving the market growth, although factors such as data privacy and security concerns may impede the market growth.
|
Product Design Development Services Market Scope |
|
|
Report Coverage |
Details |
|
Historic period |
2017-2021 |
|
Forecast period |
2023-2027 |
|
Growth momentum & CAGR |
Accelerate at a CAGR of 9.44% |
|
Market growth 2023-2027 |
USD 5,739.02 million |
|
Market structure |
Fragmented |
|
YoY growth 2022-2023 (%) |
8.18 |
|
Regional analysis |
Asia, North America, Europe, and Rest of World (ROW) |
|
Performing market contribution |
Asia at 46% |
|
Key countries |
US, Canada, Germany, China, and Japan, Canada, Mexico, Italy,Spain, India, Japan, Australia, and South Korea |
|
Competitive landscape |
Leading Vendors, Market Positioning of Vendors, Competitive Strategies, and Industry Risks |
|
Key companies profiled |
Aran Biomedical, Biomerics LLC, Cambridge Design Partnership Ltd., Celestica Inc., Delve, DeviceLab Inc., Flex Ltd., Freudenberg SE, IndiaCADworks, Integrated Computer Solutions Inc., Jabil Inc., KKR BOSE DESIGN SERVICES Pvt. Ltd., Nordson Corp., Nuova Donatella, Planet Innovation Holdings, Plexus Corp., StarFish Product Engineering Inc., Steripack Group Ltd., Veranex, and RA Global Tech Solutions LLP |
|
Market dynamics |
Parent market analysis, Market growth inducers and obstacles, Fast-growing and slow-growing segment analysis, COVID-19 impact and recovery analysis and future consumer dynamics, Market condition analysis for forecast period. |
|
Customization purview |
If our report has not included the data that you are looking for, you can reach out to our analysts and get segments customized. |
Table of Contents
1 Executive Summary
- 1.1 Market overview
- Exhibit 01: Executive Summary – Chart on Market Overview
- Exhibit 02: Executive Summary – Data Table on Market Overview
- Exhibit 03: Executive Summary – Chart on Global Market Characteristics
- Exhibit 04: Executive Summary – Chart on Market by Geography
- Exhibit 05: Executive Summary – Chart on Market Segmentation by Application
- Exhibit 06: Executive Summary – Chart on Market Segmentation by End-user
- Exhibit 07: Executive Summary – Chart on Incremental Growth
- Exhibit 08: Executive Summary – Data Table on Incremental Growth
- Exhibit 09: Executive Summary – Chart on Vendor Market Positioning
2 Market Landscape
- 2.1 Market ecosystem
- Exhibit 10: Parent market
- Exhibit 11: Market Characteristics
3 Market Sizing
- 3.1 Market definition
- Exhibit 12: Offerings of vendors included in the market definition
- 3.2 Market segment analysis
- Exhibit 13: Market segments
- 3.4 Market outlook: Forecast for 2022-2027
- Exhibit 14: Chart on Global – Market size and forecast 2022-2027 ($ million)
- Exhibit 15: Data Table on Global – Market size and forecast 2022-2027 ($ million)
- Exhibit 16: Chart on Global Market: Year-over-year growth 2022-2027 (%)
- Exhibit 17: Data Table on Global Market: Year-over-year growth 2022-2027 (%)
4 Historic Market Size
- 4.1 Global product design development services market 2017 – 2021
- Exhibit 18: Historic Market Size – Data Table on global product design development services market 2017 – 2021 ($ million)
- 4.2 Application Segment Analysis 2017 – 2021
- Exhibit 19: Historic Market Size – Application Segment 2017 – 2021 ($ million)
- 4.3 End-user Segment Analysis 2017 – 2021
- Exhibit 20: Historic Market Size – End-user Segment 2017 – 2021 ($ million)
- 4.4 Geography Segment Analysis 2017 – 2021
- Exhibit 21: Historic Market Size – Geography Segment 2017 – 2021 ($ million)
- 4.5 Country Segment Analysis 2017 – 2021
- Exhibit 22: Historic Market Size – Country Segment 2017 – 2021 ($ million)
5 Five Forces Analysis
- 5.1 Five forces summary
- Exhibit 23: Five forces analysis – Comparison between 2022 and 2027
- 5.2 Bargaining power of buyers
- Exhibit 24: Chart on Bargaining power of buyers – Impact of key factors 2022 and 2027
- 5.3 Bargaining power of suppliers
- Exhibit 25: Bargaining power of suppliers – Impact of key factors in 2022 and 2027
- 5.4 Threat of new entrants
- Exhibit 26: Threat of new entrants – Impact of key factors in 2022 and 2027
- 5.5 Threat of substitutes
- Exhibit 27: Threat of substitutes – Impact of key factors in 2022 and 2027
- 5.6 Threat of rivalry
- Exhibit 28: Threat of rivalry – Impact of key factors in 2022 and 2027
- 5.7 Market condition
- Exhibit 29: Chart on Market condition – Five forces 2022 and 2027
6 Market Segmentation by Application
- 6.1 Market segments
- Exhibit 30: Chart on Application – Market share 2022-2027 (%)
- Exhibit 31: Data Table on Application – Market share 2022-2027 (%)
- 6.2 Comparison by Application
- Exhibit 32: Chart on Comparison by Application
- Exhibit 33: Data Table on Comparison by Application
- 6.3 Surgical instruments – Market size and forecast 2022-2027
- Exhibit 34: Chart on Surgical instruments – Market size and forecast 2022-2027 ($ million)
- Exhibit 35: Data Table on Surgical instruments – Market size and forecast 2022-2027 ($ million)
- Exhibit 36: Chart on Surgical instruments – Year-over-year growth 2022-2027 (%)
- Exhibit 37: Data Table on Surgical instruments – Year-over-year growth 2022-2027 (%)
- 6.4 Diagnostic equipment – Market size and forecast 2022-2027
- Exhibit 38: Chart on Diagnostic equipment – Market size and forecast 2022-2027 ($ million)
- Exhibit 39: Data Table on Diagnostic equipment – Market size and forecast 2022-2027 ($ million)
- Exhibit 40: Chart on Diagnostic equipment – Year-over-year growth 2022-2027 (%)
- Exhibit 41: Data Table on Diagnostic equipment – Year-over-year growth 2022-2027 (%)
- 6.5 Therapeutic equipment – Market size and forecast 2022-2027
- Exhibit 42: Chart on Therapeutic equipment – Market size and forecast 2022-2027 ($ million)
- Exhibit 43: Data Table on Therapeutic equipment – Market size and forecast 2022-2027 ($ million)
- Exhibit 44: Chart on Therapeutic equipment – Year-over-year growth 2022-2027 (%)
- Exhibit 45: Data Table on Therapeutic equipment – Year-over-year growth 2022-2027 (%)
- 6.6 Clinical laboratory equipment – Market size and forecast 2022-2027
- Exhibit 46: Chart on Clinical laboratory equipment – Market size and forecast 2022-2027 ($ million)
- Exhibit 47: Data Table on Clinical laboratory equipment – Market size and forecast 2022-2027 ($ million)
- Exhibit 48: Chart on Clinical laboratory equipment – Year-over-year growth 2022-2027 (%)
- Exhibit 49: Data Table on Clinical laboratory equipment – Year-over-year growth 2022-2027 (%)
- 6.7 Others – Market size and forecast 2022-2027
- Exhibit 50: Chart on Others – Market size and forecast 2022-2027 ($ million)
- Exhibit 51: Data Table on Others – Market size and forecast 2022-2027 ($ million)
- Exhibit 52: Chart on Others – Year-over-year growth 2022-2027 (%)
- Exhibit 53: Data Table on Others – Year-over-year growth 2022-2027 (%)
- 6.8 Market opportunity by Application
- Exhibit 54: Market opportunity by Application ($ million)
- Exhibit 55: Data Table on Market opportunity by Application ($ million)
7 Market Segmentation by End-user
- 7.1 Market segments
- Exhibit 56: Chart on End-user – Market share 2022-2027 (%)
- Exhibit 57: Data Table on End-user – Market share 2022-2027 (%)
- 7.2 Comparison by End-user
- Exhibit 58: Chart on Comparison by End-user
- Exhibit 59: Data Table on Comparison by End-user
- 7.3 Medical device companies – Market size and forecast 2022-2027
- Exhibit 60: Chart on Medical device companies – Market size and forecast 2022-2027 ($ million)
- Exhibit 61: Data Table on Medical device companies – Market size and forecast 2022-2027 ($ million)
- Exhibit 62: Chart on Medical device companies – Year-over-year growth 2022-2027 (%)
- Exhibit 63: Data Table on Medical device companies – Year-over-year growth 2022-2027 (%)
- 7.4 Pharmaceutical companies – Market size and forecast 2022-2027
- Exhibit 64: Chart on Pharmaceutical companies – Market size and forecast 2022-2027 ($ million)
- Exhibit 65: Data Table on Pharmaceutical companies – Market size and forecast 2022-2027 ($ million)
- Exhibit 66: Chart on Pharmaceutical companies – Year-over-year growth 2022-2027 (%)
- Exhibit 67: Data Table on Pharmaceutical companies – Year-over-year growth 2022-2027 (%)
- 7.5 Biotechnology companies – Market size and forecast 2022-2027
- Exhibit 68: Chart on Biotechnology companies – Market size and forecast 2022-2027 ($ million)
- Exhibit 69: Data Table on Biotechnology companies – Market size and forecast 2022-2027 ($ million)
- Exhibit 70: Chart on Biotechnology companies – Year-over-year growth 2022-2027 (%)
- Exhibit 71: Data Table on Biotechnology companies – Year-over-year growth 2022-2027 (%)
- 7.6 Contract research organizations – Market size and forecast 2022-2027
- Exhibit 72: Chart on Contract research organizations – Market size and forecast 2022-2027 ($ million)
- Exhibit 73: Data Table on Contract research organizations – Market size and forecast 2022-2027 ($ million)
- Exhibit 74: Chart on Contract research organizations – Year-over-year growth 2022-2027 (%)
- Exhibit 75: Data Table on Contract research organizations – Year-over-year growth 2022-2027 (%)
- 7.7 Market opportunity by End-user
- Exhibit 76: Market opportunity by End-user ($ million)
- Exhibit 77: Data Table on Market opportunity by End-user ($ million)
8 Customer Landscape
- 8.1 Customer landscape overview
- Exhibit 78: Analysis of price sensitivity, lifecycle, customer purchase basket, adoption rates, and purchase criteria
9 Geographic Landscape
- 9.1 Geographic segmentation
- Exhibit 79: Chart on Market share by geography 2022-2027 (%)
- Exhibit 80: Data Table on Market share by geography 2022-2027 (%)
- 9.2 Geographic comparison
- Exhibit 81: Chart on Geographic comparison
- Exhibit 82: Data Table on Geographic comparison
- 9.3 Asia – Market size and forecast 2022-2027
- Exhibit 83: Chart on Asia – Market size and forecast 2022-2027 ($ million)
- Exhibit 84: Data Table on Asia – Market size and forecast 2022-2027 ($ million)
- Exhibit 85: Chart on Asia – Year-over-year growth 2022-2027 (%)
- Exhibit 86: Data Table on Asia – Year-over-year growth 2022-2027 (%)
- 9.4 North America – Market size and forecast 2022-2027
- Exhibit 87: Chart on North America – Market size and forecast 2022-2027 ($ million)
- Exhibit 88: Data Table on North America – Market size and forecast 2022-2027 ($ million)
- Exhibit 89: Chart on North America – Year-over-year growth 2022-2027 (%)
- Exhibit 90: Data Table on North America – Year-over-year growth 2022-2027 (%)
- 9.5 Europe – Market size and forecast 2022-2027
- Exhibit 91: Chart on Europe – Market size and forecast 2022-2027 ($ million)
- Exhibit 92: Data Table on Europe – Market size and forecast 2022-2027 ($ million)
- Exhibit 93: Chart on Europe – Year-over-year growth 2022-2027 (%)
- Exhibit 94: Data Table on Europe – Year-over-year growth 2022-2027 (%)
- 9.6 Rest of World (ROW) – Market size and forecast 2022-2027
- Exhibit 95: Chart on Rest of World (ROW) – Market size and forecast 2022-2027 ($ million)
- Exhibit 96: Data Table on Rest of World (ROW) – Market size and forecast 2022-2027 ($ million)
- Exhibit 97: Chart on Rest of World (ROW) – Year-over-year growth 2022-2027 (%)
- Exhibit 98: Data Table on Rest of World (ROW) – Year-over-year growth 2022-2027 (%)
- 9.7 US – Market size and forecast 2022-2027
- Exhibit 99: Chart on US – Market size and forecast 2022-2027 ($ million)
- Exhibit 100: Data Table on US – Market size and forecast 2022-2027 ($ million)
- Exhibit 101: Chart on US – Year-over-year growth 2022-2027 (%)
- Exhibit 102: Data Table on US – Year-over-year growth 2022-2027 (%)
- 9.8 Germany – Market size and forecast 2022-2027
- Exhibit 103: Chart on Germany – Market size and forecast 2022-2027 ($ million)
- Exhibit 104: Data Table on Germany – Market size and forecast 2022-2027 ($ million)
- Exhibit 105: Chart on Germany – Year-over-year growth 2022-2027 (%)
- Exhibit 106: Data Table on Germany – Year-over-year growth 2022-2027 (%)
- 9.9 China – Market size and forecast 2022-2027
- Exhibit 107: Chart on China – Market size and forecast 2022-2027 ($ million)
- Exhibit 108: Data Table on China – Market size and forecast 2022-2027 ($ million)
- Exhibit 109: Chart on China – Year-over-year growth 2022-2027 (%)
- Exhibit 110: Data Table on China – Year-over-year growth 2022-2027 (%)
- 9.10 Japan – Market size and forecast 2022-2027
- Exhibit 111: Chart on Japan – Market size and forecast 2022-2027 ($ million)
- Exhibit 112: Data Table on Japan – Market size and forecast 2022-2027 ($ million)
- Exhibit 113: Chart on Japan – Year-over-year growth 2022-2027 (%)
- Exhibit 114: Data Table on Japan – Year-over-year growth 2022-2027 (%)
- 9.11 Canada – Market size and forecast 2022-2027
- Exhibit 115: Chart on Canada – Market size and forecast 2022-2027 ($ million)
- Exhibit 116: Data Table on Canada – Market size and forecast 2022-2027 ($ million)
- Exhibit 117: Chart on Canada – Year-over-year growth 2022-2027 (%)
- Exhibit 118: Data Table on Canada – Year-over-year growth 2022-2027 (%)
- 9.12 Market opportunity by geography
- Exhibit 119: Market opportunity by geography ($ million)
- Exhibit 120: Data Tables on Market opportunity by geography ($ million)
10 Drivers, Challenges, and Trends
- 10.3 Impact of drivers and challenges
- Exhibit 121: Impact of drivers and challenges in 2022 and 2027
11 Vendor Landscape
- 11.2 Vendor landscape
- Exhibit 122: Overview on Criticality of inputs and Factors of differentiation
- 11.3 Landscape disruption
- Exhibit 123: Overview on factors of disruption
- 11.4 Industry risks
- Exhibit 124: Impact of key risks on business
12 Vendor Analysis
- 12.1 Vendors covered
- Exhibit 125: Vendors covered
- 12.2 Market positioning of vendors
- Exhibit 126: Matrix on vendor position and classification
- 12.3 Aran Biomedical
- Exhibit 127: Aran Biomedical – Overview
- Exhibit 128: Aran Biomedical – Product / Service
- Exhibit 129: Aran Biomedical – Key offerings
- 12.4 Biomerics LLC
- Exhibit 130: Biomerics LLC – Overview
- Exhibit 131: Biomerics LLC – Product / Service
- Exhibit 132: Biomerics LLC – Key offerings
- 12.5 Cambridge Design Partnership Ltd.
- Exhibit 133: Cambridge Design Partnership Ltd. – Overview
- Exhibit 134: Cambridge Design Partnership Ltd. – Product / Service
- Exhibit 135: Cambridge Design Partnership Ltd. – Key offerings
- 12.6 Celestica Inc.
- Exhibit 136: Celestica Inc. – Overview
- Exhibit 137: Celestica Inc. – Business segments
- Exhibit 138: Celestica Inc. – Key offerings
- Exhibit 139: Celestica Inc. – Segment focus
- 12.7 DeviceLab Inc.
- Exhibit 140: DeviceLab Inc. – Overview
- Exhibit 141: DeviceLab Inc. – Product / Service
- Exhibit 142: DeviceLab Inc. – Key offerings
- 12.8 Flex Ltd.
- Exhibit 143: Flex Ltd. – Overview
- Exhibit 144: Flex Ltd. – Business segments
- Exhibit 145: Flex Ltd. – Key news
- Exhibit 146: Flex Ltd. – Key offerings
- Exhibit 147: Flex Ltd. – Segment focus
- 12.9 Freudenberg SE
- Exhibit 148: Freudenberg SE – Overview
- Exhibit 149: Freudenberg SE – Business segments
- Exhibit 150: Freudenberg SE – Key news
- Exhibit 151: Freudenberg SE – Key offerings
- Exhibit 152: Freudenberg SE – Segment focus
- 12.10 Integrated Computer Solutions Inc.
- Exhibit 153: Integrated Computer Solutions Inc. – Overview
- Exhibit 154: Integrated Computer Solutions Inc. – Product / Service
- Exhibit 155: Integrated Computer Solutions Inc. – Key offerings
- 12.11 Jabil Inc.
- Exhibit 156: Jabil Inc. – Overview
- Exhibit 157: Jabil Inc. – Business segments
- Exhibit 158: Jabil Inc. – Key offerings
- Exhibit 159: Jabil Inc. – Segment focus
- 12.12 Nordson Corp.
- Exhibit 160: Nordson Corp. – Overview
- Exhibit 161: Nordson Corp. – Business segments
- Exhibit 162: Nordson Corp. – Key news
- Exhibit 163: Nordson Corp. – Key offerings
- Exhibit 164: Nordson Corp. – Segment focus
- 12.13 Nuova Donatella
- Exhibit 165: Nuova Donatella – Overview
- Exhibit 166: Nuova Donatella – Product / Service
- Exhibit 167: Nuova Donatella – Key offerings
- 12.14 Planet Innovation Holdings
- Exhibit 168: Planet Innovation Holdings – Overview
- Exhibit 169: Planet Innovation Holdings – Product / Service
- Exhibit 170: Planet Innovation Holdings – Key offerings
- 12.15 Plexus Corp.
- Exhibit 171: Plexus Corp. – Overview
- Exhibit 172: Plexus Corp. – Business segments
- Exhibit 173: Plexus Corp. – Key offerings
- Exhibit 174: Plexus Corp. – Segment focus
- 12.16 StarFish Product Engineering Inc.
- Exhibit 175: StarFish Product Engineering Inc. – Overview
- Exhibit 176: StarFish Product Engineering Inc. – Product / Service
- Exhibit 177: StarFish Product Engineering Inc. – Key offerings
- 12.17 Veranex
- Exhibit 178: Veranex – Overview
- Exhibit 179: Veranex – Product / Service
- Exhibit 180: Veranex – Key offerings
13 Appendix
- 13.1 Scope of the report
- 13.2 Inclusions and exclusions checklist
- Exhibit 181: Inclusions checklist
- Exhibit 182: Exclusions checklist
- 13.3 Currency conversion rates for US$
- Exhibit 183: Currency conversion rates for US$
- 13.4 Research methodology
- Exhibit 184: Research methodology
- Exhibit 185: Validation techniques employed for market sizing
- Exhibit 186: Information sources
- 13.5 List of abbreviations
- Exhibit 187: List of abbreviations
About Us
Technavio is a leading global technology research and advisory company. Their research and analysis focuses on emerging market trends and provides actionable insights to help businesses identify market opportunities and develop effective strategies to optimize their market positions. With over 500 specialized analysts, Technavio’s report library consists of more than 17,000 reports and counting, covering 800 technologies, spanning across 50 countries. Their client base consists of enterprises of all sizes, including more than 100 Fortune 500 companies. This growing client base relies on Technavio’s comprehensive coverage, extensive research, and actionable market insights to identify opportunities in existing and potential markets and assess their competitive positions within changing market scenarios.
Contact
Technavio Research
Jesse Maida
Media & Marketing Executive
US: +1 844 364 1100
UK: +44 203 893 3200
Email: [email protected]
Website: www.technavio.com
SOURCE Technavio
