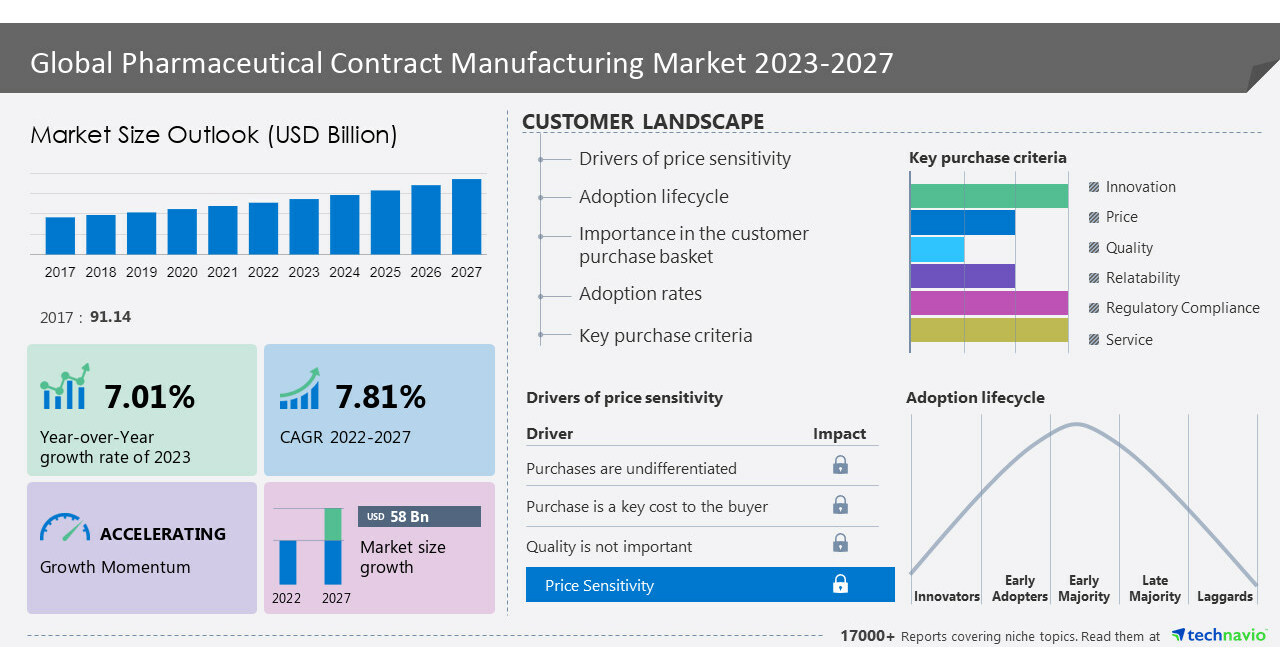
NEW YORK, May 11, 2023 /PRNewswire/ — The pharmaceutical contract manufacturing market size is set to grow by USD 58 billion from 2022 to 2027 progressing at a CAGR of 7.81% during the forecast period. The report offers an up-to-date analysis regarding the current global market scenario, the latest trends and drivers, and the overall market environment. The omnichannel retailing technique by pharmacy chains is a major driving factor for the market growth. Due to the growing adoption of online pharmacies by consumers, retail pharmacy chains in Europe have integrated online services and mobile applications with their traditional platforms to provide rapid and real-time access to the retail brand, which is known as an omnichannel approach. This offers a combination of physical and digital experiences with pharmacy as their touchpoint, including stock availability advice and display, backed by real-time inventory data and effective logistics. – Here is an Exclusive report talking about Market scenarios with a historical period (2017-2021) and forecast period (2023-2027). Download Sample Report in minutes!
The pharmaceutical contract manufacturing market covers the following areas:
Pharmaceutical Contract Manufacturing Market Sizing
Pharmaceutical Contract Manufacturing Market Forecast
Pharmaceutical Contract Manufacturing Market Analysis
The report on the pharmaceutical contract manufacturing market provides a holistic update, market size and forecast, trends, growth drivers, and challenges, as well as vendor analysis.
Pharmaceutical Contract Manufacturing Market 2023-2027 – Market Dynamics
A recent trend in the global contract manufacturing market is the increase in US FDA-approved manufacturing facilities in emerging markets. China and India are two key countries in the global contract manufacturing market with China’s contract pharmaceutical manufacturing market has been limited to Contract Research Organizations (CROs). This is due to strict government regulations on CMOs but the market has witnessed a significant change since the country’s State Council allowed drug Marketing Authorization Holders (MAH) to use third-party licensed manufacturers or CMOs in most regions of the country. Hence, such trends influence the growth of the market growth during the forecast period.
Capacity utilization and constraints are major challenges impeding the growth of the global pharmaceutical contract manufacturing market. Utilization is a measure of actual production versus potential production at the company’s maximum production capacity. Owing to the complexity of the manufacturing process, it plays an important role in the production of various therapeutic agents, especially biological medicines. The constraints associated with manufacturing are preventing CMOs from producing therapeutics at their full potential, which is causing delays in the launch of several therapeutics.
Pharmaceutical Contract Manufacturing Market 2023-2027: Market Segmentation
This report extensively covers market segmentation by type (Rx and OTC), and product (medications, health wellness and nutrition, and personal care and essentials).
- The market share growth by the Rx segment will be significant for overall market growth during the forecast period. Rx stands for ‘prescription’ drugs and one of the major reasons for the market growth is the improved life expectancy of people resulting in the growth of the older population. The geriatric population (aged 65 years or more) living in the region is increasing, which leads to an increase in the number of people with chronic diseases, which is raising the demand for prescription medicines. Thus, the sales of prescription medicines through the online platform are expected to increase. Moreover, the changing healthcare infrastructure, such as telemedicine, is increasing the involvement of technology in the healthcare sector.
This report presents a detailed picture of the market by the way of study, synthesis, and summation of data from multiple sources through an analysis of key parameters- View Sample Report
What’s New?
- Special coverage on the Russia–Ukraine war; global inflation; recovery analysis from COVID-19; supply chain disruptions, global trade tensions; and risk of recession
- Global competitiveness and key competitor positions
- Market presence across multiple geographical footprints – Strong/Active/Niche/Trivial - buy the report!
Companies Mentioned
- AbbVie Inc.
- Almac Group Ltd.
- Baxter International Inc.
- Boehringer Ingelheim International GmbH
- Cadila Pharmaceuticals Ltd.
- Charles River Laboratories International Inc.
- Cmic Holdings Co. Ltd.
- Dalton Pharma Services
- Dr Reddys Laboratories Ltd.
- Grifols SA
- Laboratory Corp. of America Holdings
- Lonza Group Ltd.
- Lupin Ltd.
- Novotech Health Holdings
- OPTIMAPHARM d.o.o.
- Parexel International Corp.
- PCI Pharma Services
- Recipharm AB
- Syneos Health Inc.
- Thermo Fisher Scientific Inc.
Vendor Offerings
- Almac Group Ltd. – The company offers pharmaceutical contract manufacturing services such as diagnostic services, API services, and pharmaceutical development.
- Boehringer Ingelheim International GmbH – The company offers pharmaceutical contract manufacturing services namely BioXcellence.
- Cadila Pharmaceuticals Ltd. – The company offers pharmaceutical contract manufacturing services such as active pharmaceutical ingredients and generic formulations.
Gain instant access to 17,000+ market research reports.
Technavio’s SUBSCRIPTION platform
Related Reports:
The pharma e-commerce market in Europe is estimated to grow at a CAGR of 15.47% between 2022 and 2027. The size of the market is forecast to increase by USD 16.42 billion. This report extensively covers market segmentation by type (Rx and OTC), and product (medications, health wellness and nutrition, and personal care and essentials). The omnichannel retailing technique by pharmacy chains is notably driving the market growth.
The ibuprofen active pharmaceutical ingredient (API) market is estimated to grow at a CAGR of 2.53% between 2022 and 2027. The size of the market is forecasted to increase by USD 31.68 million. This report extensively covers market segmentation by end-user (pharmaceutical companies and contract manufacturing organizations), product (prescription and over-the-counter), and geography (Asia, North America, Europe, and Rest of World (ROW). The increasing geriatric population is notably driving the ibuprofen active pharmaceutical ingredient (API) market growth.
|
Pharmaceutical Contract Manufacturing Market Scope |
|
|
Report Coverage |
Details |
|
Base year |
2022 |
|
Historic period |
2017-2021 |
|
Forecast period |
2023-2027 |
|
Growth momentum & CAGR |
Accelerate at a CAGR of 7.81% |
|
Market growth 2023-2027 |
USD 58 billion |
|
Market structure |
Fragmented |
|
YoY growth 2022-2023(%) |
7.01 |
|
Regional analysis |
North America, Asia, Europe, and Rest of World (ROW) |
|
Performing market contribution |
North America at 41% |
|
Key countries |
US, Germany, UK, China, and India |
|
Competitive landscape |
Leading Vendors, Market Positioning of Vendors, Competitive Strategies, and Industry Risks |
|
Key companies profiled |
AbbVie Inc., Almac Group Ltd., Baxter International Inc., Boehringer Ingelheim International GmbH, Cadila Pharmaceuticals Ltd., Charles River Laboratories International Inc., Cmic Holdings Co. Ltd., Dalton Pharma Services, Dr Reddys Laboratories Ltd., Grifols SA, Laboratory Corp. of America Holdings, Lonza Group Ltd., Lupin Ltd., Novotech Health Holdings, OPTIMAPHARM d.o.o., Parexel International Corp., PCI Pharma Services, Recipharm AB, Syneos Health Inc., and Thermo Fisher Scientific Inc. |
|
Market dynamics |
Parent market analysis, Market growth inducers and obstacles, Fast-growing and slow-growing segment analysis, COVID-19 impact and recovery analysis and future consumer dynamics, Market condition analysis for forecast period |
|
Customization purview |
If our report has not included the data that you are looking for, you can reach out to our analysts and get segments customized. |
Browse for Technavio’s Health Care Market Reports
Key Topics Covered:
1 Executive Summary
- 1.1 Market overview
- Exhibit 01: Executive Summary – Chart on Market Overview
- Exhibit 02: Executive Summary – Data Table on Market Overview
- Exhibit 03: Executive Summary – Chart on Global Market Characteristics
- Exhibit 04: Executive Summary – Chart on Market by Geography
- Exhibit 05: Executive Summary – Chart on Market Segmentation by End-user
- Exhibit 06: Executive Summary – Chart on Market Segmentation by Service
- Exhibit 07: Executive Summary – Chart on Incremental Growth
- Exhibit 08: Executive Summary – Data Table on Incremental Growth
- Exhibit 09: Executive Summary – Chart on Vendor Market Positioning
2 Market Landscape
- 2.1 Market ecosystem
- Exhibit 10: Parent market
- Exhibit 11: Market Characteristics
3 Market Sizing
- 3.1 Market definition
- Exhibit 12: Offerings of vendors included in the market definition
- 3.2 Market segment analysis
- Exhibit 13: Market segments
- 3.4 Market outlook: Forecast for 2022-2027
- Exhibit 14: Chart on Global – Market size and forecast 2022-2027 ($ billion)
- Exhibit 15: Data Table on Global – Market size and forecast 2022-2027 ($ billion)
- Exhibit 16: Chart on Global Market: Year-over-year growth 2022-2027 (%)
- Exhibit 17: Data Table on Global Market: Year-over-year growth 2022-2027 (%)
4 Historic Market Size
- 4.1 Global pharmaceutical contract manufacturing market 2017 – 2021
- Exhibit 18: Historic Market Size – Data Table on Global pharmaceutical contract manufacturing market 2017 – 2021 ($ billion)
- 4.2 End-user Segment Analysis 2017 – 2021
- Exhibit 19: Historic Market Size – End-user Segment 2017 – 2021 ($ billion)
- 4.3 Service Segment Analysis 2017 – 2021
- Exhibit 20: Historic Market Size – Service Segment 2017 – 2021 ($ billion)
- 4.4 Geography Segment Analysis 2017 – 2021
- Exhibit 21: Historic Market Size – Geography Segment 2017 – 2021 ($ billion)
- 4.5 Country Segment Analysis 2017 – 2021
- Exhibit 22: Historic Market Size – Country Segment 2017 – 2021 ($ billion)
5 Five Forces Analysis
- 5.1 Five forces summary
- Exhibit 23: Five forces analysis – Comparison between 2022 and 2027
- 5.2 Bargaining power of buyers
- Exhibit 24: Chart on Bargaining power of buyers – Impact of key factors 2022 and 2027
- 5.3 Bargaining power of suppliers
- Exhibit 25: Bargaining power of suppliers – Impact of key factors in 2022 and 2027
- 5.4 Threat of new entrants
- Exhibit 26: Threat of new entrants – Impact of key factors in 2022 and 2027
- 5.5 Threat of substitutes
- Exhibit 27: Threat of substitutes – Impact of key factors in 2022 and 2027
- 5.6 Threat of rivalry
- Exhibit 28: Threat of rivalry – Impact of key factors in 2022 and 2027
- 5.7 Market condition
- Exhibit 29: Chart on Market condition – Five forces 2022 and 2027
6 Market Segmentation by End-user
- 6.1 Market segments
- Exhibit 30: Chart on End-user – Market share 2022-2027 (%)
- Exhibit 31: Data Table on End-user – Market share 2022-2027 (%)
- 6.2 Comparison by End-user
- Exhibit 32: Chart on Comparison by End-user
- Exhibit 33: Data Table on Comparison by End-user
- 6.3 Big pharmaceutical companies – Market size and forecast 2022-2027
- Exhibit 34: Chart on Big pharmaceutical companies – Market size and forecast 2022-2027 ($ billion)
- Exhibit 35: Data Table on Big pharmaceutical companies – Market size and forecast 2022-2027 ($ billion)
- Exhibit 36: Chart on Big pharmaceutical companies – Year-over-year growth 2022-2027 (%)
- Exhibit 37: Data Table on Big pharmaceutical companies – Year-over-year growth 2022-2027 (%)
- 6.4 Small and medium-sized pharmaceutical companies – Market size and forecast 2022-2027
- Exhibit 38: Chart on Small and medium-sized pharmaceutical companies – Market size and forecast 2022-2027 ($ billion)
- Exhibit 39: Data Table on Small and medium-sized pharmaceutical companies – Market size and forecast 2022-2027 ($ billion)
- Exhibit 40: Chart on Small and medium-sized pharmaceutical companies – Year-over-year growth 2022-2027 (%)
- Exhibit 41: Data Table on Small and medium-sized pharmaceutical companies – Year-over-year growth 2022-2027 (%)
- 6.5 Generic pharmaceutical companies – Market size and forecast 2022-2027
- Exhibit 42: Chart on Generic pharmaceutical companies – Market size and forecast 2022-2027 ($ billion)
- Exhibit 43: Data Table on Generic pharmaceutical companies – Market size and forecast 2022-2027 ($ billion)
- Exhibit 44: Chart on Generic pharmaceutical companies – Year-over-year growth 2022-2027 (%)
- Exhibit 45: Data Table on Generic pharmaceutical companies – Year-over-year growth 2022-2027 (%)
- 6.6 Market opportunity by End-user
- Exhibit 46: Market opportunity by End-user ($ billion)
- Exhibit 47: Data Table on Market opportunity by End-user ($ billion)
7 Market Segmentation by Service
- 7.1 Market segments
- Exhibit 48: Chart on Service – Market share 2022-2027 (%)
- Exhibit 49: Data Table on Service – Market share 2022-2027 (%)
- 7.2 Comparison by Service
- Exhibit 50: Chart on Comparison by Service
- Exhibit 51: Data Table on Comparison by Service
- 7.3 API/bulk drug manufacturing – Market size and forecast 2022-2027
- Exhibit 52: Chart on API/bulk drug manufacturing – Market size and forecast 2022-2027 ($ billion)
- Exhibit 53: Data Table on API/bulk drug manufacturing – Market size and forecast 2022-2027 ($ billion)
- Exhibit 54: Chart on API/bulk drug manufacturing – Year-over-year growth 2022-2027 (%)
- Exhibit 55: Data Table on API/bulk drug manufacturing – Year-over-year growth 2022-2027 (%)
- 7.4 Final dosage form – Market size and forecast 2022-2027
- Exhibit 56: Chart on Final dosage form – Market size and forecast 2022-2027 ($ billion)
- Exhibit 57: Data Table on Final dosage form – Market size and forecast 2022-2027 ($ billion)
- Exhibit 58: Chart on Final dosage form – Year-over-year growth 2022-2027 (%)
- Exhibit 59: Data Table on Final dosage form – Year-over-year growth 2022-2027 (%)
- 7.5 Secondary packaging – Market size and forecast 2022-2027
- Exhibit 60: Chart on Secondary packaging – Market size and forecast 2022-2027 ($ billion)
- Exhibit 61: Data Table on Secondary packaging – Market size and forecast 2022-2027 ($ billion)
- Exhibit 62: Chart on Secondary packaging – Year-over-year growth 2022-2027 (%)
- Exhibit 63: Data Table on Secondary packaging – Year-over-year growth 2022-2027 (%)
- 7.6 Market opportunity by Service
- Exhibit 64: Market opportunity by Service ($ billion)
- Exhibit 65: Data Table on Market opportunity by Service ($ billion)
8 Customer Landscape
- 8.1 Customer landscape overview
- Exhibit 66: Analysis of price sensitivity, lifecycle, customer purchase basket, adoption rates, and purchase criteria
9 Geographic Landscape
- 9.1 Geographic segmentation
- Exhibit 67: Chart on Market share by geography 2022-2027 (%)
- Exhibit 68: Data Table on Market share by geography 2022-2027 (%)
- 9.2 Geographic comparison
- Exhibit 69: Chart on Geographic comparison
- Exhibit 70: Data Table on Geographic comparison
- 9.3 North America – Market size and forecast 2022-2027
- Exhibit 71: Chart on North America – Market size and forecast 2022-2027 ($ billion)
- Exhibit 72: Data Table on North America – Market size and forecast 2022-2027 ($ billion)
- Exhibit 73: Chart on North America – Year-over-year growth 2022-2027 (%)
- Exhibit 74: Data Table on North America – Year-over-year growth 2022-2027 (%)
- 9.4 Asia – Market size and forecast 2022-2027
- Exhibit 75: Chart on Asia – Market size and forecast 2022-2027 ($ billion)
- Exhibit 76: Data Table on Asia – Market size and forecast 2022-2027 ($ billion)
- Exhibit 77: Chart on Asia – Year-over-year growth 2022-2027 (%)
- Exhibit 78: Data Table on Asia – Year-over-year growth 2022-2027 (%)
- 9.5 Europe – Market size and forecast 2022-2027
- Exhibit 79: Chart on Europe – Market size and forecast 2022-2027 ($ billion)
- Exhibit 80: Data Table on Europe – Market size and forecast 2022-2027 ($ billion)
- Exhibit 81: Chart on Europe – Year-over-year growth 2022-2027 (%)
- Exhibit 82: Data Table on Europe – Year-over-year growth 2022-2027 (%)
- 9.6 Rest of World (ROW) – Market size and forecast 2022-2027
- Exhibit 83: Chart on Rest of World (ROW) – Market size and forecast 2022-2027 ($ billion)
- Exhibit 84: Data Table on Rest of World (ROW) – Market size and forecast 2022-2027 ($ billion)
- Exhibit 85: Chart on Rest of World (ROW) – Year-over-year growth 2022-2027 (%)
- Exhibit 86: Data Table on Rest of World (ROW) – Year-over-year growth 2022-2027 (%)
- 9.7 US – Market size and forecast 2022-2027
- Exhibit 87: Chart on US – Market size and forecast 2022-2027 ($ billion)
- Exhibit 88: Data Table on US – Market size and forecast 2022-2027 ($ billion)
- Exhibit 89: Chart on US – Year-over-year growth 2022-2027 (%)
- Exhibit 90: Data Table on US – Year-over-year growth 2022-2027 (%)
- 9.8 China – Market size and forecast 2022-2027
- Exhibit 91: Chart on China – Market size and forecast 2022-2027 ($ billion)
- Exhibit 92: Data Table on China – Market size and forecast 2022-2027 ($ billion)
- Exhibit 93: Chart on China – Year-over-year growth 2022-2027 (%)
- Exhibit 94: Data Table on China – Year-over-year growth 2022-2027 (%)
- 9.9 India – Market size and forecast 2022-2027
- Exhibit 95: Chart on India – Market size and forecast 2022-2027 ($ billion)
- Exhibit 96: Data Table on India – Market size and forecast 2022-2027 ($ billion)
- Exhibit 97: Chart on India – Year-over-year growth 2022-2027 (%)
- Exhibit 98: Data Table on India – Year-over-year growth 2022-2027 (%)
- 9.10 Germany – Market size and forecast 2022-2027
- Exhibit 99: Chart on Germany – Market size and forecast 2022-2027 ($ billion)
- Exhibit 100: Data Table on Germany – Market size and forecast 2022-2027 ($ billion)
- Exhibit 101: Chart on Germany – Year-over-year growth 2022-2027 (%)
- Exhibit 102: Data Table on Germany – Year-over-year growth 2022-2027 (%)
- 9.11 UK – Market size and forecast 2022-2027
- Exhibit 103: Chart on UK – Market size and forecast 2022-2027 ($ billion)
- Exhibit 104: Data Table on UK – Market size and forecast 2022-2027 ($ billion)
- Exhibit 105: Chart on UK – Year-over-year growth 2022-2027 (%)
- Exhibit 106: Data Table on UK – Year-over-year growth 2022-2027 (%)
- 9.12 Market opportunity by geography
- Exhibit 107: Market opportunity by geography ($ billion)
- Exhibit 108: Data Tables on Market opportunity by geography ($ billion)
10 Drivers, Challenges, and Trends
- 10.3 Impact of drivers and challenges
- Exhibit 109: Impact of drivers and challenges in 2022 and 2027
11 Vendor Landscape
- 11.2 Vendor landscape
- Exhibit 110: Overview on Criticality of inputs and Factors of differentiation
- 11.3 Landscape disruption
- Exhibit 111: Overview on factors of disruption
- 11.4 Industry risks
- Exhibit 112: Impact of key risks on business
12 Vendor Analysis
- 12.1 Vendors covered
- Exhibit 113: Vendors covered
- 12.2 Market positioning of vendors
- Exhibit 114: Matrix on vendor position and classification
- 12.3 Almac Group Ltd.
- Exhibit 115: Almac Group Ltd. – Overview
- Exhibit 116: Almac Group Ltd. – Product / Service
- Exhibit 117: Almac Group Ltd. – Key offerings
- 12.4 Boehringer Ingelheim International GmbH
- Exhibit 118: Boehringer Ingelheim International GmbH – Overview
- Exhibit 119: Boehringer Ingelheim International GmbH – Business segments
- Exhibit 120: Boehringer Ingelheim International GmbH – Key news
- Exhibit 121: Boehringer Ingelheim International GmbH – Key offerings
- Exhibit 122: Boehringer Ingelheim International GmbH – Segment focus
- 12.5 Cadila Pharmaceuticals Ltd.
- Exhibit 123: Cadila Pharmaceuticals Ltd. – Overview
- Exhibit 124: Cadila Pharmaceuticals Ltd. – Product / Service
- Exhibit 125: Cadila Pharmaceuticals Ltd. – Key offerings
- 12.6 Charles River Laboratories International Inc.
- Exhibit 126: Charles River Laboratories International Inc. – Overview
- Exhibit 127: Charles River Laboratories International Inc. – Business segments
- Exhibit 128: Charles River Laboratories International Inc. – Key news
- Exhibit 129: Charles River Laboratories International Inc. – Key offerings
- Exhibit 130: Charles River Laboratories International Inc. – Segment focus
- 12.7 Cmic Holdings Co. Ltd.
- Exhibit 131: Cmic Holdings Co. Ltd. – Overview
- Exhibit 132: Cmic Holdings Co. Ltd. – Business segments
- Exhibit 133: Cmic Holdings Co. Ltd. – Key offerings
- Exhibit 134: Cmic Holdings Co. Ltd. – Segment focus
- 12.8 Dr Reddys Laboratories Ltd.
- Exhibit 135: Dr Reddys Laboratories Ltd. – Overview
- Exhibit 136: Dr Reddys Laboratories Ltd. – Business segments
- Exhibit 137: Dr Reddys Laboratories Ltd. – Key offerings
- Exhibit 138: Dr Reddys Laboratories Ltd. – Segment focus
- 12.9 Laboratory Corp. of America Holdings
- Exhibit 139: Laboratory Corp. of America Holdings – Overview
- Exhibit 140: Laboratory Corp. of America Holdings – Business segments
- Exhibit 141: Laboratory Corp. of America Holdings – Key news
- Exhibit 142: Laboratory Corp. of America Holdings – Key offerings
- Exhibit 143: Laboratory Corp. of America Holdings – Segment focus
- 12.10 Lonza Group Ltd.
- Exhibit 144: Lonza Group Ltd. – Overview
- Exhibit 145: Lonza Group Ltd. – Business segments
- Exhibit 146: Lonza Group Ltd. – Key news
- Exhibit 147: Lonza Group Ltd. – Key offerings
- Exhibit 148: Lonza Group Ltd. – Segment focus
- 12.11 Lupin Ltd.
- Exhibit 149: Lupin Ltd. – Overview
- Exhibit 150: Lupin Ltd. – Product / Service
- Exhibit 151: Lupin Ltd. – Key news
- Exhibit 152: Lupin Ltd. – Key offerings
- 12.12 OPTIMAPHARM d.o.o.
- Exhibit 153: OPTIMAPHARM d.o.o. – Overview
- Exhibit 154: OPTIMAPHARM d.o.o. – Product / Service
- Exhibit 155: OPTIMAPHARM d.o.o. – Key offerings
- 12.13 Parexel International Corp.
- Exhibit 156: Parexel International Corp. – Overview
- Exhibit 157: Parexel International Corp. – Product / Service
- Exhibit 158: Parexel International Corp. – Key news
- Exhibit 159: Parexel International Corp. – Key offerings
- 12.14 PCI Pharma Services
- Exhibit 160: PCI Pharma Services – Overview
- Exhibit 161: PCI Pharma Services – Product / Service
- Exhibit 162: PCI Pharma Services – Key offerings
- 12.15 Recipharm AB
- Exhibit 163: Recipharm AB – Overview
- Exhibit 164: Recipharm AB – Business segments
- Exhibit 165: Recipharm AB – Key offerings
- Exhibit 166: Recipharm AB – Segment focus
- 12.16 Syneos Health Inc.
- Exhibit 167: Syneos Health Inc. – Overview
- Exhibit 168: Syneos Health Inc. – Business segments
- Exhibit 169: Syneos Health Inc. – Key offerings
- Exhibit 170: Syneos Health Inc. – Segment focus
- 12.17 Thermo Fisher Scientific Inc.
- Exhibit 171: Thermo Fisher Scientific Inc. – Overview
- Exhibit 172: Thermo Fisher Scientific Inc. – Business segments
- Exhibit 173: Thermo Fisher Scientific Inc. – Key news
- Exhibit 174: Thermo Fisher Scientific Inc. – Key offerings
- Exhibit 175: Thermo Fisher Scientific Inc. – Segment focus
13 Appendix
- 13.2 Inclusions and exclusions checklist
- Exhibit 176: Inclusions checklist
- Exhibit 177: Exclusions checklist
- 13.3 Currency conversion rates for US$
- Exhibit 178: Currency conversion rates for US$
- 13.4 Research methodology
- Exhibit 179: Research methodology
- Exhibit 180: Validation techniques employed for market sizing
- Exhibit 181: Information sources
- 13.5 List of abbreviations
- Exhibit 182: List of abbreviations
About Us
Technavio is a leading global technology research and advisory company. Their research and analysis focuses on emerging market trends and provides actionable insights to help businesses identify market opportunities and develop effective strategies to optimize their market positions. With over 500 specialized analysts, Technavio’s report library consists of more than 17,000 reports and counting, covering 800 technologies, spanning across 50 countries. Their client base consists of enterprises of all sizes, including more than 100 Fortune 500 companies. This growing client base relies on Technavio’s comprehensive coverage, extensive research, and actionable market insights to identify opportunities in existing and potential markets and assess their competitive positions within changing market scenarios.
Contact
Technavio Research
Jesse Maida
Media & Marketing Executive
US: +1 844 364 1100
UK: +44 203 893 3200
Email: [email protected]
Website: www.technavio.com/
SOURCE Technavio
