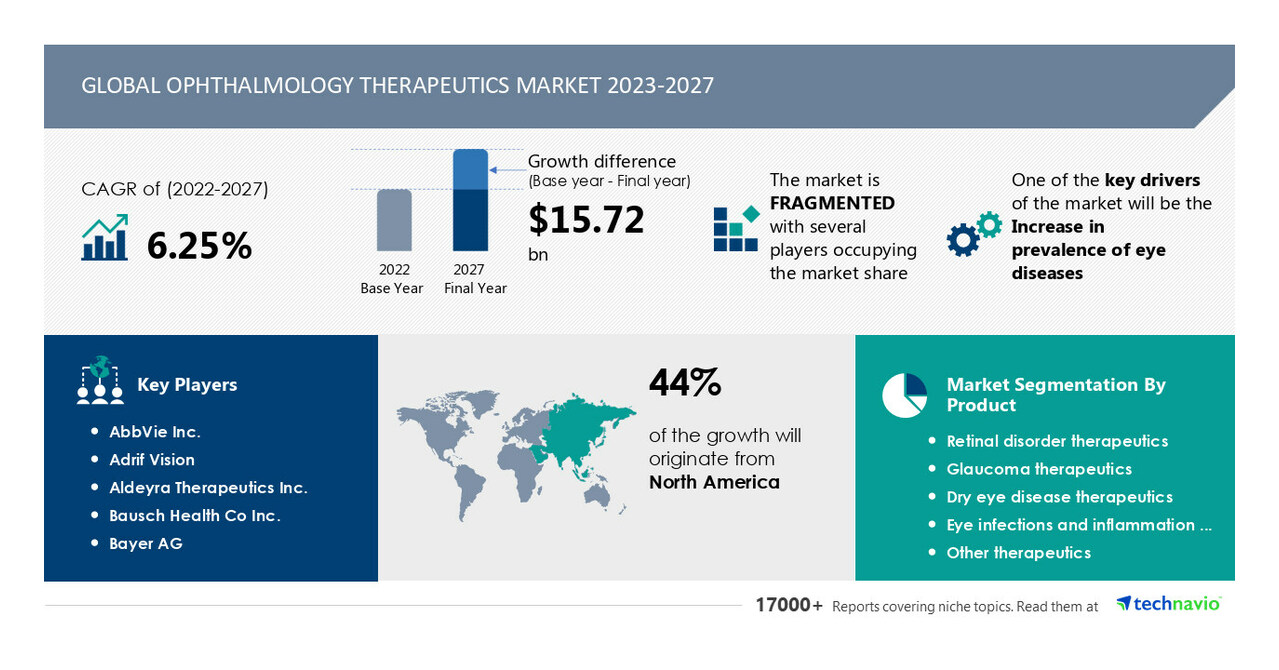
NEW YORK, June 27, 2023 /PRNewswire/ — The Ophthalmology Therapeutics Market report has been added to Technavio’s offering. The ophthalmology therapeutics market is estimated to grow by USD 15.72 billion from 2022 to 2027, growing at a CAGR of 6.25% during the forecast period. North America is estimated to account for 44% of the growth of the global market during the forecast period. The strong prevalence of eye diseases such as age-related macular degeneration, glaucoma, dry eye, and various eye infections make up the major factors for regional market growth. The rising incidence of risk factors such as prolonged use of corticosteroids, diabetes, a family history of eye diseases, previous eye injuries or eye surgeries, and extended exposure to sunlight are also major factors responsible for the high prevalence of eye diseases in North America. This growing prevalence of eye disorders leads to an increase in various initiatives that aim at making the public aware of eye diseases. For Comprehensive details on the market size of the historic period(2017 to 2021) and forecast period (2023-2027) – View the Sample report
Ophthalmology therapeutics market – Vendor Landscape
The ophthalmology therapeutics market is fragmented; the vendors are competing with competitors and are trying to get a greater market share. The market is growing, and the chances of new entrants cannot be overlooked. The major vendors have well-established economies of scale and market presence and generally rely on positioning technological advances, and the price of the products –The report provides a full list of key vendors, their strategies, and the latest developments. Buy Now
Ophthalmology therapeutics market – Market Dynamics
Major Drivers & Challenges-
The increase in the prevalence of eye diseases drives the ophthalmology therapeutics market during the forecast period. Eye diseases such as age-related macular degeneration have become more prevalent and become a serious public health concern as they can cause irreversible blindness and visual impairment. The growing geriatric population is a major factor contributing to the increase in the prevalence of age-related macular degeneration. Additionally, glaucoma is another eye condition that can damage the optic nerve and lead to the development of eye diseases. Glaucoma is the second-most common cause of vision loss worldwide after cataracts and thus, the rise in the prevalence of eye diseases has led to an increase in demand for ophthalmology therapeutics. Hence, such factors boost the growth of the market during the forecast period.
The high costs of treatment hamper the growth of the ophthalmology therapeutics market during the forecast period. It is very expensive to treat eye diseases such as age-related macular degeneration, diabetic macular edema, and other vision-threatening retinal diseases. For instance, the cost of LUCENTIS 0.5 mg, which is used to treat wet age-related macular degeneration and retinal vein occlusion, can range from USD 1,950 to USD 2,023 per dose. Similarly, the cost of LUCENTIS 0.3 mg for the treatment of diabetic macular edema can be USD 1,170 per dose. Hence, such high costs impede market growth during the forecast period.
Key Trends–
The development of novel drug delivery systems is an emerging ophthalmology therapeutics market trend. Researchers face a major problem with the improper administration of the drugs to the eyes, including instilling an incorrect number of drops, as it is associated with several barriers in the eye, preventing the actual dose from reaching the site of action. In order to overcome these challenges researchers have developed novel drug delivery systems. This helps reduce adverse effects, increase the bioavailability of drugs to the targeted site, and enable drugs to have a prolonged action. Also, they help in overcoming all the barriers in the eye, which are responsible for the reduced bioavailability of drugs. Hence, such trends fuel the market growth during the forecast period.
Technavio has identified key trends, drivers, and challenges in the market, which will help clients improve their strategies to stay ahead of their competitors. – View Sample Report
Company Profiles
The ophthalmology therapeutics market report includes information on the product launches, sustainability, and prospects of leading vendors including AbbVie Inc., Adrif Vision, Aldeyra Therapeutics Inc., Bausch Health Co Inc., Bayer AG, Eyeris Vision Care Pvt. Ltd., F. Hoffmann La Roche Ltd., Grevis Pharmaceuticals Pvt. Ltd., Novartis AG, Ocular Therapeutix Inc., Otsuka Pharmaceutical Co. Ltd., Oxurion NV, Pfizer Inc., Regeneron Pharmaceuticals Inc., Santen Pharmaceutical Co. Ltd., Sun Pharmaceutical Industries Ltd., Swissvision, Teva Pharmaceutical Industries Ltd., Vee Remedies, and Visufarma.
Competitive Analysis
The report includes competitive analysis, a proprietary tool to analyze and evaluate the position of companies based on their industry position score and market performance score. The competitive scenario categorizes companies based on various performance indicators. Some of the factors considered include the financial performance of companies over the past few years, growth strategies, product innovations, new product launches, investments, and growth in market share, among others.
Ophthalmology therapeutics market – Market Segmentation
This market report extensively covers market segmentation by product (retinal disorder therapeutics, glaucoma therapeutics, dry eye disease therapeutics, eye infections and inflammation therapeutics, and other therapeutics), type (prescription drugs and OTC drugs), and geography (North America, Europe, Asia, and Rest of World (ROW)).
- The market share growth of the retinal disorder therapeutics segment will be significant during the forecast period. This segment includes retinal diseases such as age-related macular degeneration, diabetic eye disease, retinal vein occlusion, macular edema, posterior vitreous detachment, retinal dystrophy, and RPE65 mutation-associated inherited retinal disease. The segment is driven by the high incidence of retinal disorders as well as the presence of approved retinal disorder therapeutics. Hence, such factors boost the segment growth during the forecast period.
Gain instant access to 17,000+ market research reports.
Technavio’s SUBSCRIPTION platform
Related Reports:
The ophthalmology devices market size is expected to increase by USD 17.09 billion from 2021 to 2026, and the market’s growth momentum will accelerate at a CAGR of 4.1%. Furthermore, this report extensively covers ophthalmology devices market segmentation by product (vision care, ophthalmology surgical devices, and ophthalmology diagnostic devices), geography (North America, Europe, Asia, and the Rest of the World (ROW)), and end-user (hospitals and clinics, ASCs and physicians, offices, and optical retailers). he increasing prevalence of ophthalmic diseases and technological advances in ophthalmology devices is notably driving the ophthalmology market growth.
The eye care surgical devices market size is expected to increase by USD 3.13 billion from 2021 to 2026, and the market’s growth momentum will accelerate at a CAGR of 5.75%. Furthermore, this report extensively covers ophthalmology surgical devices market segmentation by product (cataract surgery devices, glaucoma surgery devices, refractive surgery devices, and vitreoretinal surgery devices) and geography (North America, Europe, Asia, and Rest of World (ROW)). The increasing prevalence of ophthalmic diseases is notably driving the eye care surgical devices market growth.
|
Ophthalmology Therapeutics Market Scope |
|
|
Report Coverage |
Details |
|
Base year |
2022 |
|
Historic period |
2017-2021 |
|
Forecast period |
2023-2027 |
|
Growth momentum & CAGR |
Accelerate at a CAGR of 6.25% |
|
Market growth 2023-2027 |
USD 15.72 billion |
|
Market structure |
Fragmented |
|
YoY growth 2022-2023 (%) |
5.32 |
|
Regional analysis |
North America, Europe, Asia, and Rest of World (ROW) |
|
Performing market contribution |
North America at 44% |
|
Key countries |
US, Germany, UK, France, and Japan |
|
Competitive landscape |
Leading Vendors, Market Positioning of Vendors, Competitive Strategies, and Industry Risks |
|
Key companies profiled |
AbbVie Inc., Adrif Vision, Aldeyra Therapeutics Inc., Bausch Health Co Inc., Bayer AG, Eyeris Vision Care Pvt. Ltd., F. Hoffmann La Roche Ltd., Grevis Pharmaceuticals Pvt. Ltd., Novartis AG, Ocular Therapeutix Inc., Otsuka Pharmaceutical Co. Ltd., Oxurion NV, Pfizer Inc., Regeneron Pharmaceuticals Inc., Santen Pharmaceutical Co. Ltd., Sun Pharmaceutical Industries Ltd., Swissvision, Teva Pharmaceutical Industries Ltd., Vee Remedies, and Visufarma |
|
Market dynamics |
Parent market analysis, Market growth inducers and obstacles, Fast-growing and slow-growing segment analysis, COVID-19 impact and recovery analysis and future consumer dynamics, Market condition analysis for forecast period. |
|
Customization purview |
If our report has not included the data that you are looking for, you can reach out to our analysts and get segments customized. |
Table of Contents
1 Executive Summary
- 1.1 Market overview
- Exhibit 01: Executive Summary – Chart on Market Overview
- Exhibit 02: Executive Summary – Data Table on Market Overview
- Exhibit 03: Executive Summary – Chart on Global Market Characteristics
- Exhibit 04: Executive Summary – Chart on Market by Geography
- Exhibit 05: Executive Summary – Chart on Market Segmentation by Product
- Exhibit 06: Executive Summary – Chart on Market Segmentation by Type
- Exhibit 07: Executive Summary – Chart on Incremental Growth
- Exhibit 08: Executive Summary – Data Table on Incremental Growth
- Exhibit 09: Executive Summary – Chart on Vendor Market Positioning
2 Market Landscape
- 2.1 Market ecosystem
- Exhibit 10: Parent market
- Exhibit 11: Market Characteristics
3 Market Sizing
- 3.1 Market definition
- Exhibit 12: Offerings of vendors included in the market definition
- 3.2 Market segment analysis
- Exhibit 13: Market segments
- 3.4 Market outlook: Forecast for 2022-2027
- Exhibit 14: Chart on Global – Market size and forecast 2022-2027 ($ billion)
- Exhibit 15: Data Table on Global – Market size and forecast 2022-2027 ($ billion)
- Exhibit 16: Chart on Global Market: Year-over-year growth 2022-2027 (%)
- Exhibit 17: Data Table on Global Market: Year-over-year growth 2022-2027 (%)
4 Historic Market Size
- 4.1 Global ophthalmology therapeutics market 2017 – 2021
- Exhibit 18: Historic Market Size – Data Table on Global ophthalmology therapeutics market 2017 – 2021 ($ billion)
- 4.2 Product Segment Analysis 2017 – 2021
- Exhibit 19: Historic Market Size – Product Segment 2017 – 2021 ($ billion)
- 4.3 Type Segment Analysis 2017 – 2021
- Exhibit 20: Historic Market Size – Type Segment 2017 – 2021 ($ billion)
- 4.4 Geography Segment Analysis 2017 – 2021
- Exhibit 21: Historic Market Size – Geography Segment 2017 – 2021 ($ billion)
- 4.5 Country Segment Analysis 2017 – 2021
- Exhibit 22: Historic Market Size – Country Segment 2017 – 2021 ($ billion)
5 Five Forces Analysis
- 5.1 Five forces summary
- Exhibit 23: Five forces analysis – Comparison between 2022 and 2027
- 5.2 Bargaining power of buyers
- Exhibit 24: Chart on Bargaining power of buyers – Impact of key factors 2022 and 2027
- 5.3 Bargaining power of suppliers
- Exhibit 25: Bargaining power of suppliers – Impact of key factors in 2022 and 2027
- 5.4 Threat of new entrants
- Exhibit 26: Threat of new entrants – Impact of key factors in 2022 and 2027
- 5.5 Threat of substitutes
- Exhibit 27: Threat of substitutes – Impact of key factors in 2022 and 2027
- 5.6 Threat of rivalry
- Exhibit 28: Threat of rivalry – Impact of key factors in 2022 and 2027
- 5.7 Market condition
- Exhibit 29: Chart on Market condition – Five forces 2022 and 2027
6 Market Segmentation by Product
- 6.1 Market segments
- Exhibit 30: Chart on Product – Market share 2022-2027 (%)
- Exhibit 31: Data Table on Product – Market share 2022-2027 (%)
- 6.2 Comparison by Product
- Exhibit 32: Chart on Comparison by Product
- Exhibit 33: Data Table on Comparison by Product
- 6.3 Retinal disorder therapeutics – Market size and forecast 2022-2027
- Exhibit 34: Chart on Retinal disorder therapeutics – Market size and forecast 2022-2027 ($ billion)
- Exhibit 35: Data Table on Retinal disorder therapeutics – Market size and forecast 2022-2027 ($ billion)
- Exhibit 36: Chart on Retinal disorder therapeutics – Year-over-year growth 2022-2027 (%)
- Exhibit 37: Data Table on Retinal disorder therapeutics – Year-over-year growth 2022-2027 (%)
- 6.4 Glaucoma therapeutics – Market size and forecast 2022-2027
- Exhibit 38: Chart on Glaucoma therapeutics – Market size and forecast 2022-2027 ($ billion)
- Exhibit 39: Data Table on Glaucoma therapeutics – Market size and forecast 2022-2027 ($ billion)
- Exhibit 40: Chart on Glaucoma therapeutics – Year-over-year growth 2022-2027 (%)
- Exhibit 41: Data Table on Glaucoma therapeutics – Year-over-year growth 2022-2027 (%)
- 6.5 Dry eye disease therapeutics – Market size and forecast 2022-2027
- Exhibit 42: Chart on Dry eye disease therapeutics – Market size and forecast 2022-2027 ($ billion)
- Exhibit 43: Data Table on Dry eye disease therapeutics – Market size and forecast 2022-2027 ($ billion)
- Exhibit 44: Chart on Dry eye disease therapeutics – Year-over-year growth 2022-2027 (%)
- Exhibit 45: Data Table on Dry eye disease therapeutics – Year-over-year growth 2022-2027 (%)
- 6.6 Eye infections and inflammation therapeutics – Market size and forecast 2022-2027
- Exhibit 46: Chart on Eye infections and inflammation therapeutics – Market size and forecast 2022-2027 ($ billion)
- Exhibit 47: Data Table on Eye infections and inflammation therapeutics – Market size and forecast 2022-2027 ($ billion)
- Exhibit 48: Chart on Eye infections and inflammation therapeutics – Year-over-year growth 2022-2027 (%)
- Exhibit 49: Data Table on Eye infections and inflammation therapeutics – Year-over-year growth 2022-2027 (%)
- 6.7 Other therapeutics – Market size and forecast 2022-2027
- Exhibit 50: Chart on Other therapeutics – Market size and forecast 2022-2027 ($ billion)
- Exhibit 51: Data Table on Other therapeutics – Market size and forecast 2022-2027 ($ billion)
- Exhibit 52: Chart on Other therapeutics – Year-over-year growth 2022-2027 (%)
- Exhibit 53: Data Table on Other therapeutics – Year-over-year growth 2022-2027 (%)
- 6.8 Market opportunity by Product
- Exhibit 54: Market opportunity by Product ($ billion)
7 Market Segmentation by Type
- 7.1 Market segments
- Exhibit 55: Chart on Type – Market share 2022-2027 (%)
- Exhibit 56: Data Table on Type – Market share 2022-2027 (%)
- 7.2 Comparison by Type
- Exhibit 57: Chart on Comparison by Type
- Exhibit 58: Data Table on Comparison by Type
- 7.3 Prescription drugs – Market size and forecast 2022-2027
- Exhibit 59: Chart on Prescription drugs – Market size and forecast 2022-2027 ($ billion)
- Exhibit 60: Data Table on Prescription drugs – Market size and forecast 2022-2027 ($ billion)
- Exhibit 61: Chart on Prescription drugs – Year-over-year growth 2022-2027 (%)
- Exhibit 62: Data Table on Prescription drugs – Year-over-year growth 2022-2027 (%)
- 7.4 OTC drugs – Market size and forecast 2022-2027
- Exhibit 63: Chart on OTC drugs – Market size and forecast 2022-2027 ($ billion)
- Exhibit 64: Data Table on OTC drugs – Market size and forecast 2022-2027 ($ billion)
- Exhibit 65: Chart on OTC drugs – Year-over-year growth 2022-2027 (%)
- Exhibit 66: Data Table on OTC drugs – Year-over-year growth 2022-2027 (%)
- 7.5 Market opportunity by Type
- Exhibit 67: Market opportunity by Type ($ billion)
8 Customer Landscape
- 8.1 Customer landscape overview
- Exhibit 68: Analysis of price sensitivity, lifecycle, customer purchase basket, adoption rates, and purchase criteria
9 Geographic Landscape
- 9.1 Geographic segmentation
- Exhibit 69: Chart on Market share by geography 2022-2027 (%)
- Exhibit 70: Data Table on Market share by geography 2022-2027 (%)
- 9.2 Geographic comparison
- Exhibit 71: Chart on Geographic comparison
- Exhibit 72: Data Table on Geographic comparison
- 9.3 North America – Market size and forecast 2022-2027
- Exhibit 73: Chart on North America – Market size and forecast 2022-2027 ($ billion)
- Exhibit 74: Data Table on North America – Market size and forecast 2022-2027 ($ billion)
- Exhibit 75: Chart on North America – Year-over-year growth 2022-2027 (%)
- Exhibit 76: Data Table on North America – Year-over-year growth 2022-2027 (%)
- 9.4 Europe – Market size and forecast 2022-2027
- Exhibit 77: Chart on Europe – Market size and forecast 2022-2027 ($ billion)
- Exhibit 78: Data Table on Europe – Market size and forecast 2022-2027 ($ billion)
- Exhibit 79: Chart on Europe – Year-over-year growth 2022-2027 (%)
- Exhibit 80: Data Table on Europe – Year-over-year growth 2022-2027 (%)
- 9.5 Asia – Market size and forecast 2022-2027
- Exhibit 81: Chart on Asia – Market size and forecast 2022-2027 ($ billion)
- Exhibit 82: Data Table on Asia – Market size and forecast 2022-2027 ($ billion)
- Exhibit 83: Chart on Asia – Year-over-year growth 2022-2027 (%)
- Exhibit 84: Data Table on Asia – Year-over-year growth 2022-2027 (%)
- 9.6 Rest of World (ROW) – Market size and forecast 2022-2027
- Exhibit 85: Chart on Rest of World (ROW) – Market size and forecast 2022-2027 ($ billion)
- Exhibit 86: Data Table on Rest of World (ROW) – Market size and forecast 2022-2027 ($ billion)
- Exhibit 87: Chart on Rest of World (ROW) – Year-over-year growth 2022-2027 (%)
- Exhibit 88: Data Table on Rest of World (ROW) – Year-over-year growth 2022-2027 (%)
- 9.7 US – Market size and forecast 2022-2027
- Exhibit 89: Chart on US – Market size and forecast 2022-2027 ($ billion)
- Exhibit 90: Data Table on US – Market size and forecast 2022-2027 ($ billion)
- Exhibit 91: Chart on US – Year-over-year growth 2022-2027 (%)
- Exhibit 92: Data Table on US – Year-over-year growth 2022-2027 (%)
- 9.8 Germany – Market size and forecast 2022-2027
- Exhibit 93: Chart on Germany – Market size and forecast 2022-2027 ($ billion)
- Exhibit 94: Data Table on Germany – Market size and forecast 2022-2027 ($ billion)
- Exhibit 95: Chart on Germany – Year-over-year growth 2022-2027 (%)
- Exhibit 96: Data Table on Germany – Year-over-year growth 2022-2027 (%)
- 9.9 UK – Market size and forecast 2022-2027
- Exhibit 97: Chart on UK – Market size and forecast 2022-2027 ($ billion)
- Exhibit 98: Data Table on UK – Market size and forecast 2022-2027 ($ billion)
- Exhibit 99: Chart on UK – Year-over-year growth 2022-2027 (%)
- Exhibit 100: Data Table on UK – Year-over-year growth 2022-2027 (%)
- 9.10 France – Market size and forecast 2022-2027
- Exhibit 101: Chart on France – Market size and forecast 2022-2027 ($ billion)
- Exhibit 102: Data Table on France – Market size and forecast 2022-2027 ($ billion)
- Exhibit 103: Chart on France – Year-over-year growth 2022-2027 (%)
- Exhibit 104: Data Table on France – Year-over-year growth 2022-2027 (%)
- 9.11 Japan – Market size and forecast 2022-2027
- Exhibit 105: Chart on Japan – Market size and forecast 2022-2027 ($ billion)
- Exhibit 106: Data Table on Japan – Market size and forecast 2022-2027 ($ billion)
- Exhibit 107: Chart on Japan – Year-over-year growth 2022-2027 (%)
- Exhibit 108: Data Table on Japan – Year-over-year growth 2022-2027 (%)
- 9.12 Market opportunity by geography
- Exhibit 109: Market opportunity by geography ($ billion)
10 Drivers, Challenges, and Trends
- 10.3 Impact of drivers and challenges
- Exhibit 110: Impact of drivers and challenges in 2022 and 2027
11 Vendor Landscape
- 11.2 Vendor landscape
- Exhibit 111: Overview on Criticality of inputs and Factors of differentiation
- 11.3 Landscape disruption
- Exhibit 112: Overview on factors of disruption
- 11.4 Industry risks
- Exhibit 113: Impact of key risks on business
12 Vendor Analysis
- 12.1 Vendors covered
- Exhibit 114: Vendors covered
- 12.2 Market positioning of vendors
- Exhibit 115: Matrix on vendor position and classification
- 12.3 AbbVie Inc.
- Exhibit 116: AbbVie Inc. – Overview
- Exhibit 117: AbbVie Inc. – Product / Service
- Exhibit 118: AbbVie Inc. – Key news
- Exhibit 119: AbbVie Inc. – Key offerings
- 12.4 Aldeyra Therapeutics Inc.
- Exhibit 120: Aldeyra Therapeutics Inc. – Overview
- Exhibit 121: Aldeyra Therapeutics Inc. – Product / Service
- Exhibit 122: Aldeyra Therapeutics Inc. – Key offerings
- 12.5 Bausch Health Co Inc.
- Exhibit 123: Bausch Health Co Inc. – Overview
- Exhibit 124: Bausch Health Co Inc. – Business segments
- Exhibit 125: Bausch Health Co Inc. – Key news
- Exhibit 126: Bausch Health Co Inc. – Key offerings
- Exhibit 127: Bausch Health Co Inc. – Segment focus
- 12.6 Bayer AG
- Exhibit 128: Bayer AG – Overview
- Exhibit 129: Bayer AG – Business segments
- Exhibit 130: Bayer AG – Key news
- Exhibit 131: Bayer AG – Key offerings
- Exhibit 132: Bayer AG – Segment focus
- 12.7 F. Hoffmann La Roche Ltd.
- Exhibit 133: F. Hoffmann La Roche Ltd. – Overview
- Exhibit 134: F. Hoffmann La Roche Ltd. – Business segments
- Exhibit 135: F. Hoffmann La Roche Ltd. – Key news
- Exhibit 136: F. Hoffmann La Roche Ltd. – Key offerings
- Exhibit 137: F. Hoffmann La Roche Ltd. – Segment focus
- 12.8 Novartis AG
- Exhibit 138: Novartis AG – Overview
- Exhibit 139: Novartis AG – Business segments
- Exhibit 140: Novartis AG – Key offerings
- Exhibit 141: Novartis AG – Segment focus
- 12.9 Ocular Therapeutix Inc.
- Exhibit 142: Ocular Therapeutix Inc. – Overview
- Exhibit 143: Ocular Therapeutix Inc. – Product / Service
- Exhibit 144: Ocular Therapeutix Inc. – Key offerings
- 12.10 Otsuka Pharmaceutical Co. Ltd.
- Exhibit 145: Otsuka Pharmaceutical Co. Ltd. – Overview
- Exhibit 146: Otsuka Pharmaceutical Co. Ltd. – Product / Service
- Exhibit 147: Otsuka Pharmaceutical Co. Ltd. – Key offerings
- 12.11 Oxurion NV
- Exhibit 148: Oxurion NV – Overview
- Exhibit 149: Oxurion NV – Product / Service
- Exhibit 150: Oxurion NV – Key offerings
- 12.12 Pfizer Inc.
- Exhibit 151: Pfizer Inc. – Overview
- Exhibit 152: Pfizer Inc. – Product / Service
- Exhibit 153: Pfizer Inc. – Key news
- Exhibit 154: Pfizer Inc. – Key offerings
- 12.13 Regeneron Pharmaceuticals Inc.
- Exhibit 155: Regeneron Pharmaceuticals Inc. – Overview
- Exhibit 156: Regeneron Pharmaceuticals Inc. – Product / Service
- Exhibit 157: Regeneron Pharmaceuticals Inc. – Key offerings
- 12.14 Santen Pharmaceutical Co. Ltd.
- Exhibit 158: Santen Pharmaceutical Co. Ltd. – Overview
- Exhibit 159: Santen Pharmaceutical Co. Ltd. – Product / Service
- Exhibit 160: Santen Pharmaceutical Co. Ltd. – Key offerings
- 12.15 Sun Pharmaceutical Industries Ltd.
- Exhibit 161: Sun Pharmaceutical Industries Ltd. – Overview
- Exhibit 162: Sun Pharmaceutical Industries Ltd. – Product / Service
- Exhibit 163: Sun Pharmaceutical Industries Ltd. – Key offerings
- 12.16 Teva Pharmaceutical Industries Ltd.
- Exhibit 164: Teva Pharmaceutical Industries Ltd. – Overview
- Exhibit 165: Teva Pharmaceutical Industries Ltd. – Business segments
- Exhibit 166: Teva Pharmaceutical Industries Ltd. – Key news
- Exhibit 167: Teva Pharmaceutical Industries Ltd. – Key offerings
- Exhibit 168: Teva Pharmaceutical Industries Ltd. – Segment focus
- 12.17 Visufarma
- Exhibit 169: Visufarma – Overview
- Exhibit 170: Visufarma – Product / Service
- Exhibit 171: Visufarma – Key offerings
13 Appendix
- 13.2 Inclusions and exclusions checklist
- Exhibit 172: Inclusions checklist
- Exhibit 173: Exclusions checklist
- 13.3 Currency conversion rates for US$
- Exhibit 174: Currency conversion rates for US$
- 13.4 Research methodology
- Exhibit 175: Research methodology
- Exhibit 176: Validation techniques employed for market sizing
- Exhibit 177: Information sources
- 13.5 List of abbreviations
- Exhibit 178: List of abbreviations
About Us
Technavio is a leading global technology research and advisory company. Their research and analysis focus on emerging market trends and provide actionable insights to help businesses identify market opportunities and develop effective strategies to optimize their market positions. With over 500 specialized analysts, Technavio’s report library consists of more than 17,000 reports and counting, covering 800 technologies, spanning 50 countries. Their client base consists of enterprises of all sizes, including more than 100 Fortune 500 companies. This growing client base relies on Technavio’s comprehensive coverage, extensive research, and actionable market insights to identify opportunities in existing and potential markets and assess their competitive positions within changing market scenarios.
Contact
Technavio Research
Jesse Maida
Media & Marketing Executive
US: +1 844 364 1100
UK: +44 203 893 3200
Email: [email protected]
Website: www.technavio.com
SOURCE Technavio
