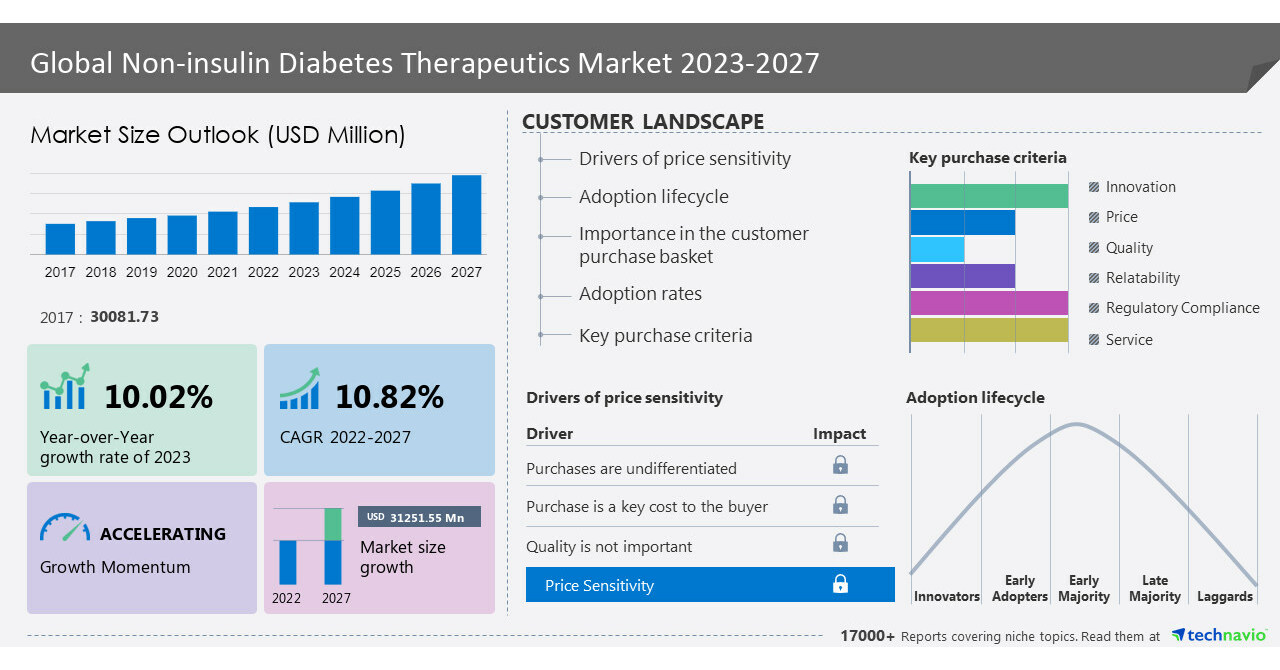
NEW YORK, June 21, 2023 /PRNewswire/ — The global non-insulin diabetes therapeutics market size is estimated to grow by USD 31,251.55 million from 2022 to 2027. The market is estimated to grow at a CAGR of 10.82%. However, the growth momentum will progress during the forecast period. North America held the largest share of the global market in 2022, and the market in the region is estimated to witness an incremental growth of 39%. Several vendors offer non-insulin diabetes therapeutics in North America, which is increasing awareness and the availability of non-insulin diabetes therapeutics in the region. Vendors are focusing on product development and clinical trials. Hence, the availability of advanced therapeutics and delivery techniques is improving in the region. For more insights on the historic period (2017 to 2021) and forecast market size (2023 to 2027) – Request a sample report
What’s New?
- Special coverage on the Russia–Ukraine war; global inflation; recovery analysis from COVID-19; supply chain disruptions, global trade tensions; and risk of recession
- Global competitiveness and key competitor positions
- Market presence across multiple geographical footprints – Strong/Active/Niche/Trivial – buy the report!
Non-insulin Diabetes Therapeutics Market – Segmentation Assessment
Segment Overview
Technavio has segmented the market based on Type (DPP4 inhibitors, GLP-1 receptor agonists, SGLT2 inhibitors, and Others), Distribution Channel (Offline and Online), and Geography (North America, Europe, Asia, and Rest of World (ROW)).
- The DPP4 inhibitors segment will be significant during the forecast period as they are therapeutics that reduce high blood glucose levels and are widely used to treat type 2 diabetes. DPP4 inhibitors improve blood glucose control and reduce fasting and postprandial blood glucose levels without causing weight gain. The changes of hypoglycemia are low when using DPP4 inhibitors unless they are combined with other therapies that cause hypoglycemia.
Insights on the market contribution of various segments including country and region wise, historic (2017 to 2021) and forecast market size (2023 to 2027) – Download a Sample Report
Non-insulin Diabetes Therapeutics Market – Market Dynamics
Key factor driving market growth
- The increasing number of people with type 2 diabetes is the key factor driving the growth of the global non-insulin diabetes therapeutics market. The early diagnosis of type 2 diabetes is often a challenge due to the generic symptoms associated with the disease. Hence, once the disease is diagnosed, it is essential to provide advanced medications. Different antihyperglycemic drugs are used alone or in combination with other drugs, such as insulin, to treat type 2 diabetes. The initial steps of treatment include weight loss plans, lifestyle changes, and the administration of metformin. The ADA and the European Association for the Study of Diabetes (EASD) recommend a patient-specific treatment approach to enhance glycemic control to treat type 2 diabetes. This is to avoid weight gain and hypoglycemia. Hence, the increasing number of people with type 2 diabetes will drive the growth of the global non-insulin diabetes therapeutics market during the forecast period.
Leading trends influencing the market
- Innovation in therapies is the primary trend in the global non-insulin diabetes therapeutics market. Several vendors are introducing advanced therapies to treat diabetes. Incretins are GLP-1 and Glucose-dependent Insulinotropic Polypeptides (GIP), which are secreted by the GI tract in response to food intake. The benefits of incretin hormones on glycemic control include enhanced satiety, decreased GI motility, increased glucose-dependent insulin secretion, reduced glucagon secretion, and decreased hepatic glucose release. Two incretin-based drug classes are used to treat people with type 2 diabetes. These include oral DPP4 inhibitors and GLP-1 receptor agonists. Drugs with unique and complementary MoA are required to treat people with type 2 diabetes. Therapeutics such as DPP4 inhibitors, GLP-1 receptor agonists, SGLT2 inhibitors, colesevelam, and bromocriptine QR provide therapeutic options with novel MoA. They also prevent weight gain and reduce the risk of hypoglycemia
Major challenges hindering the market growth
- Safety concerns are hindering the growth of the global non-insulin diabetes therapeutics market. Several non-insulin diabetes drugs are currently under review by the US FDA due to safety concerns. For example, in 2017, the US Food and Drug Administration added a boxed warning to the label of Janssen type 2 diabetes medication because it increases the risk of leg and foot amputations. Such initiatives are increasing awareness about the safety of certain drugs. However, they are a challenge for the growth of the non-insulin diabetes therapeutics market as vendors must make significant investments in R&D to develop safe drugs
Insights on Market Drivers, trends, & Challenges, historic period(2017 to 2021) and forecast period(2023 to 2027)- Request a sample report!
What are the key data covered in this Non-insulin Diabetes Therapeutics Market report?
- CAGR of the market during the forecast period
- Detailed information on factors that will drive the growth of the Non-insulin Diabetes Therapeutics Market between 2023 and 2027
- Precise estimation of the size of the Non-insulin Diabetes Therapeutics Market size and its contribution to the market in focus on the parent market
- Accurate predictions about upcoming trends and changes in consumer behavior
- Growth of the Non-insulin Diabetes Therapeutics Market industry across North America, Europe, Asia, and Rest of World (ROW)
- A thorough analysis of the market’s competitive landscape and detailed information about vendors
- Comprehensive analysis of factors that will challenge the growth of Non-insulin Diabetes Therapeutics Market vendors
Gain instant access to 17,000+ market research reports.
Technavio’s SUBSCRIPTION platform
Related Reports:
The type 2 diabetes market size is estimated to grow at a CAGR of 10.94% and the size of the market is forecast to increase by USD 39.37 billion between 2022 and 2027. This market report extensively covers market segmentation by drug class (insulin, dpp-4 inhibitor, glp-1 receptor agonists, sglt-2 inhibitors, and others), distribution channel (retail pharmacies, hospital pharmacies, and online pharmacies), and geography (North America, Europe, Asia, and Rest of World (ROW). The increase in the number of people with diabetes all around the world is the major driver of market growth.
The diabetes management devices market size is estimated to grow at a CAGR of 8.18% between 2022 and 2027. The market size is forecast to increase by USD 10.9 billion. This diabetes management devices market report extensively covers market segmentation by product type (blood glucose monitoring devices and insulin delivery systems), distribution channel (offline and online), and geography (North America, Europe, Asia, and Rest of World (ROW)). The rising global burden of diabetes is notably driving the diabetes management devices market growth.
|
Non-insulin Diabetes Therapeutics Market Scope |
|
|
Report Coverage |
Details |
|
Base year |
2022 |
|
Historic period |
2017-2021 |
|
Forecast period |
2023-2027 |
|
Growth momentum & CAGR |
Accelerate at a CAGR of 10.82% |
|
Market growth 2023-2027 |
USD 31,251.55 million |
|
Market structure |
Fragmented |
|
YoY growth 2022-2023 (%) |
10.02 |
|
Regional analysis |
North America, Europe, Asia, and Rest of World (ROW) |
|
Performing market contribution |
North America at 39% |
|
Key countries |
US, Germany, UK, China, and India |
|
Competitive landscape |
Leading Vendors, Market Positioning of Vendors, Competitive Strategies, and Industry Risks |
|
Key companies profiled |
Abbott Laboratories, AstraZeneca PLC, Better Therapeutics Inc., Boehringer Ingelheim International GmbH, Eli Lilly and Co., F. Hoffmann La Roche Ltd., GlaxoSmithKline Plc, Johnson and Johnson Services Inc., Merck KGaA, Novartis AG, Novo Nordisk AS, Pfizer Inc., Sanofi SA, Takeda Pharmaceutical Co. Ltd., and The Cleveland Clinic Foundation |
|
Market dynamics |
Parent market analysis, Market growth inducers and obstacles, Fast-growing and slow-growing segment analysis, COVID-19 impact and recovery analysis and future consumer dynamics, Market condition analysis for forecast period. |
|
Customization purview |
If our report has not included the data that you are looking for, you can reach out to our analysts and get segments customized. |
Table of Contents
1 Executive Summary
- 1.1 Market overview
- Exhibit 01: Executive Summary – Chart on Market Overview
- Exhibit 02: Executive Summary – Data Table on Market Overview
- Exhibit 03: Executive Summary – Chart on Global Market Characteristics
- Exhibit 04: Executive Summary – Chart on Market by Geography
- Exhibit 05: Executive Summary – Chart on Market Segmentation by Type
- Exhibit 06: Executive Summary – Chart on Market Segmentation by Distribution Channel
- Exhibit 07: Executive Summary – Chart on Incremental Growth
- Exhibit 08: Executive Summary – Data Table on Incremental Growth
- Exhibit 09: Executive Summary – Chart on Vendor Market Positioning
2 Market Landscape
- 2.1 Market ecosystem
- Exhibit 10: Parent market
- Exhibit 11: Market Characteristics
3 Market Sizing
- 3.1 Market definition
- Exhibit 12: Offerings of vendors included in the market definition
- 3.2 Market segment analysis
- Exhibit 13: Market segments
- 3.4 Market outlook: Forecast for 2022-2027
- Exhibit 14: Chart on Global – Market size and forecast 2022-2027 ($ million)
- Exhibit 15: Data Table on Global – Market size and forecast 2022-2027 ($ million)
- Exhibit 16: Chart on Global Market: Year-over-year growth 2022-2027 (%)
- Exhibit 17: Data Table on Global Market: Year-over-year growth 2022-2027 (%)
4 Historic Market Size
- 4.1 Global non-insulin diabetes therapeutics market 2017 – 2021
- Exhibit 18: Historic Market Size – Data Table on global non-insulin diabetes therapeutics market 2017 – 2021 ($ million)
- 4.2 Type Segment Analysis 2017 – 2021
- Exhibit 19: Historic Market Size – Type Segment 2017 – 2021 ($ million)
- 4.3 Distribution Channel Segment Analysis 2017 – 2021
- Exhibit 20: Historic Market Size – Distribution Channel Segment 2017 – 2021 ($ million)
- 4.4 Geography Segment Analysis 2017 – 2021
- Exhibit 21: Historic Market Size – Geography Segment 2017 – 2021 ($ million)
- 4.5 Country Segment Analysis 2017 – 2021
- Exhibit 22: Historic Market Size – Country Segment 2017 – 2021 ($ million)
5 Five Forces Analysis
- 5.1 Five forces summary
- Exhibit 23: Five forces analysis – Comparison between 2022 and 2027
- 5.2 Bargaining power of buyers
- Exhibit 24: Chart on Bargaining power of buyers – Impact of key factors 2022 and 2027
- 5.3 Bargaining power of suppliers
- Exhibit 25: Bargaining power of suppliers – Impact of key factors in 2022 and 2027
- 5.4 Threat of new entrants
- Exhibit 26: Threat of new entrants – Impact of key factors in 2022 and 2027
- 5.5 Threat of substitutes
- Exhibit 27: Threat of substitutes – Impact of key factors in 2022 and 2027
- 5.6 Threat of rivalry
- Exhibit 28: Threat of rivalry – Impact of key factors in 2022 and 2027
- 5.7 Market condition
- Exhibit 29: Chart on Market condition – Five forces 2022 and 2027
6 Market Segmentation by Type
- 6.1 Market segments
- Exhibit 30: Chart on Type – Market share 2022-2027 (%)
- Exhibit 31: Data Table on Type – Market share 2022-2027 (%)
- 6.2 Comparison by Type
- Exhibit 32: Chart on Comparison by Type
- Exhibit 33: Data Table on Comparison by Type
- 6.3 DPP4 inhibitors – Market size and forecast 2022-2027
- Exhibit 34: Chart on DPP4 inhibitors – Market size and forecast 2022-2027 ($ million)
- Exhibit 35: Data Table on DPP4 inhibitors – Market size and forecast 2022-2027 ($ million)
- Exhibit 36: Chart on DPP4 inhibitors – Year-over-year growth 2022-2027 (%)
- Exhibit 37: Data Table on DPP4 inhibitors – Year-over-year growth 2022-2027 (%)
- 6.4 GLP-1 receptor agonists – Market size and forecast 2022-2027
- Exhibit 38: Chart on GLP-1 receptor agonists – Market size and forecast 2022-2027 ($ million)
- Exhibit 39: Data Table on GLP-1 receptor agonists – Market size and forecast 2022-2027 ($ million)
- Exhibit 40: Chart on GLP-1 receptor agonists – Year-over-year growth 2022-2027 (%)
- Exhibit 41: Data Table on GLP-1 receptor agonists – Year-over-year growth 2022-2027 (%)
- 6.5 SGLT2 inhibitors – Market size and forecast 2022-2027
- Exhibit 42: Chart on SGLT2 inhibitors – Market size and forecast 2022-2027 ($ million)
- Exhibit 43: Data Table on SGLT2 inhibitors – Market size and forecast 2022-2027 ($ million)
- Exhibit 44: Chart on SGLT2 inhibitors – Year-over-year growth 2022-2027 (%)
- Exhibit 45: Data Table on SGLT2 inhibitors – Year-over-year growth 2022-2027 (%)
- 6.6 Others – Market size and forecast 2022-2027
- Exhibit 46: Chart on Others – Market size and forecast 2022-2027 ($ million)
- Exhibit 47: Data Table on Others – Market size and forecast 2022-2027 ($ million)
- Exhibit 48: Chart on Others – Year-over-year growth 2022-2027 (%)
- Exhibit 49: Data Table on Others – Year-over-year growth 2022-2027 (%)
- 6.7 Market opportunity by Type
- Exhibit 50: Market opportunity by Type ($ million)
- Exhibit 51: Data Table on Market opportunity by Type ($ million)
7 Market Segmentation by Distribution Channel
- 7.1 Market segments
- Exhibit 52: Chart on Distribution Channel – Market share 2022-2027 (%)
- Exhibit 53: Data Table on Distribution Channel – Market share 2022-2027 (%)
- 7.2 Comparison by Distribution Channel
- Exhibit 54: Chart on Comparison by Distribution Channel
- Exhibit 55: Data Table on Comparison by Distribution Channel
- 7.3 Offline – Market size and forecast 2022-2027
- Exhibit 56: Chart on Offline – Market size and forecast 2022-2027 ($ million)
- Exhibit 57: Data Table on Offline – Market size and forecast 2022-2027 ($ million)
- Exhibit 58: Chart on Offline – Year-over-year growth 2022-2027 (%)
- Exhibit 59: Data Table on Offline – Year-over-year growth 2022-2027 (%)
- 7.4 Online – Market size and forecast 2022-2027
- Exhibit 60: Chart on Online – Market size and forecast 2022-2027 ($ million)
- Exhibit 61: Data Table on Online – Market size and forecast 2022-2027 ($ million)
- Exhibit 62: Chart on Online – Year-over-year growth 2022-2027 (%)
- Exhibit 63: Data Table on Online – Year-over-year growth 2022-2027 (%)
- 7.5 Market opportunity by Distribution Channel
- Exhibit 64: Market opportunity by Distribution Channel ($ million)
- Exhibit 65: Data Table on Market opportunity by Distribution Channel ($ million)
8 Customer Landscape
- 8.1 Customer landscape overview
- Exhibit 66: Analysis of price sensitivity, lifecycle, customer purchase basket, adoption rates, and purchase criteria
9 Geographic Landscape
- 9.1 Geographic segmentation
- Exhibit 67: Chart on Market share by geography 2022-2027 (%)
- Exhibit 68: Data Table on Market share by geography 2022-2027 (%)
- 9.2 Geographic comparison
- Exhibit 69: Chart on Geographic comparison
- Exhibit 70: Data Table on Geographic comparison
- 9.3 North America – Market size and forecast 2022-2027
- Exhibit 71: Chart on North America – Market size and forecast 2022-2027 ($ million)
- Exhibit 72: Data Table on North America – Market size and forecast 2022-2027 ($ million)
- Exhibit 73: Chart on North America – Year-over-year growth 2022-2027 (%)
- Exhibit 74: Data Table on North America – Year-over-year growth 2022-2027 (%)
- 9.4 Europe – Market size and forecast 2022-2027
- Exhibit 75: Chart on Europe – Market size and forecast 2022-2027 ($ million)
- Exhibit 76: Data Table on Europe – Market size and forecast 2022-2027 ($ million)
- Exhibit 77: Chart on Europe – Year-over-year growth 2022-2027 (%)
- Exhibit 78: Data Table on Europe – Year-over-year growth 2022-2027 (%)
- 9.5 Asia – Market size and forecast 2022-2027
- Exhibit 79: Chart on Asia – Market size and forecast 2022-2027 ($ million)
- Exhibit 80: Data Table on Asia – Market size and forecast 2022-2027 ($ million)
- Exhibit 81: Chart on Asia – Year-over-year growth 2022-2027 (%)
- Exhibit 82: Data Table on Asia – Year-over-year growth 2022-2027 (%)
- 9.6 Rest of World (ROW) – Market size and forecast 2022-2027
- Exhibit 83: Chart on Rest of World (ROW) – Market size and forecast 2022-2027 ($ million)
- Exhibit 84: Data Table on Rest of World (ROW) – Market size and forecast 2022-2027 ($ million)
- Exhibit 85: Chart on Rest of World (ROW) – Year-over-year growth 2022-2027 (%)
- Exhibit 86: Data Table on Rest of World (ROW) – Year-over-year growth 2022-2027 (%)
- 9.7 US – Market size and forecast 2022-2027
- Exhibit 87: Chart on US – Market size and forecast 2022-2027 ($ million)
- Exhibit 88: Data Table on US – Market size and forecast 2022-2027 ($ million)
- Exhibit 89: Chart on US – Year-over-year growth 2022-2027 (%)
- Exhibit 90: Data Table on US – Year-over-year growth 2022-2027 (%)
- 9.8 Germany – Market size and forecast 2022-2027
- Exhibit 91: Chart on Germany – Market size and forecast 2022-2027 ($ million)
- Exhibit 92: Data Table on Germany – Market size and forecast 2022-2027 ($ million)
- Exhibit 93: Chart on Germany – Year-over-year growth 2022-2027 (%)
- Exhibit 94: Data Table on Germany – Year-over-year growth 2022-2027 (%)
- 9.9 China – Market size and forecast 2022-2027
- Exhibit 95: Chart on China – Market size and forecast 2022-2027 ($ million)
- Exhibit 96: Data Table on China – Market size and forecast 2022-2027 ($ million)
- Exhibit 97: Chart on China – Year-over-year growth 2022-2027 (%)
- Exhibit 98: Data Table on China – Year-over-year growth 2022-2027 (%)
- 9.10 UK – Market size and forecast 2022-2027
- Exhibit 99: Chart on UK – Market size and forecast 2022-2027 ($ million)
- Exhibit 100: Data Table on UK – Market size and forecast 2022-2027 ($ million)
- Exhibit 101: Chart on UK – Year-over-year growth 2022-2027 (%)
- Exhibit 102: Data Table on UK – Year-over-year growth 2022-2027 (%)
- 9.11 India – Market size and forecast 2022-2027
- Exhibit 103: Chart on India – Market size and forecast 2022-2027 ($ million)
- Exhibit 104: Data Table on India – Market size and forecast 2022-2027 ($ million)
- Exhibit 105: Chart on India – Year-over-year growth 2022-2027 (%)
- Exhibit 106: Data Table on India – Year-over-year growth 2022-2027 (%)
- 9.12 Market opportunity by geography
- Exhibit 107: Market opportunity by geography ($ million)
- Exhibit 108: Data Tables on Market opportunity by geography ($ million)
10 Drivers, Challenges, and Trends
- 10.3 Impact of drivers and challenges
- Exhibit 109: Impact of drivers and challenges in 2022 and 2027
11 Vendor Landscape
- 11.2 Vendor landscape
- Exhibit 110: Overview on Criticality of inputs and Factors of differentiation
- 11.3 Landscape disruption
- Exhibit 111: Overview on factors of disruption
- 11.4 Industry risks
- Exhibit 112: Impact of key risks on business
12 Vendor Analysis
- 12.1 Vendors covered
- Exhibit 113: Vendors covered
- 12.2 Market positioning of vendors
- Exhibit 114: Matrix on vendor position and classification
- 12.3 Abbott Laboratories
- Exhibit 115: Abbott Laboratories – Overview
- Exhibit 116: Abbott Laboratories – Business segments
- Exhibit 117: Abbott Laboratories – Key news
- Exhibit 118: Abbott Laboratories – Key offerings
- Exhibit 119: Abbott Laboratories – Segment focus
- 12.4 AstraZeneca PLC
- Exhibit 120: AstraZeneca PLC – Overview
- Exhibit 121: AstraZeneca PLC – Product / Service
- Exhibit 122: AstraZeneca PLC – Key news
- Exhibit 123: AstraZeneca PLC – Key offerings
- 12.5 Better Therapeutics Inc.
- Exhibit 124: Better Therapeutics Inc. – Overview
- Exhibit 125: Better Therapeutics Inc. – Product / Service
- Exhibit 126: Better Therapeutics Inc. – Key news
- Exhibit 127: Better Therapeutics Inc. – Key offerings
- 12.6 Boehringer Ingelheim International GmbH
- Exhibit 128: Boehringer Ingelheim International GmbH – Overview
- Exhibit 129: Boehringer Ingelheim International GmbH – Business segments
- Exhibit 130: Boehringer Ingelheim International GmbH – Key news
- Exhibit 131: Boehringer Ingelheim International GmbH – Key offerings
- Exhibit 132: Boehringer Ingelheim International GmbH – Segment focus
- 12.7 Eli Lilly and Co.
- Exhibit 133: Eli Lilly and Co. – Overview
- Exhibit 134: Eli Lilly and Co. – Product / Service
- Exhibit 135: Eli Lilly and Co. – Key news
- Exhibit 136: Eli Lilly and Co. – Key offerings
- 12.8 F. Hoffmann La Roche Ltd.
- Exhibit 137: F. Hoffmann La Roche Ltd. – Overview
- Exhibit 138: F. Hoffmann La Roche Ltd. – Business segments
- Exhibit 139: F. Hoffmann La Roche Ltd. – Key news
- Exhibit 140: F. Hoffmann La Roche Ltd. – Key offerings
- Exhibit 141: F. Hoffmann La Roche Ltd. – Segment focus
- 12.9 GlaxoSmithKline Plc
- Exhibit 142: GlaxoSmithKline Plc – Overview
- Exhibit 143: GlaxoSmithKline Plc – Business segments
- Exhibit 144: GlaxoSmithKline Plc – Key news
- Exhibit 145: GlaxoSmithKline Plc – Key offerings
- Exhibit 146: GlaxoSmithKline Plc – Segment focus
- 12.10 Johnson and Johnson Services Inc.
- Exhibit 147: Johnson and Johnson Services Inc. – Overview
- Exhibit 148: Johnson and Johnson Services Inc. – Business segments
- Exhibit 149: Johnson and Johnson Services Inc. – Key news
- Exhibit 150: Johnson and Johnson Services Inc. – Key offerings
- Exhibit 151: Johnson and Johnson Services Inc. – Segment focus
- 12.11 Merck KGaA
- Exhibit 152: Merck KGaA – Overview
- Exhibit 153: Merck KGaA – Business segments
- Exhibit 154: Merck KGaA – Key news
- Exhibit 155: Merck KGaA – Key offerings
- Exhibit 156: Merck KGaA – Segment focus
- 12.12 Novartis AG
- Exhibit 157: Novartis AG – Overview
- Exhibit 158: Novartis AG – Business segments
- Exhibit 159: Novartis AG – Key offerings
- Exhibit 160: Novartis AG – Segment focus
- 12.13 Novo Nordisk AS
- Exhibit 161: Novo Nordisk AS – Overview
- Exhibit 162: Novo Nordisk AS – Business segments
- Exhibit 163: Novo Nordisk AS – Key offerings
- Exhibit 164: Novo Nordisk AS – Segment focus
- 12.14 Pfizer Inc.
- Exhibit 165: Pfizer Inc. – Overview
- Exhibit 166: Pfizer Inc. – Product / Service
- Exhibit 167: Pfizer Inc. – Key news
- Exhibit 168: Pfizer Inc. – Key offerings
- 12.15 Sanofi SA
- Exhibit 169: Sanofi SA – Overview
- Exhibit 170: Sanofi SA – Business segments
- Exhibit 171: Sanofi SA – Key news
- Exhibit 172: Sanofi SA – Key offerings
- Exhibit 173: Sanofi SA – Segment focus
- 12.16 Takeda Pharmaceutical Co. Ltd.
- Exhibit 174: Takeda Pharmaceutical Co. Ltd. – Overview
- Exhibit 175: Takeda Pharmaceutical Co. Ltd. – Product / Service
- Exhibit 176: Takeda Pharmaceutical Co. Ltd. – Key news
- Exhibit 177: Takeda Pharmaceutical Co. Ltd. – Key offerings
- 12.17 The Cleveland Clinic Foundation
- Exhibit 178: The Cleveland Clinic Foundation – Overview
- Exhibit 179: The Cleveland Clinic Foundation – Product / Service
- Exhibit 180: The Cleveland Clinic Foundation – Key offerings
13 Appendix
- 13.1 Scope of the report
- 13.2 Inclusions and exclusions checklist
- Exhibit 181: Inclusions checklist
- Exhibit 182: Exclusions checklist
- 13.3 Currency conversion rates for US$
- Exhibit 183: Currency conversion rates for US$
- 13.4 Research methodology
- Exhibit 184: Research methodology
- Exhibit 185: Validation techniques employed for market sizing
- Exhibit 186: Information sources
- 13.5 List of abbreviations
- Exhibit 187: List of abbreviations
About Us
Technavio is a leading global technology research and advisory company. Their research and analysis focuses on emerging market trends and provides actionable insights to help businesses identify market opportunities and develop effective strategies to optimize their market positions. With over 500 specialized analysts, Technavio’s report library consists of more than 17,000 reports and counting, covering 800 technologies, spanning across 50 countries. Their client base consists of enterprises of all sizes, including more than 100 Fortune 500 companies. This growing client base relies on Technavio’s comprehensive coverage, extensive research, and actionable market insights to identify opportunities in existing and potential markets and assess their competitive positions within changing market scenarios.
Contact
Technavio Research
Jesse Maida
Media & Marketing Executive
US: +1 844 364 1100
UK: +44 203 893 3200
Email: [email protected]
Website: www.technavio.com
SOURCE Technavio
