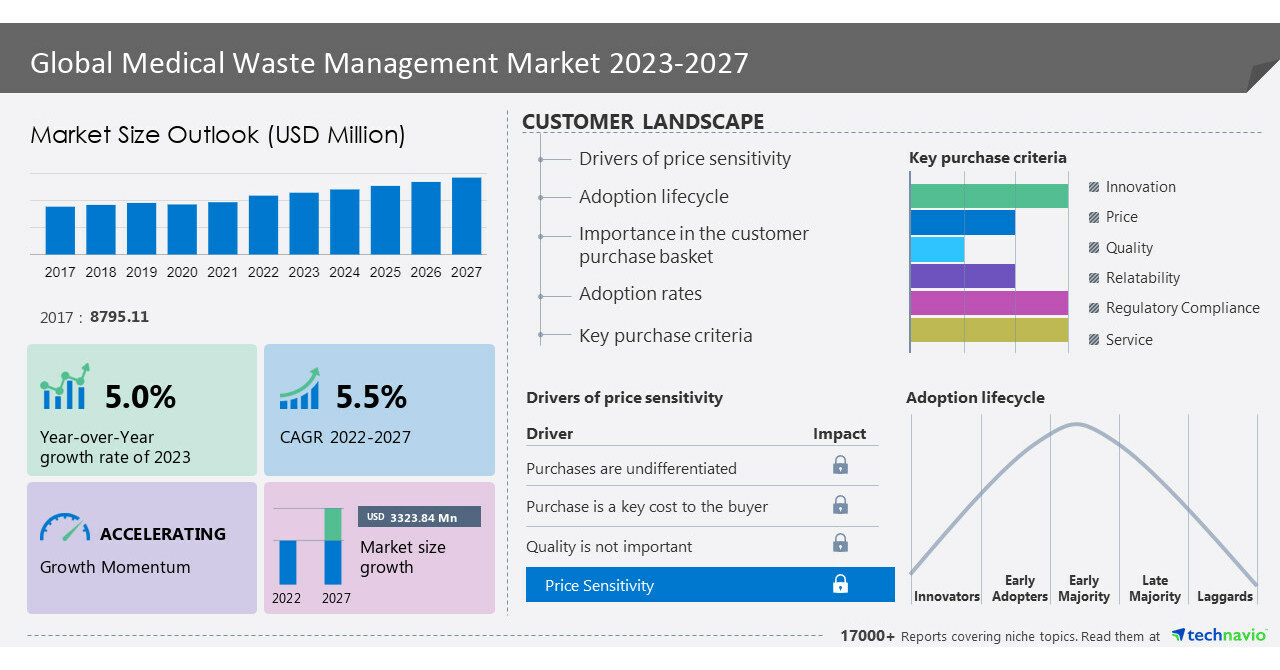
NEW YORK, May 31, 2023 /PRNewswire/ — The global medical waste disposal market size is estimated to grow by USD 3,323.84 million from 2022 to 2027, according to Technavio. The market is estimated to grow at a CAGR of 5.5% , however, the growth momentum will progress during the forecast period. North America is estimated to account for 36% of the global market growth during the forecast period. Medical waste management is mandatory in the region because medical waste can contain infectious agents such as bacteria, viruses, and other harmful substances that can cause serious illness. Moreover, medical waste can be harmful to the environment if not disposed of properly. To protect public health and safety, comply with regulatory requirements, and fulfill legal and ethical obligations. Hence, the adoption of medical waste management is increasing in North America, which is expected to positively impact the growth of the regional market in focus during the forecast period. For more insights on the historic period (2017 to 2021) and forecast market size (2023 to 2027) – Request a sample report
What’s New?
- Special coverage on the Russia–Ukraine war; global inflation; recovery analysis from COVID-19; supply chain disruptions, global trade tensions; and risk of recession
- Global competitiveness and key competitor positions
- Market presence across multiple geographical footprints – Strong/Active/Niche/Trivial – buy the report!
Medical Waste Disposal Market – Segmentation Assessment
Segment Overview
Technavio has segmented the market based on type (non-hazardous and hazardous), technique (offsite treatment and onsite treatment), and geography (North America, Europe, APAC, South America, and Middle East and Africa).
- The market share growth by the non-hazardous segment will be significant for the market’s growth during the forecast period. This segment includes plastic packaging, clean glass and plastic, paper and cardboard, and office products. To reduce the risk of human infection, it is necessary to properly dispose of medical waste, and the demand for medical waste disposal is increasing. Furthermore, the rising number of hospitals in developing countries is one of the major factors for the growth of the medical waste treatment market. Hence, such factors drive segment growth during the forecast period.
Insights on the market contribution of various segments including country and region wise, historic (2017 to 2021) and forecast market size (2023 to 2027) – Download a Sample Report
Medical Waste Disposal Market – Market Dynamics
Key factor driving market growth
Leading trends influencing the market
The adoption of sustainable and eco-friendly solutions is an emerging trend in the global medical waste disposal market. Adopting sustainable and eco-friendly solutions for medical waste requires a comprehensive approach that involves all stakeholders, including healthcare facilities, recycling companies, and hazardous waste disposal companies.
Various medical devices and equipment can be recycled such as metal utensils, glass syringes, and plastic containers. To address this issue, hospitals and clinics work with recycling companies to properly dispose of these items and reduce the amount of waste that goes to landfills. Hence, such factors boost market growth during the forecast period.
Major challenges hindering the market growth
A major challenge for medical waste management is a lack of infrastructure, including proper waste collection, transportation, and disposal facilities. The costs associated with environmental and health problems resulting from poor waste management practices can be significant.
This results in waste being improperly disposed of or ending up in uncontrolled dumps, and limited treatment, and disposal options, leading to environmental contamination and health hazards. Hence, the lack of proper infrastructure is expected to be a major challenge for the medical waste management market during the forecast period.
Insights on Market Drivers, trends, & Challenges, historic period(2017 to 2021) and forecast period(2023 to 2027)- Request a sample report!
What are the key data covered in this Medical Waste Disposal Market report?
- CAGR of the market during the forecast period
- Detailed information on factors that will drive the growth of the medical waste disposal market between 2023 and 2027
- Precise estimation of the size of the medical waste disposal market and its contribution to the market with a focus on the parent market
- Accurate predictions about upcoming trends and changes in consumer behavior
- Growth of the medical waste disposal market across North America, Europe, APAC, South America, and Middle East and Africa
- A thorough analysis of the market’s competitive landscape and detailed information about vendors
- Comprehensive analysis of factors that will challenge the growth of Medical Waste Disposal Market vendors
Gain instant access to 17,000+ market research reports.
Technavio’s SUBSCRIPTION platform
Related Reports:
The latex medical gloves market size is expected to increase by USD 4.43 billion from 2021 to 2026, and the market’s growth momentum will accelerate at a CAGR of 8.66%. Furthermore, this report extensively covers latex medical gloves market segmentation by product (disposable and reusable) and geography (North America, Europe, Asia, and Rest of World (ROW)). The rising concerns on hygiene and safety from HAIs is notably driving the latex medical gloves market growth.
The global medical device manufacturing outsourcing market size is estimated to grow by USD 46,241.15 million between 2022 and 2027 accelerating at a CAGR of 10.85%. This medical device manufacturing outsourcing market research report extensively covers market segmentation by product (EMS, raw materials, and finished goods), medical device regulatory classification (class ii, class iii, and class i), and geography (North America, Asia, Europe, and Rest of World (ROW)). One of the key factors driving the medical device manufacturing outsourcing market growth is the growing focus of OEMs on reducing medical device manufacturing costs.
|
Medical Waste Disposal Market Scope |
|
|
Report Coverage |
Details |
|
Base year |
2022 |
|
Historic period |
2017-2021 |
|
Forecast period |
2023-2027 |
|
Growth momentum & CAGR |
Accelerate at a CAGR of 5.5% |
|
Market growth 2023-2027 |
USD 3,323.84 million |
|
Market structure |
Fragmented |
|
YoY growth 2022-2023 (%) |
5.0 |
|
Regional analysis |
North America, Europe, APAC, South America, and Middle East and Africa |
|
Performing market contribution |
North America at 36% |
|
Key countries |
US, Canada, China, Germany, and UK, Canada, Mexico, Italy,Spain, India, Japan, Australia, and South Korea |
|
Competitive landscape |
Leading Vendors, Market Positioning of Vendors, Competitive Strategies, and Industry Risks |
|
Key companies profiled |
Advanced Micro Devices Inc., All Medical Waste Australia Pty Ltd., BioMedical Waste Solutions LLC, BWS Inc., Casella Waste Systems Inc., Clean Harbors Inc., Daniels Health, EcoMed Services, EPCO, Gamma Waste Systems, GIC Medical Disposal Inc., GRP and Associates Inc., Hawaii Bio Waste Systems Inc., Larson Miller Inc., MEDPRO Disposal LLC, Stericycle Inc., Trilogy MedWaste Inc., Triumvirate Environmental, Veolia Environnement SA, and Waste Management Inc. |
|
Market dynamics |
Parent market analysis, Market growth inducers and obstacles, Fast-growing and slow-growing segment analysis, COVID-19 impact and recovery analysis and future consumer dynamics, Market condition analysis for forecast period. |
|
Customization purview |
If our report has not included the data that you are looking for, you can reach out to our analysts and get segments customized. |
Table of Contents
1 Executive Summary
- 1.1 Market overview
- Exhibit 01: Executive Summary – Chart on Market Overview
- Exhibit 02: Executive Summary – Data Table on Market Overview
- Exhibit 03: Executive Summary – Chart on Global Market Characteristics
- Exhibit 04: Executive Summary – Chart on Market by Geography
- Exhibit 05: Executive Summary – Chart on Market Segmentation by Type
- Exhibit 06: Executive Summary – Chart on Market Segmentation by Technique
- Exhibit 07: Executive Summary – Chart on Incremental Growth
- Exhibit 08: Executive Summary – Data Table on Incremental Growth
- Exhibit 09: Executive Summary – Chart on Vendor Market Positioning
2 Market Landscape
- 2.1 Market ecosystem
- Exhibit 10: Parent market
- Exhibit 11: Market Characteristics
3 Market Sizing
- 3.1 Market definition
- Exhibit 12: Offerings of vendors included in the market definition
- 3.2 Market segment analysis
- Exhibit 13: Market segments
- 3.4 Market outlook: Forecast for 2022-2027
- Exhibit 14: Chart on Global – Market size and forecast 2022-2027 ($ million)
- Exhibit 15: Data Table on Global – Market size and forecast 2022-2027 ($ million)
- Exhibit 16: Chart on Global Market: Year-over-year growth 2022-2027 (%)
- Exhibit 17: Data Table on Global Market: Year-over-year growth 2022-2027 (%)
4 Historic Market Size
- 4.1 Global medical waste management market 2017 – 2021
- Exhibit 18: Historic Market Size – Data Table on global medical waste management market 2017 – 2021 ($ million)
- 4.2 Type Segment Analysis 2017 – 2021
- Exhibit 19: Historic Market Size – Type Segment 2017 – 2021 ($ million)
- 4.3 Technique Segment Analysis 2017 – 2021
- Exhibit 20: Historic Market Size – Technique Segment 2017 – 2021 ($ million)
- 4.4 Geography Segment Analysis 2017 – 2021
- Exhibit 21: Historic Market Size – Geography Segment 2017 – 2021 ($ million)
- 4.5 Country Segment Analysis 2017 – 2021
- Exhibit 22: Historic Market Size – Country Segment 2017 – 2021 ($ million)
5 Five Forces Analysis
- 5.1 Five forces summary
- Exhibit 23: Five forces analysis – Comparison between 2022 and 2027
- 5.2 Bargaining power of buyers
- Exhibit 24: Chart on Bargaining power of buyers – Impact of key factors 2022 and 2027
- 5.3 Bargaining power of suppliers
- Exhibit 25: Bargaining power of suppliers – Impact of key factors in 2022 and 2027
- 5.4 Threat of new entrants
- Exhibit 26: Threat of new entrants – Impact of key factors in 2022 and 2027
- 5.5 Threat of substitutes
- Exhibit 27: Threat of substitutes – Impact of key factors in 2022 and 2027
- 5.6 Threat of rivalry
- Exhibit 28: Threat of rivalry – Impact of key factors in 2022 and 2027
- 5.7 Market condition
- Exhibit 29: Chart on Market condition – Five forces 2022 and 2027
6 Market Segmentation by Type
- 6.1 Market segments
- Exhibit 30: Chart on Type – Market share 2022-2027 (%)
- Exhibit 31: Data Table on Type – Market share 2022-2027 (%)
- 6.2 Comparison by Type
- Exhibit 32: Chart on Comparison by Type
- Exhibit 33: Data Table on Comparison by Type
- 6.3 Non-hazardous – Market size and forecast 2022-2027
- Exhibit 34: Chart on Non-hazardous – Market size and forecast 2022-2027 ($ million)
- Exhibit 35: Data Table on Non-hazardous – Market size and forecast 2022-2027 ($ million)
- Exhibit 36: Chart on Non-hazardous – Year-over-year growth 2022-2027 (%)
- Exhibit 37: Data Table on Non-hazardous – Year-over-year growth 2022-2027 (%)
- 6.4 Hazardous – Market size and forecast 2022-2027
- Exhibit 38: Chart on Hazardous – Market size and forecast 2022-2027 ($ million)
- Exhibit 39: Data Table on Hazardous – Market size and forecast 2022-2027 ($ million)
- Exhibit 40: Chart on Hazardous – Year-over-year growth 2022-2027 (%)
- Exhibit 41: Data Table on Hazardous – Year-over-year growth 2022-2027 (%)
- 6.5 Market opportunity by Type
- Exhibit 42: Market opportunity by Type ($ million)
- Exhibit 43: Data Table on Market opportunity by Type ($ million)
7 Market Segmentation by Technique
- 7.1 Market segments
- Exhibit 44: Chart on Technique – Market share 2022-2027 (%)
- Exhibit 45: Data Table on Technique – Market share 2022-2027 (%)
- 7.2 Comparison by Technique
- Exhibit 46: Chart on Comparison by Technique
- Exhibit 47: Data Table on Comparison by Technique
- 7.3 Offsite treatment – Market size and forecast 2022-2027
- Exhibit 48: Chart on Offsite treatment – Market size and forecast 2022-2027 ($ million)
- Exhibit 49: Data Table on Offsite treatment – Market size and forecast 2022-2027 ($ million)
- Exhibit 50: Chart on Offsite treatment – Year-over-year growth 2022-2027 (%)
- Exhibit 51: Data Table on Offsite treatment – Year-over-year growth 2022-2027 (%)
- 7.4 Onsite treatment – Market size and forecast 2022-2027
- Exhibit 52: Chart on Onsite treatment – Market size and forecast 2022-2027 ($ million)
- Exhibit 53: Data Table on Onsite treatment – Market size and forecast 2022-2027 ($ million)
- Exhibit 54: Chart on Onsite treatment – Year-over-year growth 2022-2027 (%)
- Exhibit 55: Data Table on Onsite treatment – Year-over-year growth 2022-2027 (%)
- 7.5 Market opportunity by Technique
- Exhibit 56: Market opportunity by Technique ($ million)
- Exhibit 57: Data Table on Market opportunity by Technique ($ million)
8 Customer Landscape
- 8.1 Customer landscape overview
- Exhibit 58: Analysis of price sensitivity, lifecycle, customer purchase basket, adoption rates, and purchase criteria
9 Geographic Landscape
- 9.1 Geographic segmentation
- Exhibit 59: Chart on Market share by geography 2022-2027 (%)
- Exhibit 60: Data Table on Market share by geography 2022-2027 (%)
- 9.2 Geographic comparison
- Exhibit 61: Chart on Geographic comparison
- Exhibit 62: Data Table on Geographic comparison
- 9.3 North America – Market size and forecast 2022-2027
- Exhibit 63: Chart on North America – Market size and forecast 2022-2027 ($ million)
- Exhibit 64: Data Table on North America – Market size and forecast 2022-2027 ($ million)
- Exhibit 65: Chart on North America – Year-over-year growth 2022-2027 (%)
- Exhibit 66: Data Table on North America – Year-over-year growth 2022-2027 (%)
- 9.4 Europe – Market size and forecast 2022-2027
- Exhibit 67: Chart on Europe – Market size and forecast 2022-2027 ($ million)
- Exhibit 68: Data Table on Europe – Market size and forecast 2022-2027 ($ million)
- Exhibit 69: Chart on Europe – Year-over-year growth 2022-2027 (%)
- Exhibit 70: Data Table on Europe – Year-over-year growth 2022-2027 (%)
- 9.5 APAC – Market size and forecast 2022-2027
- Exhibit 71: Chart on APAC – Market size and forecast 2022-2027 ($ million)
- Exhibit 72: Data Table on APAC – Market size and forecast 2022-2027 ($ million)
- Exhibit 73: Chart on APAC – Year-over-year growth 2022-2027 (%)
- Exhibit 74: Data Table on APAC – Year-over-year growth 2022-2027 (%)
- 9.6 South America – Market size and forecast 2022-2027
- Exhibit 75: Chart on South America – Market size and forecast 2022-2027 ($ million)
- Exhibit 76: Data Table on South America – Market size and forecast 2022-2027 ($ million)
- Exhibit 77: Chart on South America – Year-over-year growth 2022-2027 (%)
- Exhibit 78: Data Table on South America – Year-over-year growth 2022-2027 (%)
- 9.7 Middle East and Africa – Market size and forecast 2022-2027
- Exhibit 79: Chart on Middle East and Africa – Market size and forecast 2022-2027 ($ million)
- Exhibit 80: Data Table on Middle East and Africa – Market size and forecast 2022-2027 ($ million)
- Exhibit 81: Chart on Middle East and Africa – Year-over-year growth 2022-2027 (%)
- Exhibit 82: Data Table on Middle East and Africa – Year-over-year growth 2022-2027 (%)
- 9.8 US – Market size and forecast 2022-2027
- Exhibit 83: Chart on US – Market size and forecast 2022-2027 ($ million)
- Exhibit 84: Data Table on US – Market size and forecast 2022-2027 ($ million)
- Exhibit 85: Chart on US – Year-over-year growth 2022-2027 (%)
- Exhibit 86: Data Table on US – Year-over-year growth 2022-2027 (%)
- 9.9 Canada – Market size and forecast 2022-2027
- Exhibit 87: Chart on Canada – Market size and forecast 2022-2027 ($ million)
- Exhibit 88: Data Table on Canada – Market size and forecast 2022-2027 ($ million)
- Exhibit 89: Chart on Canada – Year-over-year growth 2022-2027 (%)
- Exhibit 90: Data Table on Canada – Year-over-year growth 2022-2027 (%)
- 9.10 Germany – Market size and forecast 2022-2027
- Exhibit 91: Chart on Germany – Market size and forecast 2022-2027 ($ million)
- Exhibit 92: Data Table on Germany – Market size and forecast 2022-2027 ($ million)
- Exhibit 93: Chart on Germany – Year-over-year growth 2022-2027 (%)
- Exhibit 94: Data Table on Germany – Year-over-year growth 2022-2027 (%)
- 9.11 UK – Market size and forecast 2022-2027
- Exhibit 95: Chart on UK – Market size and forecast 2022-2027 ($ million)
- Exhibit 96: Data Table on UK – Market size and forecast 2022-2027 ($ million)
- Exhibit 97: Chart on UK – Year-over-year growth 2022-2027 (%)
- Exhibit 98: Data Table on UK – Year-over-year growth 2022-2027 (%)
- 9.12 China – Market size and forecast 2022-2027
- Exhibit 99: Chart on China – Market size and forecast 2022-2027 ($ million)
- Exhibit 100: Data Table on China – Market size and forecast 2022-2027 ($ million)
- Exhibit 101: Chart on China – Year-over-year growth 2022-2027 (%)
- Exhibit 102: Data Table on China – Year-over-year growth 2022-2027 (%)
- 9.13 Market opportunity by geography
- Exhibit 103: Market opportunity by geography ($ million)
- Exhibit 104: Data Tables on Market opportunity by geography ($ million)
10 Drivers, Challenges, and Trends
- 10.3 Impact of drivers and challenges
- Exhibit 105: Impact of drivers and challenges in 2022 and 2027
11 Vendor Landscape
- 11.2 Vendor landscape
- Exhibit 106: Overview on Criticality of inputs and Factors of differentiation
- 11.3 Landscape disruption
- Exhibit 107: Overview on factors of disruption
- 11.4 Industry risks
- Exhibit 108: Impact of key risks on business
12 Vendor Analysis
- 12.1 Vendors covered
- Exhibit 109: Vendors covered
- 12.2 Market positioning of vendors
- Exhibit 110: Matrix on vendor position and classification
- 12.3 All Medical Waste Australia Pty Ltd.
- Exhibit 111: All Medical Waste Australia Pty Ltd. – Overview
- Exhibit 112: All Medical Waste Australia Pty Ltd. – Product / Service
- Exhibit 113: All Medical Waste Australia Pty Ltd. – Key offerings
- 12.4 BioMedical Waste Solutions LLC
- Exhibit 114: BioMedical Waste Solutions LLC – Overview
- Exhibit 115: BioMedical Waste Solutions LLC – Product / Service
- Exhibit 116: BioMedical Waste Solutions LLC – Key offerings
- 12.5 BWS Inc.
- Exhibit 117: BWS Inc. – Overview
- Exhibit 118: BWS Inc. – Product / Service
- Exhibit 119: BWS Inc. – Key offerings
- 12.6 Casella Waste Systems Inc.
- Exhibit 120: Casella Waste Systems Inc. – Overview
- Exhibit 121: Casella Waste Systems Inc. – Business segments
- Exhibit 122: Casella Waste Systems Inc. – Key offerings
- Exhibit 123: Casella Waste Systems Inc. – Segment focus
- 12.7 Clean Harbors Inc.
- Exhibit 124: Clean Harbors Inc. – Overview
- Exhibit 125: Clean Harbors Inc. – Business segments
- Exhibit 126: Clean Harbors Inc. – Key offerings
- Exhibit 127: Clean Harbors Inc. – Segment focus
- 12.8 Daniels Health
- Exhibit 128: Daniels Health – Overview
- Exhibit 129: Daniels Health – Product / Service
- Exhibit 130: Daniels Health – Key offerings
- 12.9 EPCO
- Exhibit 131: EPCO – Overview
- Exhibit 132: EPCO – Product / Service
- Exhibit 133: EPCO – Key offerings
- 12.10 Gamma Waste Systems
- Exhibit 134: Gamma Waste Systems – Overview
- Exhibit 135: Gamma Waste Systems – Product / Service
- Exhibit 136: Gamma Waste Systems – Key offerings
- 12.11 Larson Miller Inc.
- Exhibit 137: Larson Miller Inc. – Overview
- Exhibit 138: Larson Miller Inc. – Product / Service
- Exhibit 139: Larson Miller Inc. – Key offerings
- 12.12 MEDPRO Disposal LLC
- Exhibit 140: MEDPRO Disposal LLC – Overview
- Exhibit 141: MEDPRO Disposal LLC – Product / Service
- Exhibit 142: MEDPRO Disposal LLC – Key offerings
- 12.13 Stericycle Inc.
- Exhibit 143: Stericycle Inc. – Overview
- Exhibit 144: Stericycle Inc. – Business segments
- Exhibit 145: Stericycle Inc. – Key offerings
- Exhibit 146: Stericycle Inc. – Segment focus
- 12.14 Trilogy MedWaste Inc.
- Exhibit 147: Trilogy MedWaste Inc. – Overview
- Exhibit 148: Trilogy MedWaste Inc. – Product / Service
- Exhibit 149: Trilogy MedWaste Inc. – Key offerings
- 12.15 Triumvirate Environmental
- Exhibit 150: Triumvirate Environmental – Overview
- Exhibit 151: Triumvirate Environmental – Product / Service
- Exhibit 152: Triumvirate Environmental – Key offerings
- 12.16 Veolia Environnement SA
- Exhibit 153: Veolia Environnement SA – Overview
- Exhibit 154: Veolia Environnement SA – Business segments
- Exhibit 155: Veolia Environnement SA – Key news
- Exhibit 156: Veolia Environnement SA – Key offerings
- Exhibit 157: Veolia Environnement SA – Segment focus
- 12.17 Waste Management Inc.
- Exhibit 158: Waste Management Inc. – Overview
- Exhibit 159: Waste Management Inc. – Business segments
- Exhibit 160: Waste Management Inc. – Key offerings
- Exhibit 161: Waste Management Inc. – Segment focus
13 Appendix
- 13.1 Scope of the report
- 13.2 Inclusions and exclusions checklist
- Exhibit 162: Inclusions checklist
- Exhibit 163: Exclusions checklist
- 13.3 Currency conversion rates for US$
- Exhibit 164: Currency conversion rates for US$
- 13.4 Research methodology
- Exhibit 165: Research methodology
- Exhibit 166: Validation techniques employed for market sizing
- Exhibit 167: Information sources
- 13.5 List of abbreviations
- Exhibit 168: List of abbreviations
About Us
Technavio is a leading global technology research and advisory company. Their research and analysis focuses on emerging market trends and provides actionable insights to help businesses identify market opportunities and develop effective strategies to optimize their market positions. With over 500 specialized analysts, Technavio’s report library consists of more than 17,000 reports and counting, covering 800 technologies, spanning across 50 countries. Their client base consists of enterprises of all sizes, including more than 100 Fortune 500 companies. This growing client base relies on Technavio’s comprehensive coverage, extensive research, and actionable market insights to identify opportunities in existing and potential markets and assess their competitive positions within changing market scenarios.
Contact
Technavio Research
Jesse Maida
Media & Marketing Executive
US: +1 844 364 1100
UK: +44 203 893 3200
Email: [email protected]
Website: www.technavio.com/
SOURCE Technavio
