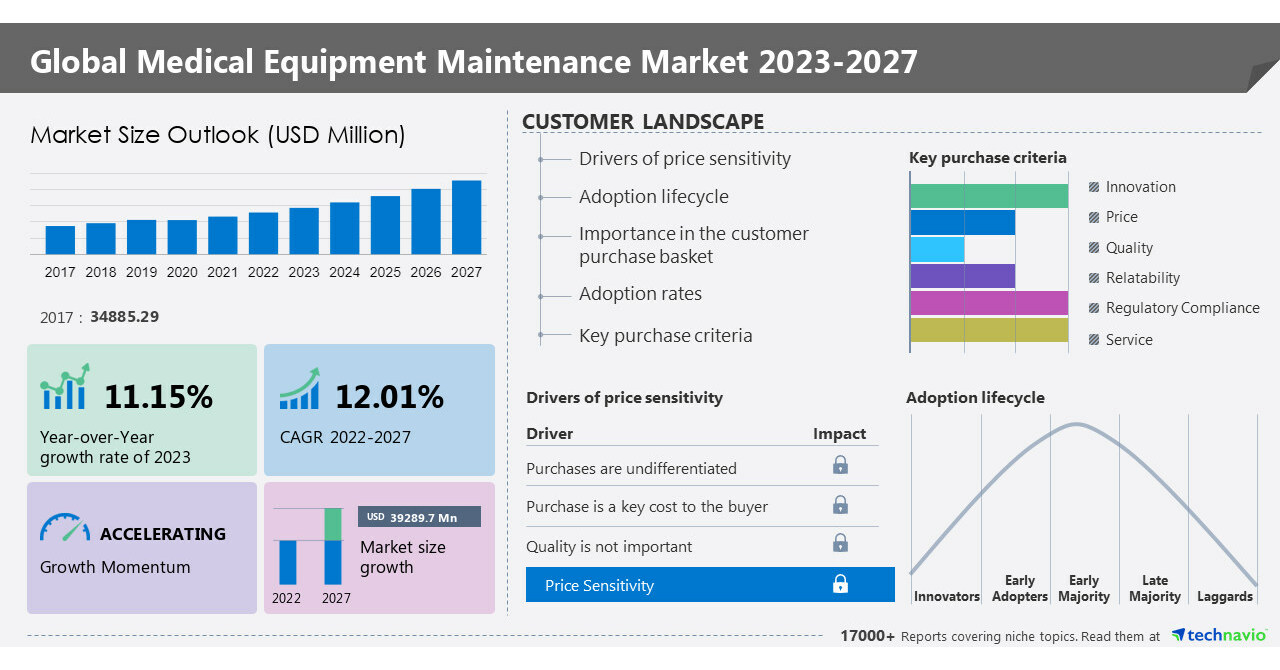
NEW YORK, June 19, 2023 /PRNewswire/ — The global medical equipment maintenance market is set to grow by USD 39,289.7 million from 2022 to 2027. The market is estimated to be progressing at a CAGR of 12.01% during the forecast period. The report offers an up-to-date analysis regarding the current global market scenario, the latest trends and drivers, and the overall market environment. The market is driven by a Rising focus on preventive maintenance of medical equipment. The rising focus on preventive maintenance of medical equipment is a key factor driving the growth of the medical equipment maintenance market. Patient safety and raising the standard of care have received more attention in medical facilities. As a result, proactive maintenance of medical equipment is becoming increasingly important to ensure its best performance. Furthermore, implementing regular maintenance services plays a crucial role in ensuring the safety, effectiveness, and prolonged use of medical equipment. The healthcare industry is increasingly prioritizing the adoption of preventive maintenance strategies creating favorable growth factors for service providers during the forecast period –Here is an Exclusive report talking about Market scenarios with a historical period (2017-2021) and forecast period (2023-2027). Download Sample Report in minutes!
The medical equipment maintenance market covers the following areas:
The report on the medical equipment maintenance market provides a holistic update, market size and forecast, trends, growth drivers, challenges, and vendor analysis.
Medical Equipment Maintenance Market 2023-2027 – Market Dynamics
Trends
The increasing adoption of advanced medical technologies in emerging countries is the major trend in the medical equipment maintenance market growth. Several innovative technologies have emerged in the medical field, including regenerative medicine, surgical robots, liquid biopsy, and wearable medical devices. Regenerative medicine is rapidly gaining recognition and significance due to its immense potential for repairing or replacing damaged human cells, tissues, and organs. This field uses various approaches such as therapeutic stem cells, tissue engineering, and the production of artificial organs to address medical challenges and enhance patient care. The increasing focus on regenerative therapies as an alternative to conventional treatment methods has become more prominent. This shift in focus has led to an increase in market growth for regenerative medicine and is expected to continue driving its expansion during the forecast period.
Challenge
The high cost of medical equipment maintenance is a major challenge to the growth of the market. Maintenance programs for medical equipment allow healthcare providers to effectively monitor and track the condition of their equipment. This enables them to ensure efficient utilization and maximize uptime, minimizing potential disruptions in healthcare services. However, the implementation of these solutions involves high installation costs and ongoing maintenance expenses.
The high costs involved in purchasing and maintaining advanced medical equipment are acting as a barrier for end-users in adopting these technologies. Hence, these factors are expected to hinder the growth of the medical equipment maintenance market during the forecast period.
Medical Equipment Maintenance Market 2023-2027: Market Segmentation
The medical equipment maintenance market is segmented by type (healthcare systems, pharmaceutical diagnostic, and others), and end-user (public sector organizations and private sector organizations).
The market share growth by the healthcare systems segment will be significant during the forecast period. The healthcare systems segment includes capital equipment, instruments, and accessories utilized in the diagnosis, monitoring, and treatment of various diseases. The global rise in the geriatric population is a significant factor contributing to the increasing prevalence of chronic diseases. Consequently, healthcare expenditure is on the rise to address the growing healthcare needs associated with chronic conditions.
The adoption of such technologically advanced products is expected to drive the growth of the healthcare systems segment during the forecast period.
Geography Overview
The security brokerage and stock exchange services market is segmented by geography into North America, Europe, APAC, Middle East and Africa, and South America. The report provides actionable insights and estimates the contribution of all regions to the growth of the market.
North America is estimated to contribute 36% to the growth of the global market during the forecast period. The elderly population in the US is experiencing a steady increase. Medical equipment maintenance service providers in the US have formed collaborations with organizations operating in various industries. As a result, this collaboration has resulted in the development of several recent advancements, including neuro-stimulators, stent technologies, biomarkers, robotic assistance devices, and implantable electronic devices.
This report presents a detailed picture of the market by way of study, synthesis, and summation of data from multiple sources through an analysis of key parameters- View Sample Report
What’s New? –
- Special coverage on the Russia–Ukraine war; global inflation; recovery analysis from COVID-19; supply chain disruptions, global trade tensions; and risk of recession
- Global competitiveness and key competitor positions
- Market presence across multiple geographical footprints – Strong/Active/Niche/Trivial – Buy the report!
Companies Mentioned
- Agfa Gevaert NV
- AlphaSource Group
- Althea Group S.p.A.
- Aramark
- B Braun Melsungen AG
- Boston Scientific Corp.
- Canon Inc.
- Carestream Health Inc.
- Dragerwerk AG and Co. KGaA
- Edwards Lifesciences Corp.
- FUJIFILM Corp.
- General Electric Co.
- Hitachi Ltd.
- HOYA Corp.
- Koninklijke Philips NV
- Medtronic Plc
- Samsung Electronics Co. Ltd.
- Siemens AG
- Stryker Corp.
- Terumo Group
Vendor Offerings
- AlphaSource Group – The company offers medical equipment maintenance services across bombed, surgical, and imaging departments.
- Althea Group S.p.A. – The company offers medical equipment maintenance services through Managed Equipment Services.
- B Braun Melsungen AG – The company offers medical equipment maintenance services such as cleaning and sterilization of surgical instruments through the AESCULAP Aicon container system.
Gain instant access to 17,000+ market research reports.
Technavio’s SUBSCRIPTION platform
Related Reports:
The refurbished medical imaging equipment market size is estimated to grow at a CAGR of 7.63% between 2022 and 2027. The market size is forecast to increase by USD 5,892.42 million. Furthermore, this report extensively covers market segmentation by product (X-ray imaging, ultrasound systems, MRI, CT scanner imaging, and SPECT/ PET scanners), end-user (hospitals and diagnostic centers), and geography (North America, Europe, Asia, and the Rest of the World). The increasing demand for cost-effective and efficient medical imaging devices is driving market growth.
The durable medical equipment market size in the US should rise by USD 19.55 billion from 2021 to 2026 at a CAGR of 5.83%. Furthermore, this report extensively covers market segmentation by product (monitoring and therapeutic devices, personal mobility devices, bathroom safety devices, and medical furniture) and end-user (hospitals and clinics, home healthcare, and ambulatory surgical centers). The growing geriatric population is notably driving the durable medical equipment market growth in US.
|
Medical Equipment Maintenance Market Scope |
|
|
Report Coverage |
Details |
|
Base year |
2022 |
|
Historic period |
2017-2021 |
|
Forecast period |
2023-2027 |
|
Growth momentum & CAGR |
Accelerate at a CAGR of 12.01% |
|
Market growth 2023-2027 |
USD 39,289.7 million |
|
Market structure |
Fragmented |
|
YoY growth 2022-2023(%) |
11.15 |
|
Regional analysis |
North America, Europe, Asia, and Rest of World (ROW) |
|
Performing market contribution |
North America at 36% |
|
Key countries |
US, Canada, Germany, UK, and China |
|
Competitive landscape |
Leading Vendors, Market Positioning of Vendors, Competitive Strategies, and Industry Risks |
|
Key companies profiled |
Agfa Gevaert NV, AlphaSource Group, Althea Group S.p.A., Aramark, B Braun Melsungen AG, Boston Scientific Corp., Canon Inc., Carestream Health Inc., Dragerwerk AG and Co. KGaA, Edwards Lifesciences Corp., FUJIFILM Corp., General Electric Co., Hitachi Ltd., HOYA Corp., Koninklijke Philips NV, Medtronic Plc, Samsung Electronics Co. Ltd., Siemens AG, Stryker Corp., and Terumo Group |
|
Market dynamics |
Parent market analysis, Market growth inducers and obstacles, Fast-growing and slow-growing segment analysis, COVID-19 impact and recovery analysis and future consumer dynamics, Market condition analysis for forecast period. |
|
Customization purview |
If our report has not included the data that you are looking for, you can reach out to our analysts and get segments customized. |
Key Topics Covered:
1 Executive Summary
- 1.1 Market overview
- Exhibit 01: Executive Summary – Chart on Market Overview
- Exhibit 02: Executive Summary – Data Table on Market Overview
- Exhibit 03: Executive Summary – Chart on Global Market Characteristics
- Exhibit 04: Executive Summary – Chart on Market by Geography
- Exhibit 05: Executive Summary – Chart on Market Segmentation by Type
- Exhibit 06: Executive Summary – Chart on Market Segmentation by End-user
- Exhibit 07: Executive Summary – Chart on Incremental Growth
- Exhibit 08: Executive Summary – Data Table on Incremental Growth
- Exhibit 09: Executive Summary – Chart on Vendor Market Positioning
2 Market Landscape
- 2.1 Market ecosystem
- Exhibit 10: Parent market
- Exhibit 11: Market Characteristics
3 Market Sizing
- 3.1 Market definition
- Exhibit 12: Offerings of vendors included in the market definition
- 3.2 Market segment analysis
- Exhibit 13: Market segments
- 3.4 Market outlook: Forecast for 2022-2027
- Exhibit 14: Chart on Global – Market size and forecast 2022-2027 ($ million)
- Exhibit 15: Data Table on Global – Market size and forecast 2022-2027 ($ million)
- Exhibit 16: Chart on Global Market: Year-over-year growth 2022-2027 (%)
- Exhibit 17: Data Table on Global Market: Year-over-year growth 2022-2027 (%)
4 Historic Market Size
- 4.1 Global medical equipment maintenance market 2017 – 2021
- Exhibit 18: Historic Market Size – Data Table on Global medical equipment maintenance market 2017 – 2021 ($ million)
- 4.2 Type Segment Analysis 2017 – 2021
- Exhibit 19: Historic Market Size – Type Segment 2017 – 2021 ($ million)
- 4.3 End user Segment Analysis 2017 – 2021
- Exhibit 20: Historic Market Size – End user Segment 2017 – 2021 ($ million)
- 4.4 Geography Segment Analysis 2017 – 2021
- Exhibit 21: Historic Market Size – Geography Segment 2017 – 2021 ($ million)
- 4.5 Country Segment Analysis 2017 – 2021
- Exhibit 22: Historic Market Size – Country Segment 2017 – 2021 ($ million)
5 Five Forces Analysis
- 5.1 Five forces summary
- Exhibit 23: Five forces analysis – Comparison between 2022 and 2027
- 5.2 Bargaining power of buyers
- Exhibit 24: Chart on Bargaining power of buyers – Impact of key factors 2022 and 2027
- 5.3 Bargaining power of suppliers
- Exhibit 25: Bargaining power of suppliers – Impact of key factors in 2022 and 2027
- 5.4 Threat of new entrants
- Exhibit 26: Threat of new entrants – Impact of key factors in 2022 and 2027
- 5.5 Threat of substitutes
- Exhibit 27: Threat of substitutes – Impact of key factors in 2022 and 2027
- 5.6 Threat of rivalry
- Exhibit 28: Threat of rivalry – Impact of key factors in 2022 and 2027
- 5.7 Market condition
- Exhibit 29: Chart on Market condition – Five forces 2022 and 2027
6 Market Segmentation by Type
- 6.1 Market segments
- Exhibit 30: Chart on Type – Market share 2022-2027 (%)
- Exhibit 31: Data Table on Type – Market share 2022-2027 (%)
- 6.2 Comparison by Type
- Exhibit 32: Chart on Comparison by Type
- Exhibit 33: Data Table on Comparison by Type
- 6.3 Healthcare systems – Market size and forecast 2022-2027
- Exhibit 34: Chart on Healthcare systems – Market size and forecast 2022-2027 ($ million)
- Exhibit 35: Data Table on Healthcare systems – Market size and forecast 2022-2027 ($ million)
- Exhibit 36: Chart on Healthcare systems – Year-over-year growth 2022-2027 (%)
- Exhibit 37: Data Table on Healthcare systems – Year-over-year growth 2022-2027 (%)
- 6.4 Pharmaceutical diagnostics – Market size and forecast 2022-2027
- Exhibit 38: Chart on Pharmaceutical diagnostics – Market size and forecast 2022-2027 ($ million)
- Exhibit 39: Data Table on Pharmaceutical diagnostics – Market size and forecast 2022-2027 ($ million)
- Exhibit 40: Chart on Pharmaceutical diagnostics – Year-over-year growth 2022-2027 (%)
- Exhibit 41: Data Table on Pharmaceutical diagnostics – Year-over-year growth 2022-2027 (%)
- 6.5 Others – Market size and forecast 2022-2027
- Exhibit 42: Chart on Others – Market size and forecast 2022-2027 ($ million)
- Exhibit 43: Data Table on Others – Market size and forecast 2022-2027 ($ million)
- Exhibit 44: Chart on Others – Year-over-year growth 2022-2027 (%)
- Exhibit 45: Data Table on Others – Year-over-year growth 2022-2027 (%)
- 6.6 Market opportunity by Type
- Exhibit 46: Market opportunity by Type ($ million)
7 Market Segmentation by End-user
- 7.1 Market segments
- Exhibit 47: Chart on End-user – Market share 2022-2027 (%)
- Exhibit 48: Data Table on End-user – Market share 2022-2027 (%)
- 7.2 Comparison by End-user
- Exhibit 49: Chart on Comparison by End-user
- Exhibit 50: Data Table on Comparison by End-user
- 7.3 Public sector organisations – Market size and forecast 2022-2027
- Exhibit 51: Chart on Public sector organisations – Market size and forecast 2022-2027 ($ million)
- Exhibit 52: Data Table on Public sector organisations – Market size and forecast 2022-2027 ($ million)
- Exhibit 53: Chart on Public sector organisations – Year-over-year growth 2022-2027 (%)
- Exhibit 54: Data Table on Public sector organisations – Year-over-year growth 2022-2027 (%)
- 7.4 Private sector organisations – Market size and forecast 2022-2027
- Exhibit 55: Chart on Private sector organisations – Market size and forecast 2022-2027 ($ million)
- Exhibit 56: Data Table on Private sector organisations – Market size and forecast 2022-2027 ($ million)
- Exhibit 57: Chart on Private sector organisations – Year-over-year growth 2022-2027 (%)
- Exhibit 58: Data Table on Private sector organisations – Year-over-year growth 2022-2027 (%)
- 7.5 Market opportunity by End-user
- Exhibit 59: Market opportunity by End-user ($ million)
8 Customer Landscape
- 8.1 Customer landscape overview
- Exhibit 60: Analysis of price sensitivity, lifecycle, customer purchase basket, adoption rates, and purchase criteria
9 Geographic Landscape
- 9.1 Geographic segmentation
- Exhibit 61: Chart on Market share by geography 2022-2027 (%)
- Exhibit 62: Data Table on Market share by geography 2022-2027 (%)
- 9.2 Geographic comparison
- Exhibit 63: Chart on Geographic comparison
- Exhibit 64: Data Table on Geographic comparison
- 9.3 North America – Market size and forecast 2022-2027
- Exhibit 65: Chart on North America – Market size and forecast 2022-2027 ($ million)
- Exhibit 66: Data Table on North America – Market size and forecast 2022-2027 ($ million)
- Exhibit 67: Chart on North America – Year-over-year growth 2022-2027 (%)
- Exhibit 68: Data Table on North America – Year-over-year growth 2022-2027 (%)
- 9.4 Europe – Market size and forecast 2022-2027
- Exhibit 69: Chart on Europe – Market size and forecast 2022-2027 ($ million)
- Exhibit 70: Data Table on Europe – Market size and forecast 2022-2027 ($ million)
- Exhibit 71: Chart on Europe – Year-over-year growth 2022-2027 (%)
- Exhibit 72: Data Table on Europe – Year-over-year growth 2022-2027 (%)
- 9.5 Asia – Market size and forecast 2022-2027
- Exhibit 73: Chart on Asia – Market size and forecast 2022-2027 ($ million)
- Exhibit 74: Data Table on Asia – Market size and forecast 2022-2027 ($ million)
- Exhibit 75: Chart on Asia – Year-over-year growth 2022-2027 (%)
- Exhibit 76: Data Table on Asia – Year-over-year growth 2022-2027 (%)
- 9.6 Rest of World (ROW) – Market size and forecast 2022-2027
- Exhibit 77: Chart on Rest of World (ROW) – Market size and forecast 2022-2027 ($ million)
- Exhibit 78: Data Table on Rest of World (ROW) – Market size and forecast 2022-2027 ($ million)
- Exhibit 79: Chart on Rest of World (ROW) – Year-over-year growth 2022-2027 (%)
- Exhibit 80: Data Table on Rest of World (ROW) – Year-over-year growth 2022-2027 (%)
- 9.7 US – Market size and forecast 2022-2027
- Exhibit 81: Chart on US – Market size and forecast 2022-2027 ($ million)
- Exhibit 82: Data Table on US – Market size and forecast 2022-2027 ($ million)
- Exhibit 83: Chart on US – Year-over-year growth 2022-2027 (%)
- Exhibit 84: Data Table on US – Year-over-year growth 2022-2027 (%)
- 9.8 China – Market size and forecast 2022-2027
- Exhibit 85: Chart on China – Market size and forecast 2022-2027 ($ million)
- Exhibit 86: Data Table on China – Market size and forecast 2022-2027 ($ million)
- Exhibit 87: Chart on China – Year-over-year growth 2022-2027 (%)
- Exhibit 88: Data Table on China – Year-over-year growth 2022-2027 (%)
- 9.9 Germany – Market size and forecast 2022-2027
- Exhibit 89: Chart on Germany – Market size and forecast 2022-2027 ($ million)
- Exhibit 90: Data Table on Germany – Market size and forecast 2022-2027 ($ million)
- Exhibit 91: Chart on Germany – Year-over-year growth 2022-2027 (%)
- Exhibit 92: Data Table on Germany – Year-over-year growth 2022-2027 (%)
- 9.10 Canada – Market size and forecast 2022-2027
- Exhibit 93: Chart on Canada – Market size and forecast 2022-2027 ($ million)
- Exhibit 94: Data Table on Canada – Market size and forecast 2022-2027 ($ million)
- Exhibit 95: Chart on Canada – Year-over-year growth 2022-2027 (%)
- Exhibit 96: Data Table on Canada – Year-over-year growth 2022-2027 (%)
- 9.11 UK – Market size and forecast 2022-2027
- Exhibit 97: Chart on UK – Market size and forecast 2022-2027 ($ million)
- Exhibit 98: Data Table on UK – Market size and forecast 2022-2027 ($ million)
- Exhibit 99: Chart on UK – Year-over-year growth 2022-2027 (%)
- Exhibit 100: Data Table on UK – Year-over-year growth 2022-2027 (%)
- 9.12 Market opportunity by geography
- Exhibit 101: Market opportunity by geography ($ million)
10 Drivers, Challenges, and Trends
- 10.3 Impact of drivers and challenges
- Exhibit 102: Impact of drivers and challenges in 2022 and 2027
11 Vendor Landscape
- 11.2 Vendor landscape
- Exhibit 103: Overview on Criticality of inputs and Factors of differentiation
- 11.3 Landscape disruption
- Exhibit 104: Overview on factors of disruption
- 11.4 Industry risks
- Exhibit 105: Impact of key risks on business
12 Vendor Analysis
- 12.1 Vendors covered
- Exhibit 106: Vendors covered
- 12.2 Market positioning of vendors
- Exhibit 107: Matrix on vendor position and classification
- 12.3 Agfa Gevaert NV
- Exhibit 108: Agfa Gevaert NV – Overview
- Exhibit 109: Agfa Gevaert NV – Business segments
- Exhibit 110: Agfa Gevaert NV – Key offerings
- Exhibit 111: Agfa Gevaert NV – Segment focus
- 12.4 AlphaSource Group
- Exhibit 112: AlphaSource Group – Overview
- Exhibit 113: AlphaSource Group – Product / Service
- Exhibit 114: AlphaSource Group – Key offerings
- 12.5 Althea Group S.p.A.
- Exhibit 115: Althea Group S.p.A. – Overview
- Exhibit 116: Althea Group S.p.A. – Product / Service
- Exhibit 117: Althea Group S.p.A. – Key offerings
- 12.6 Aramark
- Exhibit 118: Aramark – Overview
- Exhibit 119: Aramark – Business segments
- Exhibit 120: Aramark – Key offerings
- Exhibit 121: Aramark – Segment focus
- 12.7 B Braun Melsungen AG
- Exhibit 122: B Braun Melsungen AG – Overview
- Exhibit 123: B Braun Melsungen AG – Business segments
- Exhibit 124: B Braun Melsungen AG – Key news
- Exhibit 125: B Braun Melsungen AG – Key offerings
- Exhibit 126: B Braun Melsungen AG – Segment focus
- 12.8 Boston Scientific Corp.
- Exhibit 127: Boston Scientific Corp. – Overview
- Exhibit 128: Boston Scientific Corp. – Business segments
- Exhibit 129: Boston Scientific Corp. – Key news
- Exhibit 130: Boston Scientific Corp. – Key offerings
- Exhibit 131: Boston Scientific Corp. – Segment focus
- 12.9 Carestream Health Inc.
- Exhibit 132: Carestream Health Inc. – Overview
- Exhibit 133: Carestream Health Inc. – Product / Service
- Exhibit 134: Carestream Health Inc. – Key offerings
- 12.10 Dragerwerk AG and Co. KGaA
- Exhibit 135: Dragerwerk AG and Co. KGaA – Overview
- Exhibit 136: Dragerwerk AG and Co. KGaA – Business segments
- Exhibit 137: Dragerwerk AG and Co. KGaA – Key offerings
- Exhibit 138: Dragerwerk AG and Co. KGaA – Segment focus
- 12.11 FUJIFILM Corp.
- Exhibit 139: FUJIFILM Corp. – Overview
- Exhibit 140: FUJIFILM Corp. – Business segments
- Exhibit 141: FUJIFILM Corp. – Key news
- Exhibit 142: FUJIFILM Corp. – Key offerings
- Exhibit 143: FUJIFILM Corp. – Segment focus
- 12.12 General Electric Co.
- Exhibit 144: General Electric Co. – Overview
- Exhibit 145: General Electric Co. – Business segments
- Exhibit 146: General Electric Co. – Key news
- Exhibit 147: General Electric Co. – Key offerings
- Exhibit 148: General Electric Co. – Segment focus
- 12.13 Hitachi Ltd.
- Exhibit 149: Hitachi Ltd. – Overview
- Exhibit 150: Hitachi Ltd. – Business segments
- Exhibit 151: Hitachi Ltd. – Key news
- Exhibit 152: Hitachi Ltd. – Key offerings
- Exhibit 153: Hitachi Ltd. – Segment focus
- 12.14 Koninklijke Philips NV
- Exhibit 154: Koninklijke Philips NV – Overview
- Exhibit 155: Koninklijke Philips NV – Business segments
- Exhibit 156: Koninklijke Philips NV – Key news
- Exhibit 157: Koninklijke Philips NV – Key offerings
- Exhibit 158: Koninklijke Philips NV – Segment focus
- 12.15 Medtronic Plc
- Exhibit 159: Medtronic Plc – Overview
- Exhibit 160: Medtronic Plc – Business segments
- Exhibit 161: Medtronic Plc – Key news
- Exhibit 162: Medtronic Plc – Key offerings
- Exhibit 163: Medtronic Plc – Segment focus
- 12.16 Samsung Electronics Co. Ltd.
- Exhibit 164: Samsung Electronics Co. Ltd. – Overview
- Exhibit 165: Samsung Electronics Co. Ltd. – Business segments
- Exhibit 166: Samsung Electronics Co. Ltd. – Key news
- Exhibit 167: Samsung Electronics Co. Ltd. – Key offerings
- Exhibit 168: Samsung Electronics Co. Ltd. – Segment focus
- 12.17 Siemens AG
- Exhibit 169: Siemens AG – Overview
- Exhibit 170: Siemens AG – Business segments
- Exhibit 171: Siemens AG – Key news
- Exhibit 172: Siemens AG – Key offerings
- Exhibit 173: Siemens AG – Segment focus
13 Appendix
- 13.2 Inclusions and exclusions checklist
- Exhibit 174: Inclusions checklist
- Exhibit 175: Exclusions checklist
- 13.3 Currency conversion rates for US$
- Exhibit 176: Currency conversion rates for US$
- 13.4 Research methodology
- Exhibit 177: Research methodology
- Exhibit 178: Validation techniques employed for market sizing
- Exhibit 179: Information sources
- 13.5 List of abbreviations
- Exhibit 180: List of abbreviations
About Us
Technavio is a leading global technology research and advisory company. Their research and analysis focuses on emerging market trends and provides actionable insights to help businesses identify market opportunities and develop effective strategies to optimize their market positions. With over 500 specialized analysts, Technavio’s report library consists of more than 17,000 reports and counting, covering 800 technologies, spanning across 50 countries. Their client base consists of enterprises of all sizes, including more than 100 Fortune 500 companies. This growing client base relies on Technavio’s comprehensive coverage, extensive research, and actionable market insights to identify opportunities in existing and potential markets and assess their competitive positions within changing market scenarios.
Contact
Technavio Research
Jesse Maida
Media & Marketing Executive
US: +1 844 364 1100
UK: +44 203 893 3200
Email: [email protected]
Website: www.technavio.com
SOURCE Technavio
