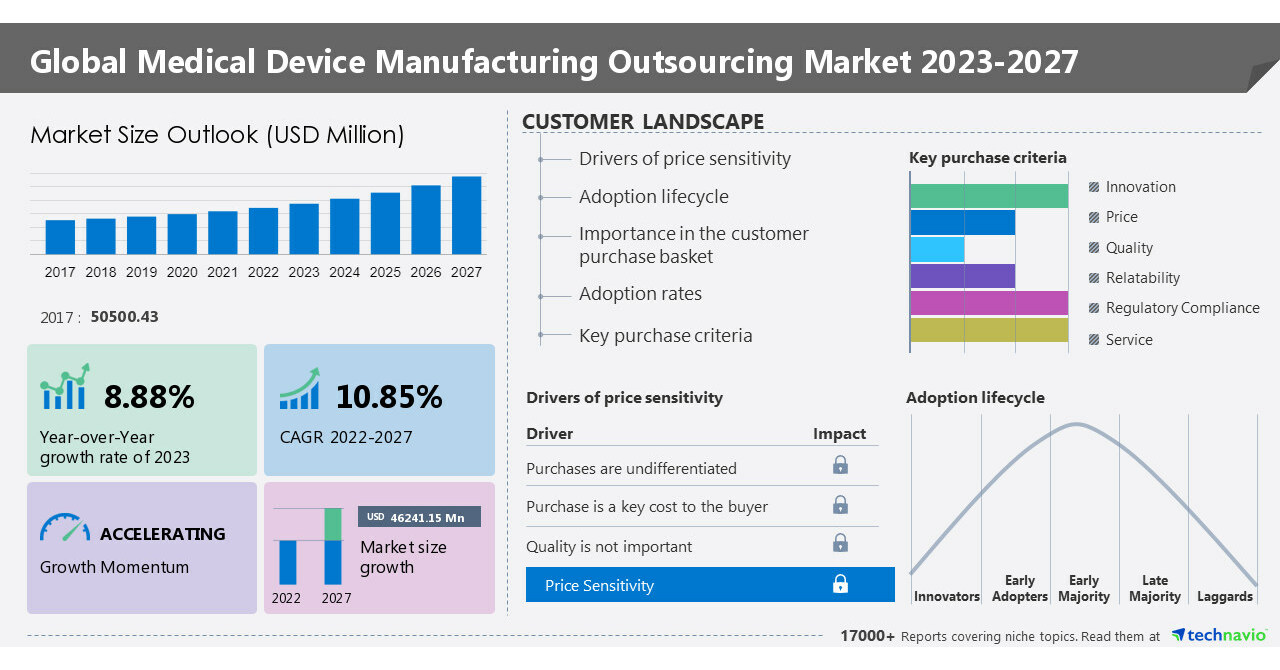
NEW YORK, May 12, 2023 /PRNewswire/ — The medical device manufacturing outsourcing market is set to grow by USD 46241.15 million from 2022 to 2027 progressing at a CAGR of 10.85% during the forecast period. The report offers an up-to-date analysis regarding the current global market scenario, the latest trends and drivers, and the overall market environment. The market is driven by the growing focus of OEMs on reducing medical device manufacturing costs. The high growth potential and increasing demand for medical device products from end-users have compelled OEMs to outsource their manufacturing capabilities.
Here is an Exclusive report talking about Market scenarios with a historical period (2017-2021) and a forecast period (2023-2027). Download Sample Report in minutes!
The report on the medical device manufacturing outsourcing market provides a holistic update, market size and forecast, trends, growth drivers, and challenges, as well as vendor analysis.
Medical Device Manufacturing Outsourcing Market 2023-2027 – Market Dynamics
Market Drivers
- Growing focus of OEMs on reducing medical device manufacturing costs
- Growing complexities in product design and development
- Emerging countries as a preferred outsourcing destination for medical device manufacturing
Market Trends
- Increasing M and A activities
- Technological advances for manufacturing medical devices
- Increasing consumption of Class I medical devices
Market Challenges
- Stringent regulatory environment
- Intense competition in the market
- Delay in contractual obligations and upgrading new technologies
Medical Device Manufacturing Outsourcing Market 2023-2027: Market Segmentation
The medical device manufacturing outsourcing market is segmented by product (EMS, raw materials, and finished goods), medical device regulatory classification (class ii, class iii, and class i), and geography (North America, Asia, Europe, and Rest of World (ROW)).
The market share growth by the EMS segment will be significant during the forecast period. EMS providers offer effective solutions to reduce cost, besides increasing quality, the value of innovation, and efficiency, thus reducing the time to market a new product and improving supply chain management.
North America is estimated to contribute 36% to the growth of the global market during the forecast period. The benefits of outsourcing include reduced costs, improved quality, access to new geographical and global capabilities, the ability to focus on improving operating margins and core competencies, reduced risks (regulatory), and access to leading experts and technologies.
Technavio’s report presents a detailed picture of the market by way of study, synthesis, and summation of data from multiple sources through an analysis of key parameters- View Sample Report
The medical device manufacturing outsourcing market covers the following areas:
Medical Device Manufacturing Outsourcing Market Sizing
Medical Device Manufacturing Outsourcing Market Forecast
Medical Device Manufacturing Outsourcing Market Analysis
Companies Mentioned
- Benchmark Electronics Inc.
- Cadence Inc.
- Celestica Inc.
- Cirtec Medical
- Eurofins Scientific SE
- Flex Ltd.
- Gerresheimer AG
- Heraeus Holding GmbH
- Integer Holdings Corp.
- Jabil Inc.
- Kimball Electronics Inc.
- NN Inc.
- Nortech Systems Inc.
- Plexus Corp.
- Sanmina Corp.
- Tata Sons Pvt. Ltd.
- TE Connectivity Ltd.
- Tecomet Inc.
- TRICOR Systems Inc.
- West Pharmaceutical Services Inc.
bench.com- The company offers medical device manufacturing outsourcing for point of care medical device industry.
celestica.com- The company offers medical device manufacturing outsourcing for Patient monitoring devices, Renal dialysis and Dental radiology.
cirtecmed.com- The company offers medical device manufacturing outsourcing for active implantable medical devices.
Related Reports:
North America Medical Device Packaging Market- The North American medical device packaging market size is estimated to grow at a CAGR of 9.84% between 2022 and 2027. The market size is forecast to increase by USD 4,280 million.
Pediatric Medical Devices Market- The pediatric medical devices market is estimated to grow at a CAGR of 8.84% between 2022 and 2027. The size of the market is forecast to increase by USD 15.01 billion.
Register for a free trial today and gain instant access to 17,000+ market research reports.
Technavio’s SUBSCRIPTION platform
|
Medical Device Manufacturing Outsourcing Market Scope |
|
|
Report Coverage |
Details |
|
Base year |
2022 |
|
Historic period |
2017-2021 |
|
Forecast period |
2023-2027 |
|
Growth momentum & CAGR |
Accelerate at a CAGR of 10.85% |
|
Market growth 2023-2027 |
USD 46241.15 million |
|
Market structure |
Fragmented |
|
YoY growth 2022-2023(%) |
8.88 |
|
Regional analysis |
North America, Asia, Europe, and Rest of World (ROW) |
|
Performing market contribution |
North America at 36% |
|
Key countries |
US, Germany, China, Japan, and India |
|
Competitive landscape |
Leading Vendors, Market Positioning of Vendors, Competitive Strategies, and Industry Risks |
|
Key companies profiled |
Benchmark Electronics Inc., Cadence Inc., Celestica Inc., Cirtec Medical, Eurofins Scientific SE, Flex Ltd., Gerresheimer AG, Heraeus Holding GmbH, Integer Holdings Corp., Jabil Inc., Kimball Electronics Inc., NN Inc., Nortech Systems Inc., Plexus Corp., Sanmina Corp., Tata Sons Pvt. Ltd., TE Connectivity Ltd., Tecomet Inc., TRICOR Systems Inc., and West Pharmaceutical Services Inc. |
|
Market dynamics |
Parent market analysis, Market growth inducers and obstacles, Fast-growing and slow-growing segment analysis, COVID-19 impact and recovery analysis and future consumer dynamics, Market condition analysis for forecast period |
|
Customization purview |
If our report has not included the data that you are looking for, you can reach out to our analysts and get segments customized. |
Key Topics Covered:
1 Executive Summary
- 1.1 Market overview
- Exhibit 01: Executive Summary – Chart on Market Overview
- Exhibit 02: Executive Summary – Data Table on Market Overview
- Exhibit 03: Executive Summary – Chart on Global Market Characteristics
- Exhibit 04: Executive Summary – Chart on Market by Geography
- Exhibit 05: Executive Summary – Chart on Market Segmentation by Product
- Exhibit 06: Executive Summary – Chart on Market Segmentation by Medical Device Regulatory Classification
- Exhibit 07: Executive Summary – Chart on Incremental Growth
- Exhibit 08: Executive Summary – Data Table on Incremental Growth
- Exhibit 09: Executive Summary – Chart on Vendor Market Positioning
2 Market Landscape
- 2.1 Market ecosystem
- Exhibit 10: Parent market
- Exhibit 11: Market Characteristics
3 Market Sizing
- 3.1 Market definition
- Exhibit 12: Offerings of vendors included in the market definition
- 3.2 Market segment analysis
- Exhibit 13: Market segments
- 3.4 Market outlook: Forecast for 2022-2027
- Exhibit 14: Chart on Global – Market size and forecast 2022-2027 ($ million)
- Exhibit 15: Data Table on Global – Market size and forecast 2022-2027 ($ million)
- Exhibit 16: Chart on Global Market: Year-over-year growth 2022-2027 (%)
- Exhibit 17: Data Table on Global Market: Year-over-year growth 2022-2027 (%)
4 Historic Market Size
- 4.1 Global medical device manufacturing outsourcing market 2017 – 2021
- Exhibit 18: Historic Market Size – Data Table on Global medical device manufacturing outsourcing market 2017 – 2021 ($ million)
- 4.2 Product Segment Analysis 2017 – 2021
- Exhibit 19: Historic Market Size – Product Segment 2017 – 2021 ($ million)
- 4.3 Medical device regulatory classification Segment Analysis 2017 – 2021
- Exhibit 20: Historic Market Size – Medical device regulatory classification Segment 2017 – 2021 ($ million)
- 4.4 Geography Segment Analysis 2017 – 2021
- Exhibit 21: Historic Market Size – Geography Segment 2017 – 2021 ($ million)
- 4.5 Country Segment Analysis 2017 – 2021
- Exhibit 22: Historic Market Size – Country Segment 2017 – 2021 ($ million)
5 Five Forces Analysis
- 5.1 Five forces summary
- Exhibit 23: Five forces analysis – Comparison between 2022 and 2027
- 5.2 Bargaining power of buyers
- Exhibit 24: Chart on Bargaining power of buyers – Impact of key factors 2022 and 2027
- 5.3 Bargaining power of suppliers
- Exhibit 25: Bargaining power of suppliers – Impact of key factors in 2022 and 2027
- 5.4 Threat of new entrants
- Exhibit 26: Threat of new entrants – Impact of key factors in 2022 and 2027
- 5.5 Threat of substitutes
- Exhibit 27: Threat of substitutes – Impact of key factors in 2022 and 2027
- 5.6 Threat of rivalry
- Exhibit 28: Threat of rivalry – Impact of key factors in 2022 and 2027
- 5.7 Market condition
- Exhibit 29: Chart on Market condition – Five forces 2022 and 2027
6 Market Segmentation by Product
- 6.1 Market segments
- Exhibit 30: Chart on Product – Market share 2022-2027 (%)
- Exhibit 31: Data Table on Product – Market share 2022-2027 (%)
- 6.2 Comparison by Product
- Exhibit 32: Chart on Comparison by Product
- Exhibit 33: Data Table on Comparison by Product
- 6.3 EMS – Market size and forecast 2022-2027
- Exhibit 34: Chart on EMS – Market size and forecast 2022-2027 ($ million)
- Exhibit 35: Data Table on EMS – Market size and forecast 2022-2027 ($ million)
- Exhibit 36: Chart on EMS – Year-over-year growth 2022-2027 (%)
- Exhibit 37: Data Table on EMS – Year-over-year growth 2022-2027 (%)
- 6.4 Raw materials – Market size and forecast 2022-2027
- Exhibit 38: Chart on Raw materials – Market size and forecast 2022-2027 ($ million)
- Exhibit 39: Data Table on Raw materials – Market size and forecast 2022-2027 ($ million)
- Exhibit 40: Chart on Raw materials – Year-over-year growth 2022-2027 (%)
- Exhibit 41: Data Table on Raw materials – Year-over-year growth 2022-2027 (%)
- 6.5 Finished goods – Market size and forecast 2022-2027
- Exhibit 42: Chart on Finished goods – Market size and forecast 2022-2027 ($ million)
- Exhibit 43: Data Table on Finished goods – Market size and forecast 2022-2027 ($ million)
- Exhibit 44: Chart on Finished goods – Year-over-year growth 2022-2027 (%)
- Exhibit 45: Data Table on Finished goods – Year-over-year growth 2022-2027 (%)
- 6.6 Market opportunity by Product
- Exhibit 46: Market opportunity by Product ($ million)
7 Market Segmentation by Medical Device Regulatory Classification
- 7.1 Market segments
- Exhibit 47: Chart on Medical Device Regulatory Classification – Market share 2022-2027 (%)
- Exhibit 48: Data Table on Medical Device Regulatory Classification – Market share 2022-2027 (%)
- 7.2 Comparison by Medical Device Regulatory Classification
- Exhibit 49: Chart on Comparison by Medical Device Regulatory Classification
- Exhibit 50: Data Table on Comparison by Medical Device Regulatory Classification
- 7.3 Class II – Market size and forecast 2022-2027
- Exhibit 51: Chart on Class II – Market size and forecast 2022-2027 ($ million)
- Exhibit 52: Data Table on Class II – Market size and forecast 2022-2027 ($ million)
- Exhibit 53: Chart on Class II – Year-over-year growth 2022-2027 (%)
- Exhibit 54: Data Table on Class II – Year-over-year growth 2022-2027 (%)
- 7.4 Class III – Market size and forecast 2022-2027
- Exhibit 55: Chart on Class III – Market size and forecast 2022-2027 ($ million)
- Exhibit 56: Data Table on Class III – Market size and forecast 2022-2027 ($ million)
- Exhibit 57: Chart on Class III – Year-over-year growth 2022-2027 (%)
- Exhibit 58: Data Table on Class III – Year-over-year growth 2022-2027 (%)
- 7.5 Class I – Market size and forecast 2022-2027
- Exhibit 59: Chart on Class I – Market size and forecast 2022-2027 ($ million)
- Exhibit 60: Data Table on Class I – Market size and forecast 2022-2027 ($ million)
- Exhibit 61: Chart on Class I – Year-over-year growth 2022-2027 (%)
- Exhibit 62: Data Table on Class I – Year-over-year growth 2022-2027 (%)
- 7.6 Market opportunity by Medical Device Regulatory Classification
- Exhibit 63: Market opportunity by Medical Device Regulatory Classification ($ million)
8 Customer Landscape
- 8.1 Customer landscape overview
- Exhibit 64: Analysis of price sensitivity, lifecycle, customer purchase basket, adoption rates, and purchase criteria
9 Geographic Landscape
- 9.1 Geographic segmentation
- Exhibit 65: Chart on Market share by geography 2022-2027 (%)
- Exhibit 66: Data Table on Market share by geography 2022-2027 (%)
- 9.2 Geographic comparison
- Exhibit 67: Chart on Geographic comparison
- Exhibit 68: Data Table on Geographic comparison
- 9.3 North America – Market size and forecast 2022-2027
- Exhibit 69: Chart on North America – Market size and forecast 2022-2027 ($ million)
- Exhibit 70: Data Table on North America – Market size and forecast 2022-2027 ($ million)
- Exhibit 71: Chart on North America – Year-over-year growth 2022-2027 (%)
- Exhibit 72: Data Table on North America – Year-over-year growth 2022-2027 (%)
- 9.4 Asia – Market size and forecast 2022-2027
- Exhibit 73: Chart on Asia – Market size and forecast 2022-2027 ($ million)
- Exhibit 74: Data Table on Asia – Market size and forecast 2022-2027 ($ million)
- Exhibit 75: Chart on Asia – Year-over-year growth 2022-2027 (%)
- Exhibit 76: Data Table on Asia – Year-over-year growth 2022-2027 (%)
- 9.5 Europe – Market size and forecast 2022-2027
- Exhibit 77: Chart on Europe – Market size and forecast 2022-2027 ($ million)
- Exhibit 78: Data Table on Europe – Market size and forecast 2022-2027 ($ million)
- Exhibit 79: Chart on Europe – Year-over-year growth 2022-2027 (%)
- Exhibit 80: Data Table on Europe – Year-over-year growth 2022-2027 (%)
- 9.6 Rest of World (ROW) – Market size and forecast 2022-2027
- Exhibit 81: Chart on Rest of World (ROW) – Market size and forecast 2022-2027 ($ million)
- Exhibit 82: Data Table on Rest of World (ROW) – Market size and forecast 2022-2027 ($ million)
- Exhibit 83: Chart on Rest of World (ROW) – Year-over-year growth 2022-2027 (%)
- Exhibit 84: Data Table on Rest of World (ROW) – Year-over-year growth 2022-2027 (%)
- 9.7 US – Market size and forecast 2022-2027
- Exhibit 85: Chart on US – Market size and forecast 2022-2027 ($ million)
- Exhibit 86: Data Table on US – Market size and forecast 2022-2027 ($ million)
- Exhibit 87: Chart on US – Year-over-year growth 2022-2027 (%)
- Exhibit 88: Data Table on US – Year-over-year growth 2022-2027 (%)
- 9.8 China – Market size and forecast 2022-2027
- Exhibit 89: Chart on China – Market size and forecast 2022-2027 ($ million)
- Exhibit 90: Data Table on China – Market size and forecast 2022-2027 ($ million)
- Exhibit 91: Chart on China – Year-over-year growth 2022-2027 (%)
- Exhibit 92: Data Table on China – Year-over-year growth 2022-2027 (%)
- 9.9 Germany – Market size and forecast 2022-2027
- Exhibit 93: Chart on Germany – Market size and forecast 2022-2027 ($ million)
- Exhibit 94: Data Table on Germany – Market size and forecast 2022-2027 ($ million)
- Exhibit 95: Chart on Germany – Year-over-year growth 2022-2027 (%)
- Exhibit 96: Data Table on Germany – Year-over-year growth 2022-2027 (%)
- 9.10 Japan – Market size and forecast 2022-2027
- Exhibit 97: Chart on Japan – Market size and forecast 2022-2027 ($ million)
- Exhibit 98: Data Table on Japan – Market size and forecast 2022-2027 ($ million)
- Exhibit 99: Chart on Japan – Year-over-year growth 2022-2027 (%)
- Exhibit 100: Data Table on Japan – Year-over-year growth 2022-2027 (%)
- 9.11 India – Market size and forecast 2022-2027
- Exhibit 101: Chart on India – Market size and forecast 2022-2027 ($ million)
- Exhibit 102: Data Table on India – Market size and forecast 2022-2027 ($ million)
- Exhibit 103: Chart on India – Year-over-year growth 2022-2027 (%)
- Exhibit 104: Data Table on India – Year-over-year growth 2022-2027 (%)
- 9.12 Market opportunity by geography
- Exhibit 105: Market opportunity by geography ($ million)
10 Drivers, Challenges, and Trends
- 10.3 Impact of drivers and challenges
- Exhibit 106: Impact of drivers and challenges in 2022 and 2027
11 Vendor Landscape
- 11.2 Vendor landscape
- Exhibit 107: Overview on Criticality of inputs and Factors of differentiation
- 11.3 Landscape disruption
- Exhibit 108: Overview on factors of disruption
- 11.4 Industry risks
- Exhibit 109: Impact of key risks on business
12 Vendor Analysis
- 12.1 Vendors covered
- Exhibit 110: Vendors covered
- 12.2 Market positioning of vendors
- Exhibit 111: Matrix on vendor position and classification
- 12.3 Benchmark Electronics Inc.
- Exhibit 112: Benchmark Electronics Inc. – Overview
- Exhibit 113: Benchmark Electronics Inc. – Business segments
- Exhibit 114: Benchmark Electronics Inc. – Key news
- Exhibit 115: Benchmark Electronics Inc. – Key offerings
- Exhibit 116: Benchmark Electronics Inc. – Segment focus
- 12.4 Cadence Inc.
- Exhibit 117: Cadence Inc. – Overview
- Exhibit 118: Cadence Inc. – Product / Service
- Exhibit 119: Cadence Inc. – Key offerings
- 12.5 Celestica Inc.
- Exhibit 120: Celestica Inc. – Overview
- Exhibit 121: Celestica Inc. – Business segments
- Exhibit 122: Celestica Inc. – Key news
- Exhibit 123: Celestica Inc. – Key offerings
- Exhibit 124: Celestica Inc. – Segment focus
- 12.6 Cirtec Medical
- Exhibit 125: Cirtec Medical – Overview
- Exhibit 126: Cirtec Medical – Product / Service
- Exhibit 127: Cirtec Medical – Key offerings
- 12.7 Eurofins Scientific SE
- Exhibit 128: Eurofins Scientific SE – Overview
- Exhibit 129: Eurofins Scientific SE – Business segments
- Exhibit 130: Eurofins Scientific SE – Key news
- Exhibit 131: Eurofins Scientific SE – Key offerings
- Exhibit 132: Eurofins Scientific SE – Segment focus
- 12.8 Flex Ltd.
- Exhibit 133: Flex Ltd. – Overview
- Exhibit 134: Flex Ltd. – Business segments
- Exhibit 135: Flex Ltd. – Key news
- Exhibit 136: Flex Ltd. – Key offerings
- Exhibit 137: Flex Ltd. – Segment focus
- 12.9 Gerresheimer AG
- Exhibit 138: Gerresheimer AG – Overview
- Exhibit 139: Gerresheimer AG – Business segments
- Exhibit 140: Gerresheimer AG – Key news
- Exhibit 141: Gerresheimer AG – Key offerings
- Exhibit 142: Gerresheimer AG – Segment focus
- 12.10 Heraeus Holding GmbH
- Exhibit 143: Heraeus Holding GmbH – Overview
- Exhibit 144: Heraeus Holding GmbH – Product / Service
- Exhibit 145: Heraeus Holding GmbH – Key offerings
- 12.11 Integer Holdings Corp.
- Exhibit 146: Integer Holdings Corp. – Overview
- Exhibit 147: Integer Holdings Corp. – Business segments
- Exhibit 148: Integer Holdings Corp. – Key news
- Exhibit 149: Integer Holdings Corp. – Key offerings
- Exhibit 150: Integer Holdings Corp. – Segment focus
- 12.12 Jabil Inc.
- Exhibit 151: Jabil Inc. – Overview
- Exhibit 152: Jabil Inc. – Business segments
- Exhibit 153: Jabil Inc. – Key offerings
- Exhibit 154: Jabil Inc. – Segment focus
- 12.13 Nortech Systems Inc.
- Exhibit 155: Nortech Systems Inc. – Overview
- Exhibit 156: Nortech Systems Inc. – Business segments
- Exhibit 157: Nortech Systems Inc. – Key offerings
- Exhibit 158: Nortech Systems Inc. – Segment focus
- 12.14 Sanmina Corp.
- Exhibit 159: Sanmina Corp. – Overview
- Exhibit 160: Sanmina Corp. – Business segments
- Exhibit 161: Sanmina Corp. – Key offerings
- Exhibit 162: Sanmina Corp. – Segment focus
- 12.15 TE Connectivity Ltd.
- Exhibit 163: TE Connectivity Ltd. – Overview
- Exhibit 164: TE Connectivity Ltd. – Business segments
- Exhibit 165: TE Connectivity Ltd. – Key offerings
- Exhibit 166: TE Connectivity Ltd. – Segment focus
- 12.16 Tecomet Inc.
- Exhibit 167: Tecomet Inc. – Overview
- Exhibit 168: Tecomet Inc. – Product / Service
- Exhibit 169: Tecomet Inc. – Key offerings
- 12.17 West Pharmaceutical Services Inc.
- Exhibit 170: West Pharmaceutical Services Inc. – Overview
- Exhibit 171: West Pharmaceutical Services Inc. – Business segments
- Exhibit 172: West Pharmaceutical Services Inc. – Key news
- Exhibit 173: West Pharmaceutical Services Inc. – Key offerings
- Exhibit 174: West Pharmaceutical Services Inc. – Segment focus
13 Appendix
- 13.1 Scope of the report
- 13.2 Inclusions and exclusions checklist
- Exhibit 175: Inclusions checklist
- Exhibit 176: Exclusions checklist
- 13.3 Currency conversion rates for US$
- Exhibit 177: Currency conversion rates for US$
- 13.4 Research methodology
- Exhibit 178: Research methodology
- Exhibit 179: Validation techniques employed for market sizing
- Exhibit 180: Information sources
- 13.5 List of abbreviations
- Exhibit 181: List of abbreviations
About Us
Technavio is a leading global technology research and advisory company. Their research and analysis focuses on emerging market trends and provides actionable insights to help businesses identify market opportunities and develop effective strategies to optimize their market positions. With over 500 specialized analysts, Technavio’s report library consists of more than 17,000 reports and counting, covering 800 technologies, spanning across 50 countries. Their client base consists of enterprises of all sizes, including more than 100 Fortune 500 companies. This growing client base relies on Technavio’s comprehensive coverage, extensive research, and actionable market insights to identify opportunities in existing and potential markets and assess their competitive positions within changing market scenarios.
Contact
Technavio Research
Jesse Maida
Media & Marketing Executive
US: +1 844 364 1100
UK: +44 203 893 3200
Email: [email protected]
Website: www.technavio.com/
Newsroom:
SOURCE Technavio
