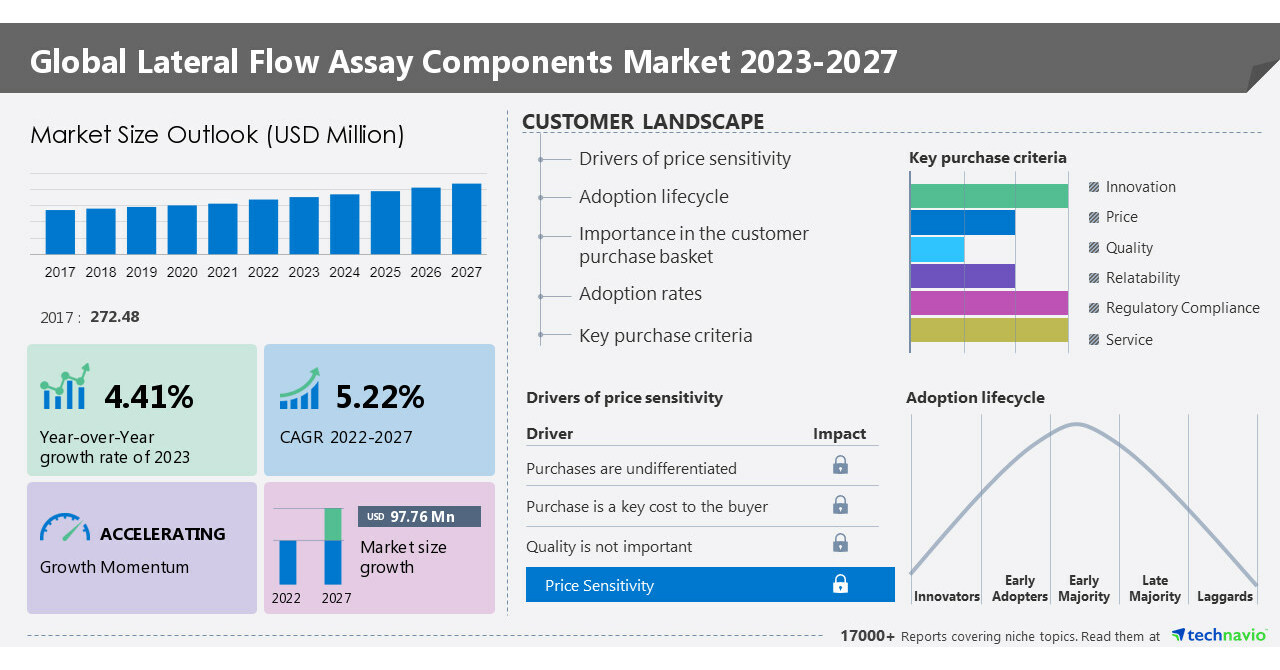
NEW YORK, May 16, 2023 /PRNewswire/ — The lateral flow assay components market size is set to grow by USD 97.76 million from 2022 to 2027 progressing at a CAGR of 5.22% during the forecast period. The report offers an up-to-date analysis regarding the current global market scenario, the latest trends and drivers, and the overall market environment. The market is driven by rising efforts in research and development. Rising early diagnosis needs will increase the demand for conducting research activities, promoting market growth.
Here is an Exclusive report talking about Market scenarios with a historical period (2017-2021) and a forecast period (2023-2027). Download Sample Report in minutes!
The report on the lateral flow assay components market provides a holistic update, market size and forecast, trends, growth drivers, and challenges, as well as vendor analysis.
Lateral Flow Assay Components Market 2023-2027 – Market Dynamics
Market Driver
- Rising efforts in research and development
- Technological advancement
- Growing usage of home-based lateral flow assay devices
Market Trend
- Growing demand for point-of-care (POC) testing
- Evolving application of lateral flow assays
- Increasing public and private investment to develop lateral flow assays
Market Challenge
- Increase in regulations and inconsistency in test results
- Availability of alternative diagnostics technologies
- Requirement of specialized storage and shipping facilities for membrane
Lateral Flow Assay Components Market 2023-2027: Market Segmentation
The lateral flow assay components market analysis is segmented by technique (sandwich assays, competitive assays, and multiplex detection assays), end-user (medical device manufacturing companies and medical device contract manufacturing companies), and geography (North America, Europe, Asia, and Rest of World (ROW)). This study identifies the growing demand for point-of-care (POC) testing, the evolving application of lateral flow assays, and the increasing public and private investment to develop lateral flow assays as one of the prime reasons driving the lateral flow assay components market growth during the next few years.
Based on technique, the market is segmented into sandwich assays, competitive assays, and multiplex detection assays. The market share growth by the sandwich assays segment will be significant during the forecast period. North America is expected to account for 43% of market growth by 2023.
Insights on the market contribution of various segments, including country- and region-wise data, historic data (2017 to 2021), and forecast market size (2023 to 2027) – View Sample Report
The lateral flow assay components market covers the following areas:
Lateral Flow Assay Components Market Sizing
Lateral Flow Assay Components Market Forecast
Lateral Flow Assay Components Market Analysis
Companies Mentioned
- Abbott Laboratories
- Ahlstrom Munksjo
- AXIVA SICHEM Pvt. Ltd.
- Becton Dickinson and Co.
- Bio Rad Laboratories Inc.
- Bio Techne Corp.
- DxDiscovery Inc.
- F. Hoffmann La Roche Ltd.
- Geno Technology Inc.
- Hologic Inc.
- Merck KGaA
- Nupore Filtration System
- PerkinElmer Inc.
- Porex Corp.
- QIAGEN NV
- Quidel Corp.
- Sartorius AG
- Siemens AG
- Thermo Fisher Scientific Inc.
- Cytodiagnostics Inc.
abbott.com- The company offers lateral flow assay component namely DIGIVAL.
ahlstrom.com- The company offers lateral flow assay components such as CytoSep single layer plasma separation media.
bio-rad.com- The company offers lateral flow assay components such as Bio-Rad protein assay.
Related Reports:
Diabetes Management Devices Market– The diabetes management devices market size is estimated to grow at a CAGR of 8.18% between 2022 and 2027. The market size is forecast to increase by USD 10.9 billion.
Blood Glucose Monitoring Devices Market– The blood glucose monitoring devices market size is estimated to grow at a CAGR of 8.88% between 2022 and 2027. The market size is forecast to increase by USD 7,488.81 million.
Register for a free trial today and gain instant access to 17,000+ market research reports.
Technavio’s SUBSCRIPTION platform
|
Lateral Flow Assay Components Market Scope |
|
|
Report Coverage |
Details |
|
Base year |
2022 |
|
Historic period |
2017-2021 |
|
Forecast period |
2023-2027 |
|
Growth momentum & CAGR |
Accelerate at a CAGR of 5.22% |
|
Market growth 2023-2027 |
USD 97.76 million |
|
Market structure |
Fragmented |
|
YoY growth 2022-2023(%) |
4.41 |
|
Regional analysis |
North America, Europe, Asia, and Rest of World (ROW) |
|
Performing market contribution |
North America at 43% |
|
Key countries |
US, Canada, Germany, UK, and China |
|
Competitive landscape |
Leading Vendors, Market Positioning of Vendors, Competitive Strategies, and Industry Risks |
|
Key companies profiled |
Abbott Laboratories, Ahlstrom Munksjo, AXIVA SICHEM Pvt. Ltd., Becton Dickinson and Co., Bio Rad Laboratories Inc., Bio Techne Corp., DxDiscovery Inc., F. Hoffmann La Roche Ltd., Geno Technology Inc., Hologic Inc., Merck KGaA, Nupore Filtration System, PerkinElmer Inc., Porex Corp., QIAGEN NV, Quidel Corp., Sartorius AG, Siemens AG, Thermo Fisher Scientific Inc., and Cytodiagnostics Inc. |
|
Market dynamics |
Parent market analysis, Market growth inducers and obstacles, Fast-growing and slow-growing segment analysis, COVID-19 impact and recovery analysis and future consumer dynamics, Market condition analysis for forecast period |
|
Customization purview |
If our report has not included the data that you are looking for, you can reach out to our analysts and get segments customized. |
Key Topics Covered:
1 Executive Summary
- 1.1 Market overview
- Exhibit 01: Executive Summary – Chart on Market Overview
- Exhibit 02: Executive Summary – Data Table on Market Overview
- Exhibit 03: Executive Summary – Chart on Global Market Characteristics
- Exhibit 04: Executive Summary – Chart on Market by Geography
- Exhibit 05: Executive Summary – Chart on Market Segmentation by Technique
- Exhibit 06: Executive Summary – Chart on Market Segmentation by End-user
- Exhibit 07: Executive Summary – Chart on Incremental Growth
- Exhibit 08: Executive Summary – Data Table on Incremental Growth
- Exhibit 09: Executive Summary – Chart on Vendor Market Positioning
2 Market Landscape
- 2.1 Market ecosystem
- Exhibit 10: Parent market
- Exhibit 11: Market Characteristics
3 Market Sizing
- 3.1 Market definition
- Exhibit 12: Offerings of vendors included in the market definition
- 3.2 Market segment analysis
- Exhibit 13: Market segments
- 3.4 Market outlook: Forecast for 2022-2027
- Exhibit 14: Chart on Global – Market size and forecast 2022-2027 ($ million)
- Exhibit 15: Data Table on Global – Market size and forecast 2022-2027 ($ million)
- Exhibit 16: Chart on Global Market: Year-over-year growth 2022-2027 (%)
- Exhibit 17: Data Table on Global Market: Year-over-year growth 2022-2027 (%)
4 Historic Market Size
- 4.1 Global Lateral Flow Assay Components Market 2017 – 2021
- Exhibit 18: Historic Market Size – Data Table on Global Lateral Flow Assay Components Market 2017 – 2021 ($ million)
- 4.2 Technique Segment Analysis 2017 – 2021
- Exhibit 19: Historic Market Size – Technique Segment 2017 – 2021 ($ million)
- 4.3 End user Segment Analysis 2017 – 2021
- Exhibit 20: Historic Market Size – End user Segment 2017 – 2021 ($ million)
- 4.4 Geography Segment Analysis 2017 – 2021
- Exhibit 21: Historic Market Size – Geography Segment 2017 – 2021 ($ million)
- 4.5 Country Segment Analysis 2017 – 2021
- Exhibit 22: Historic Market Size – Country Segment 2017 – 2021 ($ million)
5 Five Forces Analysis
- 5.1 Five forces summary
- Exhibit 23: Five forces analysis – Comparison between 2022 and 2027
- 5.2 Bargaining power of buyers
- Exhibit 24: Chart on Bargaining power of buyers – Impact of key factors 2022 and 2027
- 5.3 Bargaining power of suppliers
- Exhibit 25: Bargaining power of suppliers – Impact of key factors in 2022 and 2027
- 5.4 Threat of new entrants
- Exhibit 26: Threat of new entrants – Impact of key factors in 2022 and 2027
- 5.5 Threat of substitutes
- Exhibit 27: Threat of substitutes – Impact of key factors in 2022 and 2027
- 5.6 Threat of rivalry
- Exhibit 28: Threat of rivalry – Impact of key factors in 2022 and 2027
- 5.7 Market condition
- Exhibit 29: Chart on Market condition – Five forces 2022 and 2027
6 Market Segmentation by Technique
- 6.1 Market segments
- Exhibit 30: Chart on Technique – Market share 2022-2027 (%)
- Exhibit 31: Data Table on Technique – Market share 2022-2027 (%)
- 6.2 Comparison by Technique
- Exhibit 32: Chart on Comparison by Technique
- Exhibit 33: Data Table on Comparison by Technique
- 6.3 Sandwich assays – Market size and forecast 2022-2027
- Exhibit 34: Chart on Sandwich assays – Market size and forecast 2022-2027 ($ million)
- Exhibit 35: Data Table on Sandwich assays – Market size and forecast 2022-2027 ($ million)
- Exhibit 36: Chart on Sandwich assays – Year-over-year growth 2022-2027 (%)
- Exhibit 37: Data Table on Sandwich assays – Year-over-year growth 2022-2027 (%)
- 6.4 Competitive assays – Market size and forecast 2022-2027
- Exhibit 38: Chart on Competitive assays – Market size and forecast 2022-2027 ($ million)
- Exhibit 39: Data Table on Competitive assays – Market size and forecast 2022-2027 ($ million)
- Exhibit 40: Chart on Competitive assays – Year-over-year growth 2022-2027 (%)
- Exhibit 41: Data Table on Competitive assays – Year-over-year growth 2022-2027 (%)
- 6.5 Multiplex detection assays – Market size and forecast 2022-2027
- Exhibit 42: Chart on Multiplex detection assays – Market size and forecast 2022-2027 ($ million)
- Exhibit 43: Data Table on Multiplex detection assays – Market size and forecast 2022-2027 ($ million)
- Exhibit 44: Chart on Multiplex detection assays – Year-over-year growth 2022-2027 (%)
- Exhibit 45: Data Table on Multiplex detection assays – Year-over-year growth 2022-2027 (%)
- 6.6 Market opportunity by Technique
- Exhibit 46: Market opportunity by Technique ($ million)
7 Market Segmentation by End-user
- 7.1 Market segments
- Exhibit 47: Chart on End-user – Market share 2022-2027 (%)
- Exhibit 48: Data Table on End-user – Market share 2022-2027 (%)
- 7.2 Comparison by End-user
- Exhibit 49: Chart on Comparison by End-user
- Exhibit 50: Data Table on Comparison by End-user
- 7.3 Medical device manufacturing companies – Market size and forecast 2022-2027
- Exhibit 51: Chart on Medical device manufacturing companies – Market size and forecast 2022-2027 ($ million)
- Exhibit 52: Data Table on Medical device manufacturing companies – Market size and forecast 2022-2027 ($ million)
- Exhibit 53: Chart on Medical device manufacturing companies – Year-over-year growth 2022-2027 (%)
- Exhibit 54: Data Table on Medical device manufacturing companies – Year-over-year growth 2022-2027 (%)
- 7.4 Medical device contract manufacturing companies – Market size and forecast 2022-2027
- Exhibit 55: Chart on Medical device contract manufacturing companies – Market size and forecast 2022-2027 ($ million)
- Exhibit 56: Data Table on Medical device contract manufacturing companies – Market size and forecast 2022-2027 ($ million)
- Exhibit 57: Chart on Medical device contract manufacturing companies – Year-over-year growth 2022-2027 (%)
- Exhibit 58: Data Table on Medical device contract manufacturing companies – Year-over-year growth 2022-2027 (%)
- 7.5 Market opportunity by End-user
- Exhibit 59: Market opportunity by End-user ($ million)
8 Customer Landscape
- 8.1 Customer landscape overview
- Exhibit 60: Analysis of price sensitivity, lifecycle, customer purchase basket, adoption rates, and purchase criteria
9 Geographic Landscape
- 9.1 Geographic segmentation
- Exhibit 61: Chart on Market share by geography 2022-2027 (%)
- Exhibit 62: Data Table on Market share by geography 2022-2027 (%)
- 9.2 Geographic comparison
- Exhibit 63: Chart on Geographic comparison
- Exhibit 64: Data Table on Geographic comparison
- 9.3 North America – Market size and forecast 2022-2027
- Exhibit 65: Chart on North America – Market size and forecast 2022-2027 ($ million)
- Exhibit 66: Data Table on North America – Market size and forecast 2022-2027 ($ million)
- Exhibit 67: Chart on North America – Year-over-year growth 2022-2027 (%)
- Exhibit 68: Data Table on North America – Year-over-year growth 2022-2027 (%)
- 9.4 Europe – Market size and forecast 2022-2027
- Exhibit 69: Chart on Europe – Market size and forecast 2022-2027 ($ million)
- Exhibit 70: Data Table on Europe – Market size and forecast 2022-2027 ($ million)
- Exhibit 71: Chart on Europe – Year-over-year growth 2022-2027 (%)
- Exhibit 72: Data Table on Europe – Year-over-year growth 2022-2027 (%)
- 9.5 Asia – Market size and forecast 2022-2027
- Exhibit 73: Chart on Asia – Market size and forecast 2022-2027 ($ million)
- Exhibit 74: Data Table on Asia – Market size and forecast 2022-2027 ($ million)
- Exhibit 75: Chart on Asia – Year-over-year growth 2022-2027 (%)
- Exhibit 76: Data Table on Asia – Year-over-year growth 2022-2027 (%)
- 9.6 Rest of World (ROW) – Market size and forecast 2022-2027
- Exhibit 77: Chart on Rest of World (ROW) – Market size and forecast 2022-2027 ($ million)
- Exhibit 78: Data Table on Rest of World (ROW) – Market size and forecast 2022-2027 ($ million)
- Exhibit 79: Chart on Rest of World (ROW) – Year-over-year growth 2022-2027 (%)
- Exhibit 80: Data Table on Rest of World (ROW) – Year-over-year growth 2022-2027 (%)
- 9.7 US – Market size and forecast 2022-2027
- Exhibit 81: Chart on US – Market size and forecast 2022-2027 ($ million)
- Exhibit 82: Data Table on US – Market size and forecast 2022-2027 ($ million)
- Exhibit 83: Chart on US – Year-over-year growth 2022-2027 (%)
- Exhibit 84: Data Table on US – Year-over-year growth 2022-2027 (%)
- 9.8 Germany – Market size and forecast 2022-2027
- Exhibit 85: Chart on Germany – Market size and forecast 2022-2027 ($ million)
- Exhibit 86: Data Table on Germany – Market size and forecast 2022-2027 ($ million)
- Exhibit 87: Chart on Germany – Year-over-year growth 2022-2027 (%)
- Exhibit 88: Data Table on Germany – Year-over-year growth 2022-2027 (%)
- 9.9 UK – Market size and forecast 2022-2027
- Exhibit 89: Chart on UK – Market size and forecast 2022-2027 ($ million)
- Exhibit 90: Data Table on UK – Market size and forecast 2022-2027 ($ million)
- Exhibit 91: Chart on UK – Year-over-year growth 2022-2027 (%)
- Exhibit 92: Data Table on UK – Year-over-year growth 2022-2027 (%)
- 9.10 China – Market size and forecast 2022-2027
- Exhibit 93: Chart on China – Market size and forecast 2022-2027 ($ million)
- Exhibit 94: Data Table on China – Market size and forecast 2022-2027 ($ million)
- Exhibit 95: Chart on China – Year-over-year growth 2022-2027 (%)
- Exhibit 96: Data Table on China – Year-over-year growth 2022-2027 (%)
- 9.11 Canada – Market size and forecast 2022-2027
- Exhibit 97: Chart on Canada – Market size and forecast 2022-2027 ($ million)
- Exhibit 98: Data Table on Canada – Market size and forecast 2022-2027 ($ million)
- Exhibit 99: Chart on Canada – Year-over-year growth 2022-2027 (%)
- Exhibit 100: Data Table on Canada – Year-over-year growth 2022-2027 (%)
- 9.12 Market opportunity by geography
- Exhibit 101: Market opportunity by geography ($ million)
10 Drivers, Challenges, and Trends
- 10.3 Impact of drivers and challenges
- Exhibit 102: Impact of drivers and challenges in 2022 and 2027
11 Vendor Landscape
- 11.2 Vendor landscape
- Exhibit 103: Overview on Criticality of inputs and Factors of differentiation
- 11.3 Landscape disruption
- Exhibit 104: Overview on factors of disruption
- 11.4 Industry risks
- Exhibit 105: Impact of key risks on business
12 Vendor Analysis
- 12.1 Vendors covered
- Exhibit 106: Vendors covered
- 12.2 Market positioning of vendors
- Exhibit 107: Matrix on vendor position and classification
- 12.3 Abbott Laboratories
- Exhibit 108: Abbott Laboratories – Overview
- Exhibit 109: Abbott Laboratories – Business segments
- Exhibit 110: Abbott Laboratories – Key news
- Exhibit 111: Abbott Laboratories – Key offerings
- Exhibit 112: Abbott Laboratories – Segment focus
- 12.4 Ahlstrom Munksjo
- Exhibit 113: Ahlstrom Munksjo – Overview
- Exhibit 114: Ahlstrom Munksjo – Business segments
- Exhibit 115: Ahlstrom Munksjo – Key news
- Exhibit 116: Ahlstrom Munksjo – Key offerings
- Exhibit 117: Ahlstrom Munksjo – Segment focus
- 12.5 Becton Dickinson and Co.
- Exhibit 118: Becton Dickinson and Co. – Overview
- Exhibit 119: Becton Dickinson and Co. – Business segments
- Exhibit 120: Becton Dickinson and Co. – Key news
- Exhibit 121: Becton Dickinson and Co. – Key offerings
- Exhibit 122: Becton Dickinson and Co. – Segment focus
- 12.6 Bio Rad Laboratories Inc.
- Exhibit 123: Bio Rad Laboratories Inc. – Overview
- Exhibit 124: Bio Rad Laboratories Inc. – Business segments
- Exhibit 125: Bio Rad Laboratories Inc. – Key news
- Exhibit 126: Bio Rad Laboratories Inc. – Key offerings
- Exhibit 127: Bio Rad Laboratories Inc. – Segment focus
- 12.7 Bio Techne Corp.
- Exhibit 128: Bio Techne Corp. – Overview
- Exhibit 129: Bio Techne Corp. – Business segments
- Exhibit 130: Bio Techne Corp. – Key news
- Exhibit 131: Bio Techne Corp. – Key offerings
- Exhibit 132: Bio Techne Corp. – Segment focus
- 12.8 F. Hoffmann La Roche Ltd.
- Exhibit 133: F. Hoffmann La Roche Ltd. – Overview
- Exhibit 134: F. Hoffmann La Roche Ltd. – Business segments
- Exhibit 135: F. Hoffmann La Roche Ltd. – Key news
- Exhibit 136: F. Hoffmann La Roche Ltd. – Key offerings
- Exhibit 137: F. Hoffmann La Roche Ltd. – Segment focus
- 12.9 Geno Technology Inc.
- Exhibit 138: Geno Technology Inc. – Overview
- Exhibit 139: Geno Technology Inc. – Product / Service
- Exhibit 140: Geno Technology Inc. – Key offerings
- 12.10 Hologic Inc.
- Exhibit 141: Hologic Inc. – Overview
- Exhibit 142: Hologic Inc. – Business segments
- Exhibit 143: Hologic Inc. – Key news
- Exhibit 144: Hologic Inc. – Key offerings
- Exhibit 145: Hologic Inc. – Segment focus
- 12.11 Merck KGaA
- Exhibit 146: Merck KGaA – Overview
- Exhibit 147: Merck KGaA – Business segments
- Exhibit 148: Merck KGaA – Key news
- Exhibit 149: Merck KGaA – Key offerings
- Exhibit 150: Merck KGaA – Segment focus
- 12.12 PerkinElmer Inc.
- Exhibit 151: PerkinElmer Inc. – Overview
- Exhibit 152: PerkinElmer Inc. – Business segments
- Exhibit 153: PerkinElmer Inc. – Key news
- Exhibit 154: PerkinElmer Inc. – Key offerings
- Exhibit 155: PerkinElmer Inc. – Segment focus
- 12.13 QIAGEN NV
- Exhibit 156: QIAGEN NV – Overview
- Exhibit 157: QIAGEN NV – Product / Service
- Exhibit 158: QIAGEN NV – Key news
- Exhibit 159: QIAGEN NV – Key offerings
- 12.14 Quidel Corp.
- Exhibit 160: Quidel Corp. – Overview
- Exhibit 161: Quidel Corp. – Product / Service
- Exhibit 162: Quidel Corp. – Key offerings
- 12.15 Sartorius AG
- Exhibit 163: Sartorius AG – Overview
- Exhibit 164: Sartorius AG – Business segments
- Exhibit 165: Sartorius AG – Key news
- Exhibit 166: Sartorius AG – Key offerings
- Exhibit 167: Sartorius AG – Segment focus
- 12.16 Siemens AG
- Exhibit 168: Siemens AG – Overview
- Exhibit 169: Siemens AG – Business segments
- Exhibit 170: Siemens AG – Key news
- Exhibit 171: Siemens AG – Key offerings
- Exhibit 172: Siemens AG – Segment focus
- 12.17 Thermo Fisher Scientific Inc.
- Exhibit 173: Thermo Fisher Scientific Inc. – Overview
- Exhibit 174: Thermo Fisher Scientific Inc. – Business segments
- Exhibit 175: Thermo Fisher Scientific Inc. – Key news
- Exhibit 176: Thermo Fisher Scientific Inc. – Key offerings
- Exhibit 177: Thermo Fisher Scientific Inc. – Segment focus
13 Appendix
- 13.1 Scope of the report
- 13.2 Inclusions and exclusions checklist
- Exhibit 178: Inclusions checklist
- Exhibit 179: Exclusions checklist
- 13.3 Currency conversion rates for US$
- Exhibit 180: Currency conversion rates for US$
- 13.4 Research methodology
- Exhibit 181: Research methodology
- Exhibit 182: Validation techniques employed for market sizing
- Exhibit 183: Information sources
- 13.5 List of abbreviations
- Exhibit 184: List of abbreviations
About Us
Technavio is a leading global technology research and advisory company. Their research and analysis focuses on emerging market trends and provides actionable insights to help businesses identify market opportunities and develop effective strategies to optimize their market positions. With over 500 specialized analysts, Technavio’s report library consists of more than 17,000 reports and counting, covering 800 technologies, spanning across 50 countries. Their client base consists of enterprises of all sizes, including more than 100 Fortune 500 companies. This growing client base relies on Technavio’s comprehensive coverage, extensive research, and actionable market insights to identify opportunities in existing and potential markets and assess their competitive positions within changing market scenarios.
Contact
Technavio Research
Jesse Maida
Media & Marketing Executive
US: +1 844 364 1100
UK: +44 203 893 3200
Email: [email protected]
Website: www.technavio.com/
SOURCE Technavio
