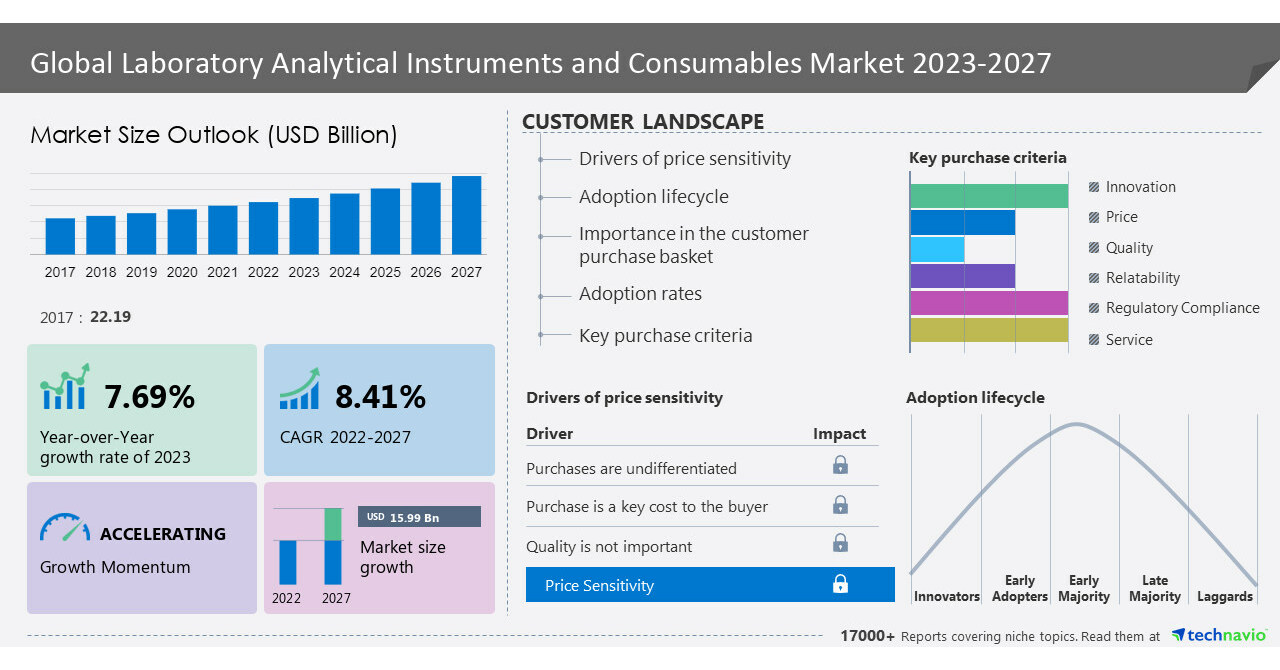
NEW YORK, May 12, 2023 /PRNewswire/ — The global laboratory analytical instruments and consumables market size is estimated to increase by USD 15.99 billion from 2022 to 2027. The market’s growth momentum will progress at a CAGR of 8.41% during the forecast period. The high prevalence of infectious diseases significantly drives the laboratory analytical instruments and consumables market growth. The rising prevalence of infectious diseases is expected to spur market growth because it increases the need for disease awareness initiatives. Awareness campaigns to recognize the signs and symptoms of infectious diseases and how to prevent them play an important role in preventing the spread of infectious diseases. Infectious diseases are due to the effect of organisms such as bacteria, viruses, fungi, and parasites. Hence, pathogens such as viruses, bacteria, and parasites are involved in the development of infectious diseases such as tuberculosis, malaria, and hepatitis. Discover some insights on the market size historic period (2017 to 2021) and Forecast 2023-2027 before buying the full report -Request a sample report
Laboratory analytical instruments and consumables market – Vendor Analysis
Vendor Landscape – The global laboratory analytical instruments and consumables market is fragmented, with the presence of several global as well as regional vendors. A few prominent vendors that offer laboratory analytical instruments and consumables in the market are ABB Ltd., Agilent Technologies Inc., AMETEK Inc., AMS Technologies AG, Bio Rad Laboratories Inc., Bruker Corp., Chemglass Inc., Cole Parmer Instrument Co. LLC, Danaher Corp., Endress Hauser Group Services AG, Eurofins Scientific SE, Foss, Harvard Bioscience Inc., Helena Laboratories Corp., Hitachi Ltd., Perkin Elmer Inc., Process Insights Inc., Shimadzu Corp., Thermo Fisher Scientific Inc., and Waters Corp. and others.
What’s New? –
- Special coverage on the Russia–Ukraine war; global inflation; recovery analysis from COVID-19; supply chain disruptions, global trade tensions; and risk of recession
- Global competitiveness and key competitor positions
- Market presence across multiple geographical footprints – Strong/Active/Niche/Trivial – Buy the report!
Vendor Offerings –
- ABB Ltd. – The company offers laboratory analytical instruments and consumables such as Sensi single analyzer.
- AMS Technologies AG – The company offers laboratory analytical instruments and consumables such as receptacle-style collimators.
- Bio Rad Laboratories Inc. – The company offers laboratory analytical instruments and consumables such as digital PCR assays.
- For details on the vendor and their offerings – Request a sample report
Laboratory Analytical Instruments And Consumables Market – Segmentation Assessment
Segment Overview
This laboratory analytical instruments and consumables market report extensively covers market segmentation by application (element analysis, separation analysis, and molecular analysis), product (laboratory analytical instruments and consumables), and geography (North America, Europe, Asia, and the Rest of the World (ROW)).
- The market share growth by the element analysis segment will be significant for overall market growth during the forecast period. Elemental analysis can be both quantitative and qualitative in nature and identification of trace minerals is important for products to meet regulatory standards and be certified as high-quality products. These instruments and consumables are primarily used in the chemical, environmental, metals, and pharmaceutical industries. For instance, in the environmental field, elemental analyzers with associated required consumables are applied to determine the elemental composition of minerals that are important for understanding the Earth’s geological processes.
Geography Overview
By geography, the global laboratory analytical instruments and consumables market is segmented into North America, Europe, Asia, and the Rest of the World (ROW). The report provides actionable insights and estimates the contribution of all regions to the growth of the global laboratory analytical instruments and consumables market.
- North America is estimated to account for 35% of the global market growth during the forecast period. Demand for laboratory analytical instruments and consumables is high in the region, which is due to heavy US investment in healthcare research and testing. Strong distribution networks in countries like the US and Canada and the growing interest of pharmaceutical companies in drug research and development drive the growth of the market. The presence of industry leaders in laboratory automation in countries such as the US also boosts market growth during the forecast period. The number of research projects in the US is increasing due to the recognition of the high potential of regenerative medicine. Hence, such factors influence the growth of the regional market during the forecast period.
For insights on global, regional, and country-level parameters with growth opportunities
from 2017 to 2027 – Download a Sample Report
Laboratory Analytical Instruments And Consumables Market – Market Dynamics
Key Trends –
- The rising number of applications for analytical instruments is a major trend influencing the laboratory analytical instruments and consumables market growth.
- Due to the introduction of several new technologies, products, and markets, the applications of analytical laboratory equipment and consumables increase more than ever.
- Laboratory analytical instruments are used in multiple applications, which include analytical chemistry, clinical analysis, environmental testing, F&B analysis, and forensic analysis.
- Moreover, each technology that accommodates growing applications opens up possibilities for analytical lab equipment and consumables.
- Hence, the ever-increasing number of applications that use laboratory analytical instruments and consumables for specific purposes will lead to an increase in the acceptance of these solutions. This will have a positive impact on consumption and sales, leading to a rise in the market during the forecast.
Major challenges –
- The lack of trained laboratory professionals challenges the laboratory analytical instruments and consumables market growth.
- Processes associated with pharmaceutical manufacturing require great care in sample and reagent application and device handling.
- In addition, the interpretation of results is becoming increasingly important, requiring researchers to be clear about the analysis they are performing and how it relates to the overall goals of the experiment.
- For instance, before starting the protein crystallization process, researchers must consider the molecular weight of the protein, the buffers required for the experiment, and the stability of the protein, maximizing the primary sequence.
- Thus, researchers should pay attention to several factors for successful research experiments. It is very important for the operator to be meticulous during the procedure.
- Hence, such challenges impede the market growth of the laboratory analytical instruments and consumable market.
Driver, Trend & Challenges are the factor of market dynamics that states about
consequences & sustainability of the businesses, find some insights from a sample
report!
What are the key data covered in this Laboratory Analytical Instruments And Consumables Market report?
- CAGR of the market during the forecast period
- Detailed information on factors that will drive the growth of the laboratory analytical instruments and consumables market between 2023 and 2027
- Precise estimation of the size of the laboratory analytical instruments and consumables market and its contribution to the market with a focus on the parent market
- Accurate predictions about upcoming trends and changes in consumer behavior
- Growth of the laboratory analytical instruments and consumables market across North America, Europe, Asia, and Rest of World (ROW)
- A thorough analysis of the market’s competitive landscape and detailed information about vendors
- Comprehensive analysis of factors that will challenge the growth of the laboratory analytical instruments and consumables market vendors
Gain instant access to 17,000+ market research reports.
Technavio’s SUBSCRIPTION platform
Related Reports:
Based on Technavio’s market sizing methodology, the laboratory disposables market size is predicted to surge by USD 12.32 billion from 2021 to 2026 at a CAGR of 10.83%. Furthermore, this report extensively covers laboratory disposables market segmentations that have been broadly categorized into the following demographic segmentations: End-user (Pharmaceutical and biotechnology companies, research and academic institutions, and others) and Geography (North America, Europe, Asia, and Rest of World (ROW)). One of the key factors driving the global laboratory disposables market growth is the increasing research studies and innovations to meet the growing demand in the industries such as life sciences, chemicals, and food and beverages.
The laboratory chemicals market is projected to grow by USD 4.67 million with a CAGR of 4.75% during the forecast period 2021 to 2026. Furthermore, this report extensively covers laboratory chemicals market segmentation by end-user (industrial, healthcare, education, and government) and geography (North America, Europe, APAC, South America, and the Middle East and Africa). The increase in R&D investments in the pharmaceutical industry is notably driving the laboratory chemicals market growth.
|
Laboratory Analytical Instruments And Consumables Market Scope |
|
|
Report Coverage |
Details |
|
Historic period |
2017-2021 |
|
Forecast period |
2023-2027 |
|
Growth momentum & CAGR |
Accelerate at a CAGR of 8.41% |
|
Market growth 2023-2027 |
USD 15.99 billion |
|
Market structure |
Fragmented |
|
YoY growth 2022-2023 (%) |
7.69 |
|
Regional analysis |
North America, Europe, Asia, and Rest of World (ROW) |
|
Performing market contribution |
North America at 35% |
|
Key countries |
US, Germany, UK, China, and Japan, Canada, Mexico, Italy,Spain, India, Japan, Australia, and South Korea |
|
Competitive landscape |
Leading Vendors, Market Positioning of Vendors, Competitive Strategies, and Industry Risks |
|
Key companies profiled |
ABB Ltd., Agilent Technologies Inc., AMETEK Inc., AMS Technologies AG, Bio Rad Laboratories Inc., Bruker Corp., Chemglass Inc., Cole Parmer Instrument Co. LLC, Danaher Corp., Endress Hauser Group Services AG, Eurofins Scientific SE, Foss, Harvard Bioscience Inc., Helena Laboratories Corp., Hitachi Ltd., Perkin Elmer Inc., Process Insights Inc., Shimadzu Corp., Thermo Fisher Scientific Inc., and Waters Corp. |
|
Market dynamics |
Parent market analysis, Market growth inducers and obstacles, Fast-growing and slow-growing segment analysis, COVID-19 impact and recovery analysis and future consumer dynamics, Market condition analysis for forecast period |
|
Customization purview |
If our report has not included the data that you are looking for, you can reach out to our analysts and get segments customized. |
Table of Contents:
1 Executive Summary
- 1.1 Market overview
- Exhibit 01: Executive Summary – Chart on Market Overview
- Exhibit 02: Executive Summary – Data Table on Market Overview
- Exhibit 03: Executive Summary – Chart on Global Market Characteristics
- Exhibit 04: Executive Summary – Chart on Market by Geography
- Exhibit 05: Executive Summary – Chart on Market Segmentation by Application
- Exhibit 06: Executive Summary – Chart on Market Segmentation by Product
- Exhibit 07: Executive Summary – Chart on Incremental Growth
- Exhibit 08: Executive Summary – Data Table on Incremental Growth
- Exhibit 09: Executive Summary – Chart on Vendor Market Positioning
2 Market Landscape
- 2.1 Market ecosystem
- Exhibit 10: Parent market
- Exhibit 11: Market Characteristics
3 Market Sizing
- 3.1 Market definition
- Exhibit 12: Offerings of vendors included in the market definition
- 3.2 Market segment analysis
- Exhibit 13: Market segments
- 3.4 Market outlook: Forecast for 2022-2027
- Exhibit 14: Chart on Global – Market size and forecast 2022-2027 ($ billion)
- Exhibit 15: Data Table on Global – Market size and forecast 2022-2027 ($ billion)
- Exhibit 16: Chart on Global Market: Year-over-year growth 2022-2027 (%)
- Exhibit 17: Data Table on Global Market: Year-over-year growth 2022-2027 (%)
4 Historic Market Size
- 4.1 Global laboratory analytical instruments and consumables market 2017 – 2021
- Exhibit 18: Historic Market Size – Data Table on Global laboratory analytical instruments and consumables market 2017 – 2021 ($ billion)
- 4.2 Application Segment Analysis 2017 – 2021
- Exhibit 19: Historic Market Size – Application Segment 2017 – 2021 ($ billion)
- 4.3 Product Segment Analysis 2017 – 2021
- Exhibit 20: Historic Market Size – Product Segment 2017 – 2021 ($ billion)
- 4.4 Geography Segment Analysis 2017 – 2021
- Exhibit 21: Historic Market Size – Geography Segment 2017 – 2021 ($ billion)
- 4.5 Country Segment Analysis 2017 – 2021
- Exhibit 22: Historic Market Size – Country Segment 2017 – 2021 ($ billion)
5 Five Forces Analysis
- 5.1 Five forces summary
- Exhibit 23: Five forces analysis – Comparison between 2022 and 2027
- 5.2 Bargaining power of buyers
- Exhibit 24: Chart on Bargaining power of buyers – Impact of key factors 2022 and 2027
- 5.3 Bargaining power of suppliers
- Exhibit 25: Bargaining power of suppliers – Impact of key factors in 2022 and 2027
- 5.4 Threat of new entrants
- Exhibit 26: Threat of new entrants – Impact of key factors in 2022 and 2027
- 5.5 Threat of substitutes
- Exhibit 27: Threat of substitutes – Impact of key factors in 2022 and 2027
- 5.6 Threat of rivalry
- Exhibit 28: Threat of rivalry – Impact of key factors in 2022 and 2027
- 5.7 Market condition
- Exhibit 29: Chart on Market condition – Five forces 2022 and 2027
6 Market Segmentation by Application
- 6.1 Market segments
- Exhibit 30: Chart on Application – Market share 2022-2027 (%)
- Exhibit 31: Data Table on Application – Market share 2022-2027 (%)
- 6.2 Comparison by Application
- Exhibit 32: Chart on Comparison by Application
- Exhibit 33: Data Table on Comparison by Application
- 6.3 Element analysis – Market size and forecast 2022-2027
- Exhibit 34: Chart on Element analysis – Market size and forecast 2022-2027 ($ billion)
- Exhibit 35: Data Table on Element analysis – Market size and forecast 2022-2027 ($ billion)
- Exhibit 36: Chart on Element analysis – Year-over-year growth 2022-2027 (%)
- Exhibit 37: Data Table on Element analysis – Year-over-year growth 2022-2027 (%)
- 6.4 Separation analysis – Market size and forecast 2022-2027
- Exhibit 38: Chart on Separation analysis – Market size and forecast 2022-2027 ($ billion)
- Exhibit 39: Data Table on Separation analysis – Market size and forecast 2022-2027 ($ billion)
- Exhibit 40: Chart on Separation analysis – Year-over-year growth 2022-2027 (%)
- Exhibit 41: Data Table on Separation analysis – Year-over-year growth 2022-2027 (%)
- 6.5 Molecular analysis – Market size and forecast 2022-2027
- Exhibit 42: Chart on Molecular analysis – Market size and forecast 2022-2027 ($ billion)
- Exhibit 43: Data Table on Molecular analysis – Market size and forecast 2022-2027 ($ billion)
- Exhibit 44: Chart on Molecular analysis – Year-over-year growth 2022-2027 (%)
- Exhibit 45: Data Table on Molecular analysis – Year-over-year growth 2022-2027 (%)
- 6.6 Market opportunity by Application
- Exhibit 46: Market opportunity by Application ($ billion)
- Exhibit 47: Data Table on Market opportunity by Application ($ billion)
7 Market Segmentation by Product
- 7.1 Market segments
- Exhibit 48: Chart on Product – Market share 2022-2027 (%)
- Exhibit 49: Data Table on Product – Market share 2022-2027 (%)
- 7.2 Comparison by Product
- Exhibit 50: Chart on Comparison by Product
- Exhibit 51: Data Table on Comparison by Product
- 7.3 Laboratory analytical instruments – Market size and forecast 2022-2027
- Exhibit 52: Chart on Laboratory analytical instruments – Market size and forecast 2022-2027 ($ billion)
- Exhibit 53: Data Table on Laboratory analytical instruments – Market size and forecast 2022-2027 ($ billion)
- Exhibit 54: Chart on Laboratory analytical instruments – Year-over-year growth 2022-2027 (%)
- Exhibit 55: Data Table on Laboratory analytical instruments – Year-over-year growth 2022-2027 (%)
- 7.4 Consumables – Market size and forecast 2022-2027
- Exhibit 56: Chart on Consumables – Market size and forecast 2022-2027 ($ billion)
- Exhibit 57: Data Table on Consumables – Market size and forecast 2022-2027 ($ billion)
- Exhibit 58: Chart on Consumables – Year-over-year growth 2022-2027 (%)
- Exhibit 59: Data Table on Consumables – Year-over-year growth 2022-2027 (%)
- 7.5 Market opportunity by Product
- Exhibit 60: Market opportunity by Product ($ billion)
- Exhibit 61: Data Table on Market opportunity by Product ($ billion)
8 Customer Landscape
- 8.1 Customer landscape overview
- Exhibit 62: Analysis of price sensitivity, lifecycle, customer purchase basket, adoption rates, and purchase criteria
9 Geographic Landscape
- 9.1 Geographic segmentation
- Exhibit 63: Chart on Market share by geography 2022-2027 (%)
- Exhibit 64: Data Table on Market share by geography 2022-2027 (%)
- 9.2 Geographic comparison
- Exhibit 65: Chart on Geographic comparison
- Exhibit 66: Data Table on Geographic comparison
- 9.3 North America – Market size and forecast 2022-2027
- Exhibit 67: Chart on North America – Market size and forecast 2022-2027 ($ billion)
- Exhibit 68: Data Table on North America – Market size and forecast 2022-2027 ($ billion)
- Exhibit 69: Chart on North America – Year-over-year growth 2022-2027 (%)
- Exhibit 70: Data Table on North America – Year-over-year growth 2022-2027 (%)
- 9.4 Europe – Market size and forecast 2022-2027
- Exhibit 71: Chart on Europe – Market size and forecast 2022-2027 ($ billion)
- Exhibit 72: Data Table on Europe – Market size and forecast 2022-2027 ($ billion)
- Exhibit 73: Chart on Europe – Year-over-year growth 2022-2027 (%)
- Exhibit 74: Data Table on Europe – Year-over-year growth 2022-2027 (%)
- 9.5 Asia – Market size and forecast 2022-2027
- Exhibit 75: Chart on Asia – Market size and forecast 2022-2027 ($ billion)
- Exhibit 76: Data Table on Asia – Market size and forecast 2022-2027 ($ billion)
- Exhibit 77: Chart on Asia – Year-over-year growth 2022-2027 (%)
- Exhibit 78: Data Table on Asia – Year-over-year growth 2022-2027 (%)
- 9.6 Rest of World (ROW) – Market size and forecast 2022-2027
- Exhibit 79: Chart on Rest of World (ROW) – Market size and forecast 2022-2027 ($ billion)
- Exhibit 80: Data Table on Rest of World (ROW) – Market size and forecast 2022-2027 ($ billion)
- Exhibit 81: Chart on Rest of World (ROW) – Year-over-year growth 2022-2027 (%)
- Exhibit 82: Data Table on Rest of World (ROW) – Year-over-year growth 2022-2027 (%)
- 9.7 US – Market size and forecast 2022-2027
- Exhibit 83: Chart on US – Market size and forecast 2022-2027 ($ billion)
- Exhibit 84: Data Table on US – Market size and forecast 2022-2027 ($ billion)
- Exhibit 85: Chart on US – Year-over-year growth 2022-2027 (%)
- Exhibit 86: Data Table on US – Year-over-year growth 2022-2027 (%)
- 9.8 China – Market size and forecast 2022-2027
- Exhibit 87: Chart on China – Market size and forecast 2022-2027 ($ billion)
- Exhibit 88: Data Table on China – Market size and forecast 2022-2027 ($ billion)
- Exhibit 89: Chart on China – Year-over-year growth 2022-2027 (%)
- Exhibit 90: Data Table on China – Year-over-year growth 2022-2027 (%)
- 9.9 Germany – Market size and forecast 2022-2027
- Exhibit 91: Chart on Germany – Market size and forecast 2022-2027 ($ billion)
- Exhibit 92: Data Table on Germany – Market size and forecast 2022-2027 ($ billion)
- Exhibit 93: Chart on Germany – Year-over-year growth 2022-2027 (%)
- Exhibit 94: Data Table on Germany – Year-over-year growth 2022-2027 (%)
- 9.10 UK – Market size and forecast 2022-2027
- Exhibit 95: Chart on UK – Market size and forecast 2022-2027 ($ billion)
- Exhibit 96: Data Table on UK – Market size and forecast 2022-2027 ($ billion)
- Exhibit 97: Chart on UK – Year-over-year growth 2022-2027 (%)
- Exhibit 98: Data Table on UK – Year-over-year growth 2022-2027 (%)
- 9.11 Japan – Market size and forecast 2022-2027
- Exhibit 99: Chart on Japan – Market size and forecast 2022-2027 ($ billion)
- Exhibit 100: Data Table on Japan – Market size and forecast 2022-2027 ($ billion)
- Exhibit 101: Chart on Japan – Year-over-year growth 2022-2027 (%)
- Exhibit 102: Data Table on Japan – Year-over-year growth 2022-2027 (%)
- 9.12 Market opportunity by geography
- Exhibit 103: Market opportunity by geography ($ billion)
- Exhibit 104: Data Tables on Market opportunity by geography ($ billion)
10 Drivers, Challenges, and Trends
- 10.3 Impact of drivers and challenges
- Exhibit 105: Impact of drivers and challenges in 2022 and 2027
11 Vendor Landscape
- 11.2 Vendor landscape
- Exhibit 106: Overview on Criticality of inputs and Factors of differentiation
- 11.3 Landscape disruption
- Exhibit 107: Overview on factors of disruption
- 11.4 Industry risks
- Exhibit 108: Impact of key risks on business
12 Vendor Analysis
- 12.1 Vendors covered
- Exhibit 109: Vendors covered
- 12.2 Market positioning of vendors
- Exhibit 110: Matrix on vendor position and classification
- 12.3 ABB Ltd.
- Exhibit 111: ABB Ltd. – Overview
- Exhibit 112: ABB Ltd. – Business segments
- Exhibit 113: ABB Ltd. – Key offerings
- Exhibit 114: ABB Ltd. – Segment focus
- 12.4 AMS Technologies AG
- Exhibit 115: AMS Technologies AG – Overview
- Exhibit 116: AMS Technologies AG – Product / Service
- Exhibit 117: AMS Technologies AG – Key offerings
- 12.5 Bio Rad Laboratories Inc.
- Exhibit 118: Bio Rad Laboratories Inc. – Overview
- Exhibit 119: Bio Rad Laboratories Inc. – Business segments
- Exhibit 120: Bio Rad Laboratories Inc. – Key news
- Exhibit 121: Bio Rad Laboratories Inc. – Key offerings
- Exhibit 122: Bio Rad Laboratories Inc. – Segment focus
- 12.6 Bruker Corp.
- Exhibit 123: Bruker Corp. – Overview
- Exhibit 124: Bruker Corp. – Business segments
- Exhibit 125: Bruker Corp. – Key news
- Exhibit 126: Bruker Corp. – Key offerings
- Exhibit 127: Bruker Corp. – Segment focus
- 12.7 Cole Parmer Instrument Co. LLC
- Exhibit 128: Cole Parmer Instrument Co. LLC – Overview
- Exhibit 129: Cole Parmer Instrument Co. LLC – Product / Service
- Exhibit 130: Cole Parmer Instrument Co. LLC – Key offerings
- 12.8 Danaher Corp.
- Exhibit 131: Danaher Corp. – Overview
- Exhibit 132: Danaher Corp. – Business segments
- Exhibit 133: Danaher Corp. – Key news
- Exhibit 134: Danaher Corp. – Key offerings
- Exhibit 135: Danaher Corp. – Segment focus
- 12.9 Endress Hauser Group Services AG
- Exhibit 136: Endress Hauser Group Services AG – Overview
- Exhibit 137: Endress Hauser Group Services AG – Product / Service
- Exhibit 138: Endress Hauser Group Services AG – Key news
- Exhibit 139: Endress Hauser Group Services AG – Key offerings
- 12.10 Eurofins Scientific SE
- Exhibit 140: Eurofins Scientific SE – Overview
- Exhibit 141: Eurofins Scientific SE – Business segments
- Exhibit 142: Eurofins Scientific SE – Key news
- Exhibit 143: Eurofins Scientific SE – Key offerings
- Exhibit 144: Eurofins Scientific SE – Segment focus
- 12.11 Foss
- Exhibit 145: Foss – Overview
- Exhibit 146: Foss – Product / Service
- Exhibit 147: Foss – Key offerings
- 12.12 Harvard Bioscience Inc.
- Exhibit 148: Harvard Bioscience Inc. – Overview
- Exhibit 149: Harvard Bioscience Inc. – Product / Service
- Exhibit 150: Harvard Bioscience Inc. – Key offerings
- 12.13 Helena Laboratories Corp.
- Exhibit 151: Helena Laboratories Corp. – Overview
- Exhibit 152: Helena Laboratories Corp. – Product / Service
- Exhibit 153: Helena Laboratories Corp. – Key offerings
- 12.14 Perkin Elmer Inc.
- Exhibit 154: Perkin Elmer Inc. – Overview
- Exhibit 155: Perkin Elmer Inc. – Business segments
- Exhibit 156: Perkin Elmer Inc. – Key news
- Exhibit 157: Perkin Elmer Inc. – Key offerings
- Exhibit 158: Perkin Elmer Inc. – Segment focus
- 12.15 Process Insights Inc.
- Exhibit 159: Process Insights Inc. – Overview
- Exhibit 160: Process Insights Inc. – Product / Service
- Exhibit 161: Process Insights Inc. – Key offerings
- 12.16 Thermo Fisher Scientific Inc.
- Exhibit 162: Thermo Fisher Scientific Inc. – Overview
- Exhibit 163: Thermo Fisher Scientific Inc. – Business segments
- Exhibit 164: Thermo Fisher Scientific Inc. – Key news
- Exhibit 165: Thermo Fisher Scientific Inc. – Key offerings
- Exhibit 166: Thermo Fisher Scientific Inc. – Segment focus
- 12.17 Waters Corp.
- Exhibit 167: Waters Corp. – Overview
- Exhibit 168: Waters Corp. – Product / Service
- Exhibit 169: Waters Corp. – Key offerings
13 Appendix
- 13.1 Scope of the report
- 13.2 Inclusions and exclusions checklist
- Exhibit 170: Inclusions checklist
- Exhibit 171: Exclusions checklist
- 13.3 Currency conversion rates for US$
- Exhibit 172: Currency conversion rates for US$
- 13.4 Research methodology
- Exhibit 173: Research methodology
- Exhibit 174: Validation techniques employed for market sizing
- Exhibit 175: Information sources
- 13.5 List of abbreviations
- Exhibit 176: List of abbreviations
About Us
Technavio is a leading global technology research and advisory company. Their research and analysis focuses on emerging market trends and provides actionable insights to help businesses identify market opportunities and develop effective strategies to optimize their market positions. With over 500 specialized analysts, Technavio’s report library consists of more than 17,000 reports and counting, covering 800 technologies, spanning across 50 countries. Their client base consists of enterprises of all sizes, including more than 100 Fortune 500 companies. This growing client base relies on Technavio’s comprehensive coverage, extensive research, and actionable market insights to identify opportunities in existing and potential markets and assess their competitive positions within changing market scenarios.
Contact
Technavio Research
Jesse Maida
Media & Marketing Executive
US: +1 844 364 1100
UK: +44 203 893 3200
Email: [email protected]
Website: www.technavio.com/
SOURCE Technavio
