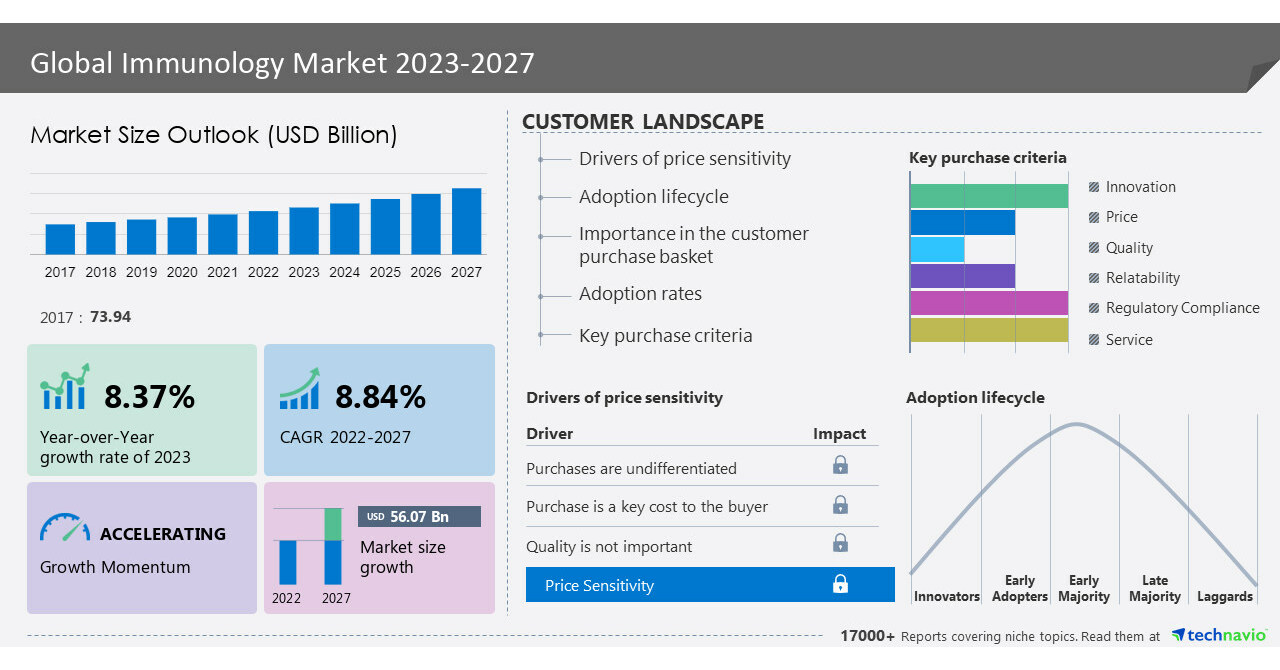
NEW YORK, May 26, 2023 /PRNewswire/ — The global immunology market size is estimated to grow by USD 56.07 billion from 2022 to 2027, according to Technavio. The market is estimated to grow at a CAGR of 8.84% and the growth momentum will progress during the forecast period. North America is estimated to account for 41% of the global market growth. The market is expected to register moderate growth during the forecast period owing to the increased funding from government and non-government bodies along with the rise in the prevalence rate of chronic diseases such as rheumatoid arthritis and cancer. According to the CDC, in January 2021, the incidence rate of female breast cancer was 123.9 per 100,000 people in the US. These drug trials revealed that the effect of anti-cancer drugs lasts longer when immuno-booster drugs are given along with the anti-cancer drugs. For more insights on the historic period (2017 to 2021) and forecast market size (2023 to 2027) – Request a sample report
What’s New?
- Special coverage on the Russia–Ukraine war; global inflation; recovery analysis from COVID-19; supply chain disruptions, global trade tensions; and risk of recession
- Global competitiveness and key competitor positions
- Market presence across multiple geographical footprints – Strong/Active/Niche/Trivial – buy the report!
Immunology Market – Segmentation Assessment
Segment Overview
Technavio has segmented the market based on type (immunosuppressants and immuno boosters), distribution channel (hospital pharmacies, retail pharmacies, and online pharmacies), and geography (North America, Europe, Asia, and Rest of World (ROW)).
- The market share growth by the immunosuppressants segment will be significant for overall market growth during the forecast period. These drugs have a large number of applications in organ transplantation where the chances of organ rejection are high. Since the body’s immune system identifies the new organ as a foreign agent and tends to attack it, resulting in rejection because the immune system perceives transplanted organs as foreign items and mounts an immunological response against them. This causes the organs to be destroyed while also affecting other body components.
Insights on the market contribution of various segments including country and region wise, historic (2017 to 2021) and forecast market size (2023 to 2027) – Download a Sample Report
Immunology Market – Market Dynamics
Key factor driving market growth
- Hurdles in the approval of biosimilars are the major factors driving the growth of the global immunology market.
- The clearance of biosimilars from the US FDA is slow, as obtaining guidance documents for a biosimilar is time-consuming.
- For instance, INFLECTRA was cleared by the US FDA after two months of House Subcommittee hearings.
- And as per the Biologics Price Competition and Innovation (BPCI) Act, it is not essential for the US FDA to issue guidance before approving a biosimilar application.
- However, this guide will help to ensure successful implementation.
- Hence, such factors drive market growth during the forecast period.
Leading trends influencing the market
- A significant pipeline of immunology is the primary trend in the global immunology market growth.
- There are multiple promising immunological agents in the pipeline.
- This will boost market growth after their approval and the approval of a new treatment increases treatment options and increases demand for that treatment regimen.
- Furthermore, around 51 molecules are in various stages of clinical trials worldwide. Of these, 22 molecules are in Phase II, four are in Phase III, 16 are in Phase I, and the rest are in Phase I/II clinical trials.
- Hence, these developments will lead to the global immunology market growth during the forecast period.
Major challenges hindering the market growth
- Lack of awareness of immunology is a major challenge hindering the growth of the global immunology market.
- There is a significant lack of awareness among people about fatigue as a serious symptom of rheumatoid arthritis.
- In spite of its high prevalence, allergies are still underdiagnosed and undertreated due to a lack of information.
- The NIH also states that more than one-third of patients who experience rhinitis and asthma symptoms remain undiagnosed and have decreased their quality of life.
- Hence, the lack of awareness is a major challenge and is likely to hinder the global immunology market during the forecast period.
Insights on Market Drivers, trends, & Challenges, historic period(2017 to 2021) and forecast period(2023 to 2027)- Request a sample report!
What are the key data covered in this Immunology Market report?
- CAGR of the market during the forecast period
- Detailed information on factors that will drive the growth of the immunology market between 2023 and 2027
- Precise estimation of the size of the immunology market and its contribution to the market with a focus on the parent market
- Accurate predictions about upcoming trends and changes in consumer behavior
- Growth of the immunology market across North America, Europe, Asia, and Rest of World (ROW)
- A thorough analysis of the market’s competitive landscape and detailed information about vendors
- Comprehensive analysis of factors that will challenge the growth of immunology market vendors
Gain instant access to 17,000+ market research reports.
Technavio’s SUBSCRIPTION platform
Related Reports:
The enzyme-linked immunosorbent assay (Elisa) testing market size is estimated to grow at a CAGR of 13.6% between 2022 and 2027. The size of the market is forecast to increase by USD 564.97 million. The market report extensively covers market segmentation by application (vaccine development, immunology, diagnostics, drug monitoring and pharmaceutical industry, and others), end-user (hospitals and diagnostic centers, research laboratories, and others), and geography (North America, Europe, Asia, and Rest of World (ROW)).The increase in chronic diseases is notably driving the market growth.
The cancer immunotherapy market size is expected to increase by USD 74.45 billion from 2021 to 2026, and the market’s growth momentum will accelerate at a CAGR of 14.67%. Furthermore, this report extensively covers cancer immunotherapy market segmentation by type (monoclonal antibodies, cancer vaccines, and check point inhibitors and immunomodulators) and geography (North America, Europe, Asia, and ROW). The high prevalence of cancer is notably driving the cancer immunotherapy market growth.
|
Immunology Market Scope |
|
|
Report Coverage |
Details |
|
Base year |
2022 |
|
Historic period |
2017-2021 |
|
Forecast period |
2023-2027 |
|
Growth momentum & CAGR |
Accelerate at a CAGR of 8.84% |
|
Market growth 2023-2027 |
USD 56.07 billion |
|
Market structure |
Fragmented |
|
YoY growth 2022-2023 (%) |
8.37 |
|
Regional analysis |
North America, Europe, Asia, and Rest of World (ROW) |
|
Performing market contribution |
North America at 41% |
|
Key countries |
US, Germany, UK, China, and Japan, Canada, Mexico, Italy,Spain, India, Japan, Australia, and South Korea |
|
Competitive landscape |
Leading Vendors, Market Positioning of Vendors, Competitive Strategies, and Industry Risks |
|
Key companies profiled |
3SBio Inc., AbbVie Inc., Amgen Inc., Antares Pharma Inc., Astellas Pharma Inc., Biogen Inc., Bristol Myers Squibb Co., Eli Lilly and Co., F. Hoffmann La Roche Ltd., Horizon Therapeutics Plc, ImmuNext Inc., Incyte Corp., Johnson and Johnson Services Inc., Merck KGaA, Mitsubishi Chemical Group Corp., Novartis AG, Pfizer Inc., Takeda Pharmaceutical Co. Ltd., UCB SA, and GlaxoSmithKline Plc |
|
Market dynamics |
Parent market analysis, Market growth inducers and obstacles, Fast-growing and slow-growing segment analysis, COVID-19 impact and recovery analysis and future consumer dynamics, Market condition analysis for forecast period. |
|
Customization purview |
If our report has not included the data that you are looking for, you can reach out to our analysts and get segments customized. |
Table of Contents
1 Executive Summary
- 1.1 Market overview
- Exhibit 01: Executive Summary – Chart on Market Overview
- Exhibit 02: Executive Summary – Data Table on Market Overview
- Exhibit 03: Executive Summary – Chart on Global Market Characteristics
- Exhibit 04: Executive Summary – Chart on Market by Geography
- Exhibit 05: Executive Summary – Chart on Market Segmentation by Type
- Exhibit 06: Executive Summary – Chart on Market Segmentation by Distribution Channel
- Exhibit 07: Executive Summary – Chart on Incremental Growth
- Exhibit 08: Executive Summary – Data Table on Incremental Growth
- Exhibit 09: Executive Summary – Chart on Vendor Market Positioning
2 Market Landscape
- 2.1 Market ecosystem
- Exhibit 10: Parent market
- Exhibit 11: Market Characteristics
3 Market Sizing
- 3.1 Market definition
- Exhibit 12: Offerings of vendors included in the market definition
- 3.2 Market segment analysis
- Exhibit 13: Market segments
- 3.4 Market outlook: Forecast for 2022-2027
- Exhibit 14: Chart on Global – Market size and forecast 2022-2027 ($ billion)
- Exhibit 15: Data Table on Global – Market size and forecast 2022-2027 ($ billion)
- Exhibit 16: Chart on Global Market: Year-over-year growth 2022-2027 (%)
- Exhibit 17: Data Table on Global Market: Year-over-year growth 2022-2027 (%)
4 Historic Market Size
- 4.1 Global immunology market 2017 – 2021
- Exhibit 18: Historic Market Size – Data Table on global immunology market 2017 – 2021 ($ billion)
- 4.2 Type Segment Analysis 2017 – 2021
- Exhibit 19: Historic Market Size – Type Segment 2017 – 2021 ($ billion)
- 4.3 Distribution Channel Segment Analysis 2017 – 2021
- Exhibit 20: Historic Market Size – Distribution Channel Segment 2017 – 2021 ($ billion)
- 4.4 Geography Segment Analysis 2017 – 2021
- Exhibit 21: Historic Market Size – Geography Segment 2017 – 2021 ($ billion)
- 4.5 Country Segment Analysis 2017 – 2021
- Exhibit 22: Historic Market Size – Country Segment 2017 – 2021 ($ billion)
5 Five Forces Analysis
- 5.1 Five forces summary
- Exhibit 23: Five forces analysis – Comparison between 2022 and 2027
- 5.2 Bargaining power of buyers
- Exhibit 24: Chart on Bargaining power of buyers – Impact of key factors 2022 and 2027
- 5.3 Bargaining power of suppliers
- Exhibit 25: Bargaining power of suppliers – Impact of key factors in 2022 and 2027
- 5.4 Threat of new entrants
- Exhibit 26: Threat of new entrants – Impact of key factors in 2022 and 2027
- 5.5 Threat of substitutes
- Exhibit 27: Threat of substitutes – Impact of key factors in 2022 and 2027
- 5.6 Threat of rivalry
- Exhibit 28: Threat of rivalry – Impact of key factors in 2022 and 2027
- 5.7 Market condition
- Exhibit 29: Chart on Market condition – Five forces 2022 and 2027
6 Market Segmentation by Type
- 6.1 Market segments
- Exhibit 30: Chart on Type – Market share 2022-2027 (%)
- Exhibit 31: Data Table on Type – Market share 2022-2027 (%)
- 6.2 Comparison by Type
- Exhibit 32: Chart on Comparison by Type
- Exhibit 33: Data Table on Comparison by Type
- 6.3 Immunosuppressants – Market size and forecast 2022-2027
- Exhibit 34: Chart on Immunosuppressants – Market size and forecast 2022-2027 ($ billion)
- Exhibit 35: Data Table on Immunosuppressants – Market size and forecast 2022-2027 ($ billion)
- Exhibit 36: Chart on Immunosuppressants – Year-over-year growth 2022-2027 (%)
- Exhibit 37: Data Table on Immunosuppressants – Year-over-year growth 2022-2027 (%)
- 6.4 Immuno boosters – Market size and forecast 2022-2027
- Exhibit 38: Chart on Immuno boosters – Market size and forecast 2022-2027 ($ billion)
- Exhibit 39: Data Table on Immuno boosters – Market size and forecast 2022-2027 ($ billion)
- Exhibit 40: Chart on Immuno boosters – Year-over-year growth 2022-2027 (%)
- Exhibit 41: Data Table on Immuno boosters – Year-over-year growth 2022-2027 (%)
- 6.5 Market opportunity by Type
- Exhibit 42: Market opportunity by Type ($ billion)
- Exhibit 43: Data Table on Market opportunity by Type ($ billion)
7 Market Segmentation by Distribution Channel
- 7.1 Market segments
- Exhibit 44: Chart on Distribution Channel – Market share 2022-2027 (%)
- Exhibit 45: Data Table on Distribution Channel – Market share 2022-2027 (%)
- 7.2 Comparison by Distribution Channel
- Exhibit 46: Chart on Comparison by Distribution Channel
- Exhibit 47: Data Table on Comparison by Distribution Channel
- 7.3 Hospital pharmacies – Market size and forecast 2022-2027
- Exhibit 48: Chart on Hospital pharmacies – Market size and forecast 2022-2027 ($ billion)
- Exhibit 49: Data Table on Hospital pharmacies – Market size and forecast 2022-2027 ($ billion)
- Exhibit 50: Chart on Hospital pharmacies – Year-over-year growth 2022-2027 (%)
- Exhibit 51: Data Table on Hospital pharmacies – Year-over-year growth 2022-2027 (%)
- 7.4 Retail pharmacies – Market size and forecast 2022-2027
- Exhibit 52: Chart on Retail pharmacies – Market size and forecast 2022-2027 ($ billion)
- Exhibit 53: Data Table on Retail pharmacies – Market size and forecast 2022-2027 ($ billion)
- Exhibit 54: Chart on Retail pharmacies – Year-over-year growth 2022-2027 (%)
- Exhibit 55: Data Table on Retail pharmacies – Year-over-year growth 2022-2027 (%)
- 7.5 Online pharmacies – Market size and forecast 2022-2027
- Exhibit 56: Chart on Online pharmacies – Market size and forecast 2022-2027 ($ billion)
- Exhibit 57: Data Table on Online pharmacies – Market size and forecast 2022-2027 ($ billion)
- Exhibit 58: Chart on Online pharmacies – Year-over-year growth 2022-2027 (%)
- Exhibit 59: Data Table on Online pharmacies – Year-over-year growth 2022-2027 (%)
- 7.6 Market opportunity by Distribution Channel
- Exhibit 60: Market opportunity by Distribution Channel ($ billion)
- Exhibit 61: Data Table on Market opportunity by Distribution Channel ($ billion)
8 Customer Landscape
- 8.1 Customer landscape overview
- Exhibit 62: Analysis of price sensitivity, lifecycle, customer purchase basket, adoption rates, and purchase criteria
9 Geographic Landscape
- 9.1 Geographic segmentation
- Exhibit 63: Chart on Market share by geography 2022-2027 (%)
- Exhibit 64: Data Table on Market share by geography 2022-2027 (%)
- 9.2 Geographic comparison
- Exhibit 65: Chart on Geographic comparison
- Exhibit 66: Data Table on Geographic comparison
- 9.3 North America – Market size and forecast 2022-2027
- Exhibit 67: Chart on North America – Market size and forecast 2022-2027 ($ billion)
- Exhibit 68: Data Table on North America – Market size and forecast 2022-2027 ($ billion)
- Exhibit 69: Chart on North America – Year-over-year growth 2022-2027 (%)
- Exhibit 70: Data Table on North America – Year-over-year growth 2022-2027 (%)
- 9.4 Europe – Market size and forecast 2022-2027
- Exhibit 71: Chart on Europe – Market size and forecast 2022-2027 ($ billion)
- Exhibit 72: Data Table on Europe – Market size and forecast 2022-2027 ($ billion)
- Exhibit 73: Chart on Europe – Year-over-year growth 2022-2027 (%)
- Exhibit 74: Data Table on Europe – Year-over-year growth 2022-2027 (%)
- 9.5 Asia – Market size and forecast 2022-2027
- Exhibit 75: Chart on Asia – Market size and forecast 2022-2027 ($ billion)
- Exhibit 76: Data Table on Asia – Market size and forecast 2022-2027 ($ billion)
- Exhibit 77: Chart on Asia – Year-over-year growth 2022-2027 (%)
- Exhibit 78: Data Table on Asia – Year-over-year growth 2022-2027 (%)
- 9.6 Rest of World (ROW) – Market size and forecast 2022-2027
- Exhibit 79: Chart on Rest of World (ROW) – Market size and forecast 2022-2027 ($ billion)
- Exhibit 80: Data Table on Rest of World (ROW) – Market size and forecast 2022-2027 ($ billion)
- Exhibit 81: Chart on Rest of World (ROW) – Year-over-year growth 2022-2027 (%)
- Exhibit 82: Data Table on Rest of World (ROW) – Year-over-year growth 2022-2027 (%)
- 9.7 US – Market size and forecast 2022-2027
- Exhibit 83: Chart on US – Market size and forecast 2022-2027 ($ billion)
- Exhibit 84: Data Table on US – Market size and forecast 2022-2027 ($ billion)
- Exhibit 85: Chart on US – Year-over-year growth 2022-2027 (%)
- Exhibit 86: Data Table on US – Year-over-year growth 2022-2027 (%)
- 9.8 Germany – Market size and forecast 2022-2027
- Exhibit 87: Chart on Germany – Market size and forecast 2022-2027 ($ billion)
- Exhibit 88: Data Table on Germany – Market size and forecast 2022-2027 ($ billion)
- Exhibit 89: Chart on Germany – Year-over-year growth 2022-2027 (%)
- Exhibit 90: Data Table on Germany – Year-over-year growth 2022-2027 (%)
- 9.9 UK – Market size and forecast 2022-2027
- Exhibit 91: Chart on UK – Market size and forecast 2022-2027 ($ billion)
- Exhibit 92: Data Table on UK – Market size and forecast 2022-2027 ($ billion)
- Exhibit 93: Chart on UK – Year-over-year growth 2022-2027 (%)
- Exhibit 94: Data Table on UK – Year-over-year growth 2022-2027 (%)
- 9.10 China – Market size and forecast 2022-2027
- Exhibit 95: Chart on China – Market size and forecast 2022-2027 ($ billion)
- Exhibit 96: Data Table on China – Market size and forecast 2022-2027 ($ billion)
- Exhibit 97: Chart on China – Year-over-year growth 2022-2027 (%)
- Exhibit 98: Data Table on China – Year-over-year growth 2022-2027 (%)
- 9.11 Japan – Market size and forecast 2022-2027
- Exhibit 99: Chart on Japan – Market size and forecast 2022-2027 ($ billion)
- Exhibit 100: Data Table on Japan – Market size and forecast 2022-2027 ($ billion)
- Exhibit 101: Chart on Japan – Year-over-year growth 2022-2027 (%)
- Exhibit 102: Data Table on Japan – Year-over-year growth 2022-2027 (%)
- 9.12 Market opportunity by geography
- Exhibit 103: Market opportunity by geography ($ billion)
- Exhibit 104: Data Tables on Market opportunity by geography ($ billion)
10 Drivers, Challenges, and Trends
- 10.3 Impact of drivers and challenges
- Exhibit 105: Impact of drivers and challenges in 2022 and 2027
11 Vendor Landscape
- 11.2 Vendor landscape
- Exhibit 106: Overview on Criticality of inputs and Factors of differentiation
- 11.3 Landscape disruption
- Exhibit 107: Overview on factors of disruption
- 11.4 Industry risks
- Exhibit 108: Impact of key risks on business
12 Vendor Analysis
- 12.1 Vendors covered
- Exhibit 109: Vendors covered
- 12.2 Market positioning of vendors
- Exhibit 110: Matrix on vendor position and classification
- 12.3 AbbVie Inc.
- Exhibit 111: AbbVie Inc. – Overview
- Exhibit 112: AbbVie Inc. – Product / Service
- Exhibit 113: AbbVie Inc. – Key news
- Exhibit 114: AbbVie Inc. – Key offerings
- 12.4 Amgen Inc.
- Exhibit 115: Amgen Inc. – Overview
- Exhibit 116: Amgen Inc. – Product / Service
- Exhibit 117: Amgen Inc. – Key offerings
- 12.5 Astellas Pharma Inc.
- Exhibit 118: Astellas Pharma Inc. – Overview
- Exhibit 119: Astellas Pharma Inc. – Product / Service
- Exhibit 120: Astellas Pharma Inc. – Key news
- Exhibit 121: Astellas Pharma Inc. – Key offerings
- 12.6 Bristol Myers Squibb Co.
- Exhibit 122: Bristol Myers Squibb Co. – Overview
- Exhibit 123: Bristol Myers Squibb Co. – Product / Service
- Exhibit 124: Bristol Myers Squibb Co. – Key news
- Exhibit 125: Bristol Myers Squibb Co. – Key offerings
- 12.7 Eli Lilly and Co.
- Exhibit 126: Eli Lilly and Co. – Overview
- Exhibit 127: Eli Lilly and Co. – Product / Service
- Exhibit 128: Eli Lilly and Co. – Key news
- Exhibit 129: Eli Lilly and Co. – Key offerings
- 12.8 F. Hoffmann La Roche Ltd.
- Exhibit 130: F. Hoffmann La Roche Ltd. – Overview
- Exhibit 131: F. Hoffmann La Roche Ltd. – Business segments
- Exhibit 132: F. Hoffmann La Roche Ltd. – Key news
- Exhibit 133: F. Hoffmann La Roche Ltd. – Key offerings
- Exhibit 134: F. Hoffmann La Roche Ltd. – Segment focus
- 12.9 GlaxoSmithKline Plc
- Exhibit 135: GlaxoSmithKline Plc – Overview
- Exhibit 136: GlaxoSmithKline Plc – Business segments
- Exhibit 137: GlaxoSmithKline Plc – Key news
- Exhibit 138: GlaxoSmithKline Plc – Key offerings
- Exhibit 139: GlaxoSmithKline Plc – Segment focus
- 12.10 Incyte Corp.
- Exhibit 140: Incyte Corp. – Overview
- Exhibit 141: Incyte Corp. – Product / Service
- Exhibit 142: Incyte Corp. – Key offerings
- 12.11 Johnson and Johnson Services Inc.
- Exhibit 143: Johnson and Johnson Services Inc. – Overview
- Exhibit 144: Johnson and Johnson Services Inc. – Business segments
- Exhibit 145: Johnson and Johnson Services Inc. – Key news
- Exhibit 146: Johnson and Johnson Services Inc. – Key offerings
- Exhibit 147: Johnson and Johnson Services Inc. – Segment focus
- 12.12 Merck KGaA
- Exhibit 148: Merck KGaA – Overview
- Exhibit 149: Merck KGaA – Business segments
- Exhibit 150: Merck KGaA – Key news
- Exhibit 151: Merck KGaA – Key offerings
- Exhibit 152: Merck KGaA – Segment focus
- 12.13 Mitsubishi Chemical Group Corp.
- Exhibit 153: Mitsubishi Chemical Group Corp. – Overview
- Exhibit 154: Mitsubishi Chemical Group Corp. – Business segments
- Exhibit 155: Mitsubishi Chemical Group Corp. – Key offerings
- Exhibit 156: Mitsubishi Chemical Group Corp. – Segment focus
- 12.14 Novartis AG
- Exhibit 157: Novartis AG – Overview
- Exhibit 158: Novartis AG – Business segments
- Exhibit 159: Novartis AG – Key offerings
- Exhibit 160: Novartis AG – Segment focus
- 12.15 Pfizer Inc.
- Exhibit 161: Pfizer Inc. – Overview
- Exhibit 162: Pfizer Inc. – Product / Service
- Exhibit 163: Pfizer Inc. – Key news
- Exhibit 164: Pfizer Inc. – Key offerings
- 12.16 Takeda Pharmaceutical Co. Ltd.
- Exhibit 165: Takeda Pharmaceutical Co. Ltd. – Overview
- Exhibit 166: Takeda Pharmaceutical Co. Ltd. – Product / Service
- Exhibit 167: Takeda Pharmaceutical Co. Ltd. – Key news
- Exhibit 168: Takeda Pharmaceutical Co. Ltd. – Key offerings
- 12.17 UCB SA
- Exhibit 169: UCB SA – Overview
- Exhibit 170: UCB SA – Product / Service
- Exhibit 171: UCB SA – Key offerings
13 Appendix
- 13.1 Scope of the report
- 13.2 Inclusions and exclusions checklist
- Exhibit 172: Inclusions checklist
- Exhibit 173: Exclusions checklist
- 13.3 Currency conversion rates for US$
- Exhibit 174: Currency conversion rates for US$
- 13.4 Research methodology
- Exhibit 175: Research methodology
- Exhibit 176: Validation techniques employed for market sizing
- Exhibit 177: Information sources
- 13.5 List of abbreviations
- Exhibit 178: List of abbreviations
About Us
Technavio is a leading global technology research and advisory company. Their research and analysis focuses on emerging market trends and provides actionable insights to help businesses identify market opportunities and develop effective strategies to optimize their market positions. With over 500 specialized analysts, Technavio’s report library consists of more than 17,000 reports and counting, covering 800 technologies, spanning across 50 countries. Their client base consists of enterprises of all sizes, including more than 100 Fortune 500 companies. This growing client base relies on Technavio’s comprehensive coverage, extensive research, and actionable market insights to identify opportunities in existing and potential markets and assess their competitive positions within changing market scenarios.
Contact
Technavio Research
Jesse Maida
Media & Marketing Executive
US: +1 844 364 1100
UK: +44 203 893 3200
Email: [email protected]
Website: www.technavio.com/
SOURCE Technavio
