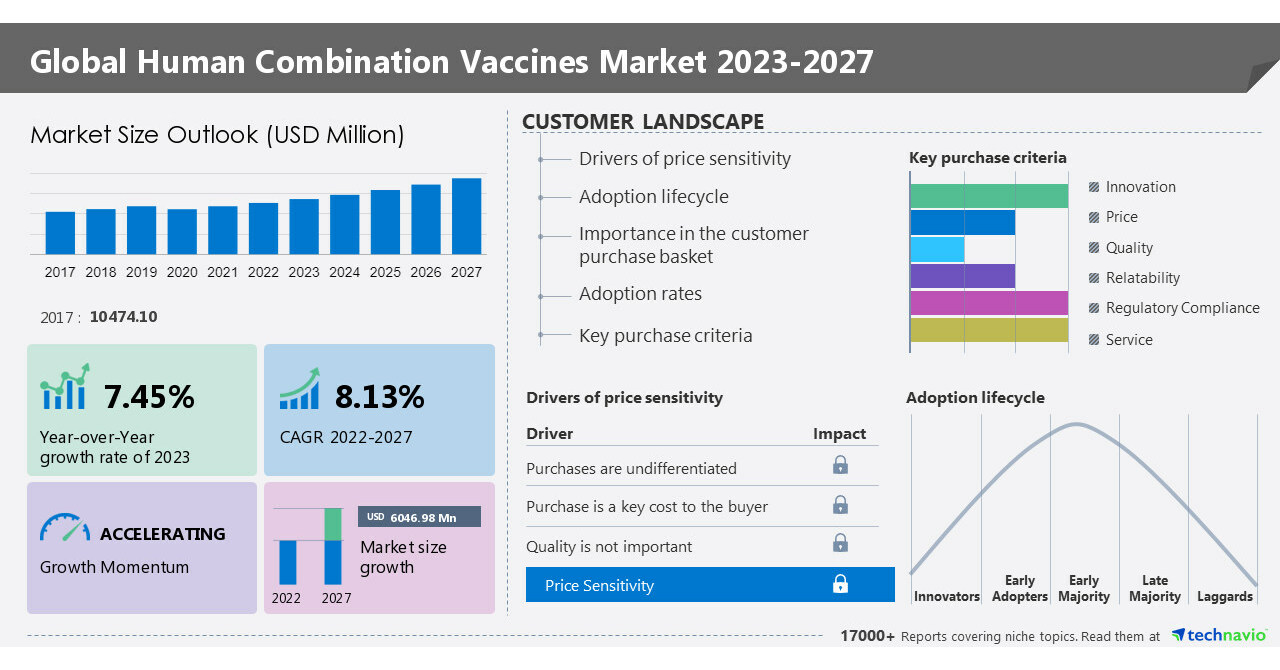
NEW YORK, May 18, 2023 /PRNewswire/ — The human combination vaccines market size is set to grow by USD 6046.98 million between 2022 and 2027 and register a CAGR of 8.13%, according to Technavio’s latest market research report. With a focus on identifying dominant industry influencers, Technavio’s reports present a detailed study by way of synthesis, and summation of data from multiple sources. This report offers an up-to-date analysis of the current market scenario, the latest trends and drivers, and the overall market environment.
Technavio offers an up-to-date analysis of the current global market scenario and the overall market environment. View Sample Report
Factors such as increasing antiviral drug resistance, an increase in the pediatric population, and the rise in cases of infectious diseases will offer immense growth opportunities. To leverage the current opportunities, market vendors must strengthen their foothold in the fast-growing segments, while maintaining their positions in the slow-growing segments. The human combination vaccines market is concentrated, and the degree of concentration will accelerate during the forecast period.
Human Combination Vaccines Market 2023-2027: Segmentation
- Type
- Inactivated Vaccine: Based on type, the human combination vaccines market is segmented into the inactivated vaccine and live attenuated vaccine.
- Live Attenuated Vaccine
- Geography
- North America: North America is the largest geographical segment of the global human combination vaccines market with 45% growth rate in 2022 and will continue to remain the largest segment of the market during the forecast period.
- Europe
- Asia
- Rest Of World (ROW)
Receive our market sample report now to gain access to detailed analysis on the human combination vaccines market: https://www.technavio.com/talk-to-us?report=IRTNTR44620
Human Combination Vaccines Market 2023-2027: Vendor Analysis and Scope
To help businesses improve their market position, the human combination vaccines market provides a detailed analysis of around 15+ vendors operating in the market. Some of these vendors include Abbott Laboratories, Arabio, Bharat Biotech Ltd., Biological E. Ltd., Cadila Healthcare Ltd., CSL Ltd., Daiichi Sankyo Co. Ltd., GlaxoSmithKline Plc, Grifols SA, LG Corp., Meiji Holdings Co. Ltd., Merck and Co. Inc., Mitsubishi Chemical Holdings Corp., Panacea Biotec Ltd., Pfizer Inc., PT Bio Farma, Sanofi SA, Serum Institute of India Pvt. Ltd., Takeda Pharmaceutical Co. Ltd., and Walvax Biotechnology Co. Ltd.
abbott.com- The company offers yoga clothing such as Versatile Windbreaker, and Yoga Training Pants.
arabio.com- The company offers yoga clothing such as Calle Bra, and Crosscourt Bra Top.
bharatbiotech.com- The company offers yoga clothing such as Metarun Bra, and Women Training Graphic Bra Women.
The report also covers the following areas:
Market Driver
- Increasing antiviral drug resistance
- Increase in pediatric population
- Rise in cases of infectious diseases
Market Trend
- Threat from bioterrorism
- Growing interest in research and development of new vaccines
- Presence of government-sponsored programs
Market Challenges
- Consolidation of different immunization schedules
- Incompatibility of vaccine components
- High costs associated with vaccine research, development, and manufacturing
Get lifetime access to our Technavio Insights. Subscribe now to our most popular “Lite Plan” billed annually at USD 5000. View 3 reports monthly and Download 3 Reports Annually!
Human Combination Vaccines Market 2023-2027: Key Highlights
- CAGR of the market during the forecast period 2023-2027
- Detailed information on factors that will assist human combination vaccines market growth during the next five years
- Estimation of the human combination vaccines market size and its contribution to the parent market
- Predictions on upcoming trends and changes in consumer behavior
- The growth of the human combination vaccines market
- Analysis of the market’s competitive landscape and detailed information on vendors
- Comprehensive details of factors that will challenge the growth of human combination vaccines market vendors
Related Reports:
Non-insulin Diabetes Therapeutics Market- The non-insulin diabetes therapeutics market size is estimated to grow at a CAGR of 10.82% between 2022 and 2027. The market size is forecast to increase by USD 31,251.55 million.
Paracetamol Market- The paracetamol market size is estimated to grow at a CAGR of 8.78% between 2022 and 2027. The market size is forecast to increase by USD 791.9 million.
|
Human Combination Vaccines Market Scope |
|
|
Report Coverage |
Details |
|
Base year |
2022 |
|
Historic period |
2017-2021 |
|
Forecast period |
2023-2027 |
|
Growth momentum & CAGR |
Accelerate at a CAGR of 8.13% |
|
Market growth 2023-2027 |
USD 6046.98 million |
|
Market structure |
Concentrated |
|
YoY growth 2022-2023(%) |
7.45 |
|
Regional analysis |
North America, Europe, Asia, and Rest of World (ROW) |
|
Performing market contribution |
North America at 45% |
|
Key countries |
US, Canada, UK, Germany, and Japan |
|
Competitive landscape |
Leading Vendors, Market Positioning of Vendors, Competitive Strategies, and Industry Risks |
|
Key companies profiled |
Abbott Laboratories, Arabio, Bharat Biotech Ltd., Biological E. Ltd., Cadila Healthcare Ltd., CSL Ltd., Daiichi Sankyo Co. Ltd., GlaxoSmithKline Plc, Grifols SA, LG Corp., Meiji Holdings Co. Ltd., Merck and Co. Inc., Mitsubishi Chemical Holdings Corp., Panacea Biotec Ltd., Pfizer Inc., PT Bio Farma, Sanofi SA, Serum Institute of India Pvt. Ltd., Takeda Pharmaceutical Co. Ltd., and Walvax Biotechnology Co. Ltd. |
|
Market dynamics |
Parent market analysis, Market growth inducers and obstacles, Fast-growing and slow-growing segment analysis, COVID-19 impact and recovery analysis and future consumer dynamics, Market condition analysis for forecast period |
|
Customization purview |
If our report has not included the data that you are looking for, you can reach out to our analysts and get segments customized. |
1 Executive Summary
- 1.1 Market overview
- Exhibit 01: Executive Summary – Chart on Market Overview
- Exhibit 02: Executive Summary – Data Table on Market Overview
- Exhibit 03: Executive Summary – Chart on Global Market Characteristics
- Exhibit 04: Executive Summary – Chart on Market by Geography
- Exhibit 05: Executive Summary – Chart on Market Segmentation by Type
- Exhibit 06: Executive Summary – Chart on Market Segmentation by Channel
- Exhibit 07: Executive Summary – Chart on Incremental Growth
- Exhibit 08: Executive Summary – Data Table on Incremental Growth
- Exhibit 09: Executive Summary – Chart on Vendor Market Positioning
2 Market Landscape
- 2.1 Market ecosystem
- Exhibit 10: Parent market
- Exhibit 11: Market Characteristics
3 Market Sizing
- 3.1 Market definition
- Exhibit 12: Offerings of vendors included in the market definition
- 3.2 Market segment analysis
- Exhibit 13: Market segments
- 3.4 Market outlook: Forecast for 2022-2027
- Exhibit 14: Chart on Global – Market size and forecast 2022-2027 ($ million)
- Exhibit 15: Data Table on Global – Market size and forecast 2022-2027 ($ million)
- Exhibit 16: Chart on Global Market: Year-over-year growth 2022-2027 (%)
- Exhibit 17: Data Table on Global Market: Year-over-year growth 2022-2027 (%)
4 Historic Market Size
- 4.1 Global human combination vaccines market 2017 – 2021
- Exhibit 18: Historic Market Size – Data Table on Global human combination vaccines market 2017 – 2021 ($ million)
- 4.2 Type Segment Analysis 2017 – 2021
- Exhibit 19: Historic Market Size – Type Segment 2017 – 2021 ($ million)
- 4.3 Channel Segment Analysis 2017 – 2021
- Exhibit 20: Historic Market Size – Channel Segment 2017 – 2021 ($ million)
- 4.4 Geography Segment Analysis 2017 – 2021
- Exhibit 21: Historic Market Size – Geography Segment 2017 – 2021 ($ million)
- 4.5 Country Segment Analysis 2017 – 2021
- Exhibit 22: Historic Market Size – Country Segment 2017 – 2021 ($ million)
5 Five Forces Analysis
- 5.1 Five forces summary
- Exhibit 23: Five forces analysis – Comparison between 2022 and 2027
- 5.2 Bargaining power of buyers
- Exhibit 24: Chart on Bargaining power of buyers – Impact of key factors 2022 and 2027
- 5.3 Bargaining power of suppliers
- Exhibit 25: Bargaining power of suppliers – Impact of key factors in 2022 and 2027
- 5.4 Threat of new entrants
- Exhibit 26: Threat of new entrants – Impact of key factors in 2022 and 2027
- 5.5 Threat of substitutes
- Exhibit 27: Threat of substitutes – Impact of key factors in 2022 and 2027
- 5.6 Threat of rivalry
- Exhibit 28: Threat of rivalry – Impact of key factors in 2022 and 2027
- 5.7 Market condition
- Exhibit 29: Chart on Market condition – Five forces 2022 and 2027
6 Market Segmentation by Type
- 6.1 Market segments
- Exhibit 30: Chart on Type – Market share 2022-2027 (%)
- Exhibit 31: Data Table on Type – Market share 2022-2027 (%)
- 6.2 Comparison by Type
- Exhibit 32: Chart on Comparison by Type
- Exhibit 33: Data Table on Comparison by Type
- 6.3 Inactivated vaccine – Market size and forecast 2022-2027
- Exhibit 34: Chart on Inactivated vaccine – Market size and forecast 2022-2027 ($ million)
- Exhibit 35: Data Table on Inactivated vaccine – Market size and forecast 2022-2027 ($ million)
- Exhibit 36: Chart on Inactivated vaccine – Year-over-year growth 2022-2027 (%)
- Exhibit 37: Data Table on Inactivated vaccine – Year-over-year growth 2022-2027 (%)
- 6.4 Live attenuated vaccine – Market size and forecast 2022-2027
- Exhibit 38: Chart on Live attenuated vaccine – Market size and forecast 2022-2027 ($ million)
- Exhibit 39: Data Table on Live attenuated vaccine – Market size and forecast 2022-2027 ($ million)
- Exhibit 40: Chart on Live attenuated vaccine – Year-over-year growth 2022-2027 (%)
- Exhibit 41: Data Table on Live attenuated vaccine – Year-over-year growth 2022-2027 (%)
- 6.5 Market opportunity by Type
- Exhibit 42: Market opportunity by Type ($ million)
7 Market Segmentation by Channel
- 7.1 Market segments
- Exhibit 43: Chart on Channel – Market share 2022-2027 (%)
- Exhibit 44: Data Table on Channel – Market share 2022-2027 (%)
- 7.2 Comparison by Channel
- Exhibit 45: Chart on Comparison by Channel
- Exhibit 46: Data Table on Comparison by Channel
- 7.3 Hospitals – Market size and forecast 2022-2027
- Exhibit 47: Chart on Hospitals – Market size and forecast 2022-2027 ($ million)
- Exhibit 48: Data Table on Hospitals – Market size and forecast 2022-2027 ($ million)
- Exhibit 49: Chart on Hospitals – Year-over-year growth 2022-2027 (%)
- Exhibit 50: Data Table on Hospitals – Year-over-year growth 2022-2027 (%)
- 7.4 Retailers – Market size and forecast 2022-2027
- Exhibit 51: Chart on Retailers – Market size and forecast 2022-2027 ($ million)
- Exhibit 52: Data Table on Retailers – Market size and forecast 2022-2027 ($ million)
- Exhibit 53: Chart on Retailers – Year-over-year growth 2022-2027 (%)
- Exhibit 54: Data Table on Retailers – Year-over-year growth 2022-2027 (%)
- 7.5 Online – Market size and forecast 2022-2027
- Exhibit 55: Chart on Online – Market size and forecast 2022-2027 ($ million)
- Exhibit 56: Data Table on Online – Market size and forecast 2022-2027 ($ million)
- Exhibit 57: Chart on Online – Year-over-year growth 2022-2027 (%)
- Exhibit 58: Data Table on Online – Year-over-year growth 2022-2027 (%)
- 7.6 Market opportunity by Channel
- Exhibit 59: Market opportunity by Channel ($ million)
8 Customer Landscape
- 8.1 Customer landscape overview
- Exhibit 60: Analysis of price sensitivity, lifecycle, customer purchase basket, adoption rates, and purchase criteria
9 Geographic Landscape
- 9.1 Geographic segmentation
- Exhibit 61: Chart on Market share by geography 2022-2027 (%)
- Exhibit 62: Data Table on Market share by geography 2022-2027 (%)
- 9.2 Geographic comparison
- Exhibit 63: Chart on Geographic comparison
- Exhibit 64: Data Table on Geographic comparison
- 9.3 North America – Market size and forecast 2022-2027
- Exhibit 65: Chart on North America – Market size and forecast 2022-2027 ($ million)
- Exhibit 66: Data Table on North America – Market size and forecast 2022-2027 ($ million)
- Exhibit 67: Chart on North America – Year-over-year growth 2022-2027 (%)
- Exhibit 68: Data Table on North America – Year-over-year growth 2022-2027 (%)
- 9.4 Europe – Market size and forecast 2022-2027
- Exhibit 69: Chart on Europe – Market size and forecast 2022-2027 ($ million)
- Exhibit 70: Data Table on Europe – Market size and forecast 2022-2027 ($ million)
- Exhibit 71: Chart on Europe – Year-over-year growth 2022-2027 (%)
- Exhibit 72: Data Table on Europe – Year-over-year growth 2022-2027 (%)
- 9.5 Asia – Market size and forecast 2022-2027
- Exhibit 73: Chart on Asia – Market size and forecast 2022-2027 ($ million)
- Exhibit 74: Data Table on Asia – Market size and forecast 2022-2027 ($ million)
- Exhibit 75: Chart on Asia – Year-over-year growth 2022-2027 (%)
- Exhibit 76: Data Table on Asia – Year-over-year growth 2022-2027 (%)
- 9.6 Rest of World (ROW) – Market size and forecast 2022-2027
- Exhibit 77: Chart on Rest of World (ROW) – Market size and forecast 2022-2027 ($ million)
- Exhibit 78: Data Table on Rest of World (ROW) – Market size and forecast 2022-2027 ($ million)
- Exhibit 79: Chart on Rest of World (ROW) – Year-over-year growth 2022-2027 (%)
- Exhibit 80: Data Table on Rest of World (ROW) – Year-over-year growth 2022-2027 (%)
- 9.7 US – Market size and forecast 2022-2027
- Exhibit 81: Chart on US – Market size and forecast 2022-2027 ($ million)
- Exhibit 82: Data Table on US – Market size and forecast 2022-2027 ($ million)
- Exhibit 83: Chart on US – Year-over-year growth 2022-2027 (%)
- Exhibit 84: Data Table on US – Year-over-year growth 2022-2027 (%)
- 9.8 UK – Market size and forecast 2022-2027
- Exhibit 85: Chart on UK – Market size and forecast 2022-2027 ($ million)
- Exhibit 86: Data Table on UK – Market size and forecast 2022-2027 ($ million)
- Exhibit 87: Chart on UK – Year-over-year growth 2022-2027 (%)
- Exhibit 88: Data Table on UK – Year-over-year growth 2022-2027 (%)
- 9.9 Canada – Market size and forecast 2022-2027
- Exhibit 89: Chart on Canada – Market size and forecast 2022-2027 ($ million)
- Exhibit 90: Data Table on Canada – Market size and forecast 2022-2027 ($ million)
- Exhibit 91: Chart on Canada – Year-over-year growth 2022-2027 (%)
- Exhibit 92: Data Table on Canada – Year-over-year growth 2022-2027 (%)
- 9.10 Japan – Market size and forecast 2022-2027
- Exhibit 93: Chart on Japan – Market size and forecast 2022-2027 ($ million)
- Exhibit 94: Data Table on Japan – Market size and forecast 2022-2027 ($ million)
- Exhibit 95: Chart on Japan – Year-over-year growth 2022-2027 (%)
- Exhibit 96: Data Table on Japan – Year-over-year growth 2022-2027 (%)
- 9.11 Germany – Market size and forecast 2022-2027
- Exhibit 97: Chart on Germany – Market size and forecast 2022-2027 ($ million)
- Exhibit 98: Data Table on Germany – Market size and forecast 2022-2027 ($ million)
- Exhibit 99: Chart on Germany – Year-over-year growth 2022-2027 (%)
- Exhibit 100: Data Table on Germany – Year-over-year growth 2022-2027 (%)
- 9.12 Market opportunity by geography
- Exhibit 101: Market opportunity by geography ($ million)
10 Drivers, Challenges, and Trends
- 10.3 Impact of drivers and challenges
- Exhibit 102: Impact of drivers and challenges in 2022 and 2027
11 Vendor Landscape
- 11.2 Vendor landscape
- Exhibit 103: Overview on Criticality of inputs and Factors of differentiation
- 11.3 Landscape disruption
- Exhibit 104: Overview on factors of disruption
- 11.4 Industry risks
- Exhibit 105: Impact of key risks on business
12 Vendor Analysis
- 12.1 Vendors covered
- Exhibit 106: Vendors covered
- 12.2 Market positioning of vendors
- Exhibit 107: Matrix on vendor position and classification
- 12.3 Abbott Laboratories
- Exhibit 108: Abbott Laboratories – Overview
- Exhibit 109: Abbott Laboratories – Business segments
- Exhibit 110: Abbott Laboratories – Key news
- Exhibit 111: Abbott Laboratories – Key offerings
- Exhibit 112: Abbott Laboratories – Segment focus
- 12.4 Bharat Biotech Ltd.
- Exhibit 113: Bharat Biotech Ltd. – Overview
- Exhibit 114: Bharat Biotech Ltd. – Product / Service
- Exhibit 115: Bharat Biotech Ltd. – Key news
- Exhibit 116: Bharat Biotech Ltd. – Key offerings
- 12.5 Biological E. Ltd.
- Exhibit 117: Biological E. Ltd. – Overview
- Exhibit 118: Biological E. Ltd. – Product / Service
- Exhibit 119: Biological E. Ltd. – Key offerings
- 12.6 Cadila Healthcare Ltd.
- Exhibit 120: Cadila Healthcare Ltd. – Overview
- Exhibit 121: Cadila Healthcare Ltd. – Business segments
- Exhibit 122: Cadila Healthcare Ltd. – Key offerings
- Exhibit 123: Cadila Healthcare Ltd. – Segment focus
- 12.7 CSL Ltd.
- Exhibit 124: CSL Ltd. – Overview
- Exhibit 125: CSL Ltd. – Business segments
- Exhibit 126: CSL Ltd. – Key news
- Exhibit 127: CSL Ltd. – Key offerings
- Exhibit 128: CSL Ltd. – Segment focus
- 12.8 Daiichi Sankyo Co. Ltd.
- Exhibit 129: Daiichi Sankyo Co. Ltd. – Overview
- Exhibit 130: Daiichi Sankyo Co. Ltd. – Business segments
- Exhibit 131: Daiichi Sankyo Co. Ltd. – Key news
- Exhibit 132: Daiichi Sankyo Co. Ltd. – Key offerings
- Exhibit 133: Daiichi Sankyo Co. Ltd. – Segment focus
- 12.9 GlaxoSmithKline Plc
- Exhibit 134: GlaxoSmithKline Plc – Overview
- Exhibit 135: GlaxoSmithKline Plc – Business segments
- Exhibit 136: GlaxoSmithKline Plc – Key offerings
- Exhibit 137: GlaxoSmithKline Plc – Segment focus
- 12.10 Grifols SA
- Exhibit 138: Grifols SA – Overview
- Exhibit 139: Grifols SA – Business segments
- Exhibit 140: Grifols SA – Key offerings
- Exhibit 141: Grifols SA – Segment focus
- 12.11 LG Corp.
- Exhibit 142: LG Corp. – Overview
- Exhibit 143: LG Corp. – Business segments
- Exhibit 144: LG Corp. – Key offerings
- Exhibit 145: LG Corp. – Segment focus
- 12.12 Meiji Holdings Co. Ltd.
- Exhibit 146: Meiji Holdings Co. Ltd. – Overview
- Exhibit 147: Meiji Holdings Co. Ltd. – Business segments
- Exhibit 148: Meiji Holdings Co. Ltd. – Key news
- Exhibit 149: Meiji Holdings Co. Ltd. – Key offerings
- Exhibit 150: Meiji Holdings Co. Ltd. – Segment focus
- 12.13 Merck and Co. Inc.
- Exhibit 151: Merck and Co. Inc. – Overview
- Exhibit 152: Merck and Co. Inc. – Business segments
- Exhibit 153: Merck and Co. Inc. – Key news
- Exhibit 154: Merck and Co. Inc. – Key offerings
- Exhibit 155: Merck and Co. Inc. – Segment focus
- 12.14 Mitsubishi Chemical Holdings Corp.
- Exhibit 156: Mitsubishi Chemical Holdings Corp. – Overview
- Exhibit 157: Mitsubishi Chemical Holdings Corp. – Business segments
- Exhibit 158: Mitsubishi Chemical Holdings Corp. – Key offerings
- Exhibit 159: Mitsubishi Chemical Holdings Corp. – Segment focus
- 12.15 Pfizer Inc.
- Exhibit 160: Pfizer Inc. – Overview
- Exhibit 161: Pfizer Inc. – Product / Service
- Exhibit 162: Pfizer Inc. – Key news
- Exhibit 163: Pfizer Inc. – Key offerings
- 12.16 Sanofi SA
- Exhibit 164: Sanofi SA – Overview
- Exhibit 165: Sanofi SA – Business segments
- Exhibit 166: Sanofi SA – Key news
- Exhibit 167: Sanofi SA – Key offerings
- Exhibit 168: Sanofi SA – Segment focus
- 12.17 Serum Institute of India Pvt. Ltd.
- Exhibit 169: Serum Institute of India Pvt. Ltd. – Overview
- Exhibit 170: Serum Institute of India Pvt. Ltd. – Product / Service
- Exhibit 171: Serum Institute of India Pvt. Ltd. – Key offerings
13 Appendix
- 13.1 Scope of the report
- 13.2 Inclusions and exclusions checklist
- Exhibit 172: Inclusions checklist
- Exhibit 173: Exclusions checklist
- 13.3 Currency conversion rates for US$
- Exhibit 174: Currency conversion rates for US$
- 13.4 Research methodology
- Exhibit 175: Research methodology
- Exhibit 176: Validation techniques employed for market sizing
- Exhibit 177: Information sources
- 13.5 List of abbreviations
- Exhibit 178: List of abbreviations
About Us
Technavio is a leading global technology research and advisory company. Their research and analysis focus on emerging market trends and provides actionable insights to help businesses identify market opportunities and develop effective strategies to optimize their market positions. With over 500 specialized analysts, Technavio’s report library consists of more than 17,000 reports and counting, covering 800 technologies, spanning across 50 countries. Their client base consists of enterprises of all sizes, including more than 100 Fortune 500 companies. This growing client base relies on Technavio’s comprehensive coverage, extensive research, and actionable market insights to identify opportunities in existing and potential markets and assess their competitive positions within changing market scenarios.
Contact
Technavio Research
Jesse Maida
Media & Marketing Executive
US: +1 844 364 1100
UK: +44 203 893 3200
Email: [email protected]
Website: www.technavio.com/
SOURCE Technavio
