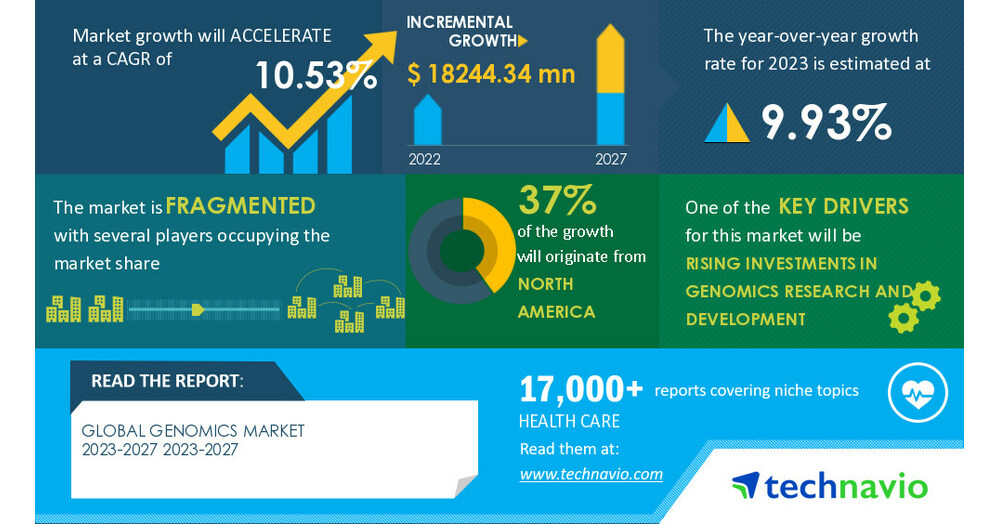
NEW YORK, June 19, 2023 /PRNewswire/ — The global genomics market size is estimated to increase by USD 18,244.34 million from 2022 to 2027. The market’s growth momentum will progress at a CAGR of 10.53% during the forecast period. Discover some insights on market size historic period (2017 to 2021) and Forecast (2023 to 2027) before buying the full report -Request a sample report
Genomics market – Vendor Analysis
Vendor Landscape – The global genomics market is fragmented, with the presence of several global as well as regional vendors. A few prominent vendors that offer genomics in the market are 10X Genomics Inc., Abcam plc, Agilent Technologies Inc., Becton Dickinson and Co., BGI Genomics Co. Ltd., Bio Rad Laboratories Inc., Danaher Corp., Eppendorf SE, F. Hoffmann La Roche Ltd., Hamilton Bonaduz AG, Illumina Inc., Myriad Genetics Inc., New England Biolabs Inc., Oxford Nanopore Technologies plc, Pacific Biosciences of California Inc., Promega Corp., QIAGEN NV, Standard BioTools Inc., Thermo Fisher Scientific Inc., and Perkin Elmer Inc and others.
What’s New? –
- Special coverage on the Russia–Ukraine war; global inflation; recovery analysis from COVID-19; supply chain disruptions, global trade tensions; and risk of recession
- Global competitiveness and key competitor positions
- Market presence across multiple geographical footprints – Strong/Active/Niche/Trivial – Buy the report!
Vendor Offerings –
- 10X Genomics Inc. – The company offers genomics such as single-cell gene expression and single-cell immune profiling.
- Abcam plc – The company offers genomics such as multi-omic cytometry single-cell immune profiling solutions.
- Agilent Technologies Inc. – The company offers genomics such as NGS workflow for translational research.
- For details on the vendor and their offerings – Request a sample report
Genomics Market – Segmentation Assessment
Segment Overview
This genomics market report extensively covers market segmentation by solution (products and services), application (diagnostic, drug discovery, and others), and geography (North America, Europe, Asia, and the Rest of the World).
- The market share growth by the products segment will be significant for overall market growth during the forecast period. This segment covers the instruments and consumables used in research and testing. Instruments such as Polymerase chain reaction systems, Clustered Regularly Interspaced Short Palindromic Repeats -Cas systems, next-generation sequencers, and microarray instruments, which are routinely used in performing nucleic acid extraction, isolation, purification, gene cloning/amplification, high-throughput sequencing, and gene expression are all included in this segment. Thus, market vendors focus on offering fully automated workflows by partnering with leading automation vendors. Hence, such factors drive the segment growth during the forecast period.
Geography Overview
By geography, the global genomics market is segmented into North America, Europe, Asia, and Rest of World (ROW). The report provides actionable insights and estimates the contribution of all regions to the growth of the global genomics market.
- North America is estimated to account for 37% of the growth of the global market during the forecast period. The regional growth can be attributed to an increase in research funding and the growing developments in precision medicine and personalized therapies. Moreover, the market in the region has the presence of many prominent players, such as Illumina, Bio-Rad Laboratories, Agilent Technologies, Thermo Fisher Scientific, PerkinElmer, and Fluidigm Corp. Hence, these factors will boost the regional market during the forecast period.
For insights on global, regional, and country-level parameters with growth opportunities from 2017 to 2027 – Download a Sample Report
Genomics Market – Market Dynamics
Leading Drivers –
The increasing demand for creating and upgrading genome databases notably drives the market growth. These are repositories of genetic information, which have become an integral part of genome informatics. High demand for the creation of accurate and complete genetic databases focused on humans, microbes, viruses, plants, and animals can be observed due to the rising focus on the use of a reference-based approach in genomics research.
Such databases have significantly helped researchers and healthcare practitioners in understanding genetic structures, anomalies, and disorders through the identification of genomic variants. Hence, such factors drive the growth of the market during the forecast period.
Key Trends –
The growing adoption of single-cell-based genomics analysis is an emerging trend influencing the growth of the market. Generally, the analysis involves the extraction and isolation of genetic material at a single-cell level or from a homogenized cell sample.
Also, it allows researchers to examine the sequence information from individualized cells by providing precise measurements, high resolution of cellular differences, and improved understanding of cell functioning. Furthermore, sequencing the DNA of an individual cell provides information on the genetic mutation that is carried by a small population of cells, which helps in the understanding of cell-to-cell variability. Hence, such trend fuel the market growth during the forecast period.
Major challenges –
A shortage of skilled genetics professionals is a major challenge that may hinder market growth. Genomics studies involve the performance of highly sensitive and complex procedures. The procedures include gene editing, multiplexing, sequencing, and amplification. Such procedures use sophisticated instruments like PCR instruments, sequencers, analyzers, microarray equipment, liquid handling equipment, and centrifuges, and thus, proper handling of such instruments mandates trained laboratory professionals.
Additionally, the adoption of genomics solutions in new clinical and research applications is also increasing but the shortage of trained genetic professionals has resulted in false result interpretations and myriad observations during genetic research and testing. Hence, the shortage of trained experts becomes one of the major challenges that will hinder the global market during the forecast period.
Drivers, Trends, and challenges have an impact on market dynamics, which can impact businesses. Find more insights in a sample report!
What are the key data covered in this Genomics Market report?
- CAGR of the market during the forecast period
- Detailed information on factors that will drive the growth of the genomics market between 2023 and 2027
- Precise estimation of the size of the genomics market and its contribution to the market with a focus on the parent market
- Accurate predictions about upcoming trends and changes in consumer behavior
- Growth of the genomics market across North America, Europe, Asia, and Rest of World (ROW)
- A thorough analysis of the market’s competitive landscape and detailed information about vendors
- Comprehensive analysis of factors that will challenge the growth of genomics market vendors
Gain instant access to 17,000+ market research reports.
Technavio’s SUBSCRIPTION platform
Related Reports:
The spatial genomics and transcriptomics market size is expected to increase to USD 401.47 million from 2021 to 2026, and the market’s growth momentum will accelerate at a CAGR of 9.06%. Furthermore, this report extensively covers spatial genomics and transcriptomics market segmentation by product (instruments and consumables) and geography (North America, Europe, Asia, and Rest of World (ROW)). The surge in the adoption of spatial genomics and transcriptomics in drug discovery and development is notably driving the spatial genomics and transcriptomics market growth.
The pharmacogenomics market size is expected to increase by USD 2.50 billion from 2021 to 2026, and the market’s growth momentum will accelerate at a CAGR of 6.93%. Furthermore, this report extensively covers pharmacogenomics market segmentation by end-user (hospitals and clinics, research organizations, and academics) and geography (North America, Europe, Asia, and the Rest of the World (ROW)). The rising prevalence of genetic diseases and disorders is notably driving the pharmacogenomics market growth.
|
Genomics Market Scope |
|
|
Report Coverage |
Details |
|
Historic period |
2017-2021 |
|
Forecast period |
2023-2027 |
|
Growth momentum & CAGR |
Accelerate at a CAGR of 10.53% |
|
Market growth 2023-2027 |
USD 18,244.34 million |
|
Market structure |
Fragmented |
|
YoY growth 2022-2023 (%) |
9.93 |
|
Regional analysis |
North America, Europe, Asia, and Rest of World (ROW) |
|
Performing market contribution |
North America at 37% |
|
Key countries |
US, France, Germany, UK, and China, Canada, Mexico, Italy,Spain, India, Japan, Australia, and South Korea |
|
Competitive landscape |
Leading Vendors, Market Positioning of Vendors, Competitive Strategies, and Industry Risks |
|
Key companies profiled |
10X Genomics Inc., Abcam plc, Agilent Technologies Inc., Becton Dickinson and Co., BGI Genomics Co. Ltd., Bio Rad Laboratories Inc., Danaher Corp., Eppendorf SE, F. Hoffmann La Roche Ltd., Hamilton Bonaduz AG, Illumina Inc., Myriad Genetics Inc., New England Biolabs Inc., Oxford Nanopore Technologies plc, Pacific Biosciences of California Inc., Promega Corp., QIAGEN NV, Standard BioTools Inc., Thermo Fisher Scientific Inc., and Perkin Elmer Inc |
|
Market dynamics |
Parent market analysis, Market growth inducers and obstacles, Fast-growing and slow-growing segment analysis, COVID-19 impact and recovery analysis and future consumer dynamics, Market condition analysis for forecast period. |
|
Customization purview |
If our report has not included the data that you are looking for, you can reach out to our analysts and get segments customized. |
Table of Contents
1 Executive Summary
- 1.1 Market overview
- Exhibit 01: Executive Summary – Chart on Market Overview
- Exhibit 02: Executive Summary – Data Table on Market Overview
- Exhibit 03: Executive Summary – Chart on Global Market Characteristics
- Exhibit 04: Executive Summary – Chart on Market by Geography
- Exhibit 05: Executive Summary – Chart on Market Segmentation by Solution
- Exhibit 06: Executive Summary – Chart on Market Segmentation by Application
- Exhibit 07: Executive Summary – Chart on Incremental Growth
- Exhibit 08: Executive Summary – Data Table on Incremental Growth
- Exhibit 09: Executive Summary – Chart on Vendor Market Positioning
2 Market Landscape
- 2.1 Market ecosystem
- Exhibit 10: Parent market
- Exhibit 11: Market Characteristics
3 Market Sizing
- 3.1 Market definition
- Exhibit 12: Offerings of vendors included in the market definition
- 3.2 Market segment analysis
- Exhibit 13: Market segments
- 3.4 Market outlook: Forecast for 2022-2027
- Exhibit 14: Chart on Global – Market size and forecast 2022-2027 ($ million)
- Exhibit 15: Data Table on Global – Market size and forecast 2022-2027 ($ million)
- Exhibit 16: Chart on Global Market: Year-over-year growth 2022-2027 (%)
- Exhibit 17: Data Table on Global Market: Year-over-year growth 2022-2027 (%)
4 Historic Market Size
- 4.1 Global genomics market 2017 – 2021
- Exhibit 18: Historic Market Size – Data Table on Global genomics market 2017 – 2021 ($ million)
- 4.2 Solution Segment Analysis 2017 – 2021
- Exhibit 19: Historic Market Size – Solution Segment 2017 – 2021 ($ million)
- 4.3 Application Segment Analysis 2017 – 2021
- Exhibit 20: Historic Market Size – Application Segment 2017 – 2021 ($ million)
- 4.4 Geography Segment Analysis 2017 – 2021
- Exhibit 21: Historic Market Size – Geography Segment 2017 – 2021 ($ million)
- 4.5 Country Segment Analysis 2017 – 2021
- Exhibit 22: Historic Market Size – Country Segment 2017 – 2021 ($ million)
5 Five Forces Analysis
- 5.1 Five forces summary
- Exhibit 23: Five forces analysis – Comparison between 2022 and 2027
- 5.2 Bargaining power of buyers
- Exhibit 24: Chart on Bargaining power of buyers – Impact of key factors 2022 and 2027
- 5.3 Bargaining power of suppliers
- Exhibit 25: Bargaining power of suppliers – Impact of key factors in 2022 and 2027
- 5.4 Threat of new entrants
- Exhibit 26: Threat of new entrants – Impact of key factors in 2022 and 2027
- 5.5 Threat of substitutes
- Exhibit 27: Threat of substitutes – Impact of key factors in 2022 and 2027
- 5.6 Threat of rivalry
- Exhibit 28: Threat of rivalry – Impact of key factors in 2022 and 2027
- 5.7 Market condition
- Exhibit 29: Chart on Market condition – Five forces 2022 and 2027
6 Market Segmentation by Solution
- 6.1 Market segments
- Exhibit 30: Chart on Solution – Market share 2022-2027 (%)
- Exhibit 31: Data Table on Solution – Market share 2022-2027 (%)
- 6.2 Comparison by Solution
- Exhibit 32: Chart on Comparison by Solution
- Exhibit 33: Data Table on Comparison by Solution
- 6.3 Products – Market size and forecast 2022-2027
- Exhibit 34: Chart on Products – Market size and forecast 2022-2027 ($ million)
- Exhibit 35: Data Table on Products – Market size and forecast 2022-2027 ($ million)
- Exhibit 36: Chart on Products – Year-over-year growth 2022-2027 (%)
- Exhibit 37: Data Table on Products – Year-over-year growth 2022-2027 (%)
- 6.4 Services – Market size and forecast 2022-2027
- Exhibit 38: Chart on Services – Market size and forecast 2022-2027 ($ million)
- Exhibit 39: Data Table on Services – Market size and forecast 2022-2027 ($ million)
- Exhibit 40: Chart on Services – Year-over-year growth 2022-2027 (%)
- Exhibit 41: Data Table on Services – Year-over-year growth 2022-2027 (%)
- 6.5 Market opportunity by Solution
- Exhibit 42: Market opportunity by Solution ($ million)
7 Market Segmentation by Application
- 7.1 Market segments
- Exhibit 43: Chart on Application – Market share 2022-2027 (%)
- Exhibit 44: Data Table on Application – Market share 2022-2027 (%)
- 7.2 Comparison by Application
- Exhibit 45: Chart on Comparison by Application
- Exhibit 46: Data Table on Comparison by Application
- 7.3 Diagnostic – Market size and forecast 2022-2027
- Exhibit 47: Chart on Diagnostic – Market size and forecast 2022-2027 ($ million)
- Exhibit 48: Data Table on Diagnostic – Market size and forecast 2022-2027 ($ million)
- Exhibit 49: Chart on Diagnostic – Year-over-year growth 2022-2027 (%)
- Exhibit 50: Data Table on Diagnostic – Year-over-year growth 2022-2027 (%)
- 7.4 Drug discovery – Market size and forecast 2022-2027
- Exhibit 51: Chart on Drug discovery – Market size and forecast 2022-2027 ($ million)
- Exhibit 52: Data Table on Drug discovery – Market size and forecast 2022-2027 ($ million)
- Exhibit 53: Chart on Drug discovery – Year-over-year growth 2022-2027 (%)
- Exhibit 54: Data Table on Drug discovery – Year-over-year growth 2022-2027 (%)
- 7.5 Others – Market size and forecast 2022-2027
- Exhibit 55: Chart on Others – Market size and forecast 2022-2027 ($ million)
- Exhibit 56: Data Table on Others – Market size and forecast 2022-2027 ($ million)
- Exhibit 57: Chart on Others – Year-over-year growth 2022-2027 (%)
- Exhibit 58: Data Table on Others – Year-over-year growth 2022-2027 (%)
- 7.6 Market opportunity by Application
- Exhibit 59: Market opportunity by Application ($ million)
8 Customer Landscape
- 8.1 Customer landscape overview
- Exhibit 60: Analysis of price sensitivity, lifecycle, customer purchase basket, adoption rates, and purchase criteria
9 Geographic Landscape
- 9.1 Geographic segmentation
- Exhibit 61: Chart on Market share by geography 2022-2027 (%)
- Exhibit 62: Data Table on Market share by geography 2022-2027 (%)
- 9.2 Geographic comparison
- Exhibit 63: Chart on Geographic comparison
- Exhibit 64: Data Table on Geographic comparison
- 9.3 North America – Market size and forecast 2022-2027
- Exhibit 65: Chart on North America – Market size and forecast 2022-2027 ($ million)
- Exhibit 66: Data Table on North America – Market size and forecast 2022-2027 ($ million)
- Exhibit 67: Chart on North America – Year-over-year growth 2022-2027 (%)
- Exhibit 68: Data Table on North America – Year-over-year growth 2022-2027 (%)
- 9.4 Europe – Market size and forecast 2022-2027
- Exhibit 69: Chart on Europe – Market size and forecast 2022-2027 ($ million)
- Exhibit 70: Data Table on Europe – Market size and forecast 2022-2027 ($ million)
- Exhibit 71: Chart on Europe – Year-over-year growth 2022-2027 (%)
- Exhibit 72: Data Table on Europe – Year-over-year growth 2022-2027 (%)
- 9.5 Asia – Market size and forecast 2022-2027
- Exhibit 73: Chart on Asia – Market size and forecast 2022-2027 ($ million)
- Exhibit 74: Data Table on Asia – Market size and forecast 2022-2027 ($ million)
- Exhibit 75: Chart on Asia – Year-over-year growth 2022-2027 (%)
- Exhibit 76: Data Table on Asia – Year-over-year growth 2022-2027 (%)
- 9.6 Rest of World (ROW) – Market size and forecast 2022-2027
- Exhibit 77: Chart on Rest of World (ROW) – Market size and forecast 2022-2027 ($ million)
- Exhibit 78: Data Table on Rest of World (ROW) – Market size and forecast 2022-2027 ($ million)
- Exhibit 79: Chart on Rest of World (ROW) – Year-over-year growth 2022-2027 (%)
- Exhibit 80: Data Table on Rest of World (ROW) – Year-over-year growth 2022-2027 (%)
- 9.7 US – Market size and forecast 2022-2027
- Exhibit 81: Chart on US – Market size and forecast 2022-2027 ($ million)
- Exhibit 82: Data Table on US – Market size and forecast 2022-2027 ($ million)
- Exhibit 83: Chart on US – Year-over-year growth 2022-2027 (%)
- Exhibit 84: Data Table on US – Year-over-year growth 2022-2027 (%)
- 9.8 China – Market size and forecast 2022-2027
- Exhibit 85: Chart on China – Market size and forecast 2022-2027 ($ million)
- Exhibit 86: Data Table on China – Market size and forecast 2022-2027 ($ million)
- Exhibit 87: Chart on China – Year-over-year growth 2022-2027 (%)
- Exhibit 88: Data Table on China – Year-over-year growth 2022-2027 (%)
- 9.9 UK – Market size and forecast 2022-2027
- Exhibit 89: Chart on UK – Market size and forecast 2022-2027 ($ million)
- Exhibit 90: Data Table on UK – Market size and forecast 2022-2027 ($ million)
- Exhibit 91: Chart on UK – Year-over-year growth 2022-2027 (%)
- Exhibit 92: Data Table on UK – Year-over-year growth 2022-2027 (%)
- 9.10 Germany – Market size and forecast 2022-2027
- Exhibit 93: Chart on Germany – Market size and forecast 2022-2027 ($ million)
- Exhibit 94: Data Table on Germany – Market size and forecast 2022-2027 ($ million)
- Exhibit 95: Chart on Germany – Year-over-year growth 2022-2027 (%)
- Exhibit 96: Data Table on Germany – Year-over-year growth 2022-2027 (%)
- 9.11 France – Market size and forecast 2022-2027
- Exhibit 97: Chart on France – Market size and forecast 2022-2027 ($ million)
- Exhibit 98: Data Table on France – Market size and forecast 2022-2027 ($ million)
- Exhibit 99: Chart on France – Year-over-year growth 2022-2027 (%)
- Exhibit 100: Data Table on France – Year-over-year growth 2022-2027 (%)
- 9.12 Market opportunity by geography
- Exhibit 101: Market opportunity by geography ($ million)
10 Drivers, Challenges, and Trends
- 10.3 Impact of drivers and challenges
- Exhibit 102: Impact of drivers and challenges in 2022 and 2027
11 Vendor Landscape
- 11.2 Vendor landscape
- Exhibit 103: Overview on Criticality of inputs and Factors of differentiation
- 11.3 Landscape disruption
- Exhibit 104: Overview on factors of disruption
- 11.4 Industry risks
- Exhibit 105: Impact of key risks on business
12 Vendor Analysis
- 12.1 Vendors covered
- Exhibit 106: Vendors covered
- 12.2 Market positioning of vendors
- Exhibit 107: Matrix on vendor position and classification
- 12.3 10X Genomics Inc.
- Exhibit 108: 10X Genomics Inc. – Overview
- Exhibit 109: 10X Genomics Inc. – Product / Service
- Exhibit 110: 10X Genomics Inc. – Key offerings
- 12.4 Abcam plc
- Exhibit 111: Abcam plc – Overview
- Exhibit 112: Abcam plc – Product / Service
- Exhibit 113: Abcam plc – Key news
- Exhibit 114: Abcam plc – Key offerings
- 12.5 Agilent Technologies Inc.
- Exhibit 115: Agilent Technologies Inc. – Overview
- Exhibit 116: Agilent Technologies Inc. – Business segments
- Exhibit 117: Agilent Technologies Inc. – Key news
- Exhibit 118: Agilent Technologies Inc. – Key offerings
- Exhibit 119: Agilent Technologies Inc. – Segment focus
- 12.6 Becton Dickinson and Co.
- Exhibit 120: Becton Dickinson and Co. – Overview
- Exhibit 121: Becton Dickinson and Co. – Business segments
- Exhibit 122: Becton Dickinson and Co. – Key news
- Exhibit 123: Becton Dickinson and Co. – Key offerings
- Exhibit 124: Becton Dickinson and Co. – Segment focus
- 12.7 BGI Genomics Co. Ltd.
- Exhibit 125: BGI Genomics Co. Ltd. – Overview
- Exhibit 126: BGI Genomics Co. Ltd. – Product / Service
- Exhibit 127: BGI Genomics Co. Ltd. – Key offerings
- 12.8 Bio Rad Laboratories Inc.
- Exhibit 128: Bio Rad Laboratories Inc. – Overview
- Exhibit 129: Bio Rad Laboratories Inc. – Business segments
- Exhibit 130: Bio Rad Laboratories Inc. – Key news
- Exhibit 131: Bio Rad Laboratories Inc. – Key offerings
- Exhibit 132: Bio Rad Laboratories Inc. – Segment focus
- 12.9 Danaher Corp.
- Exhibit 133: Danaher Corp. – Overview
- Exhibit 134: Danaher Corp. – Business segments
- Exhibit 135: Danaher Corp. – Key news
- Exhibit 136: Danaher Corp. – Key offerings
- Exhibit 137: Danaher Corp. – Segment focus
- 12.10 Eppendorf SE
- Exhibit 138: Eppendorf SE – Overview
- Exhibit 139: Eppendorf SE – Product / Service
- Exhibit 140: Eppendorf SE – Key news
- Exhibit 141: Eppendorf SE – Key offerings
- 12.11 F. Hoffmann La Roche Ltd.
- Exhibit 142: F. Hoffmann La Roche Ltd. – Overview
- Exhibit 143: F. Hoffmann La Roche Ltd. – Business segments
- Exhibit 144: F. Hoffmann La Roche Ltd. – Key news
- Exhibit 145: F. Hoffmann La Roche Ltd. – Key offerings
- Exhibit 146: F. Hoffmann La Roche Ltd. – Segment focus
- 12.12 Illumina Inc.
- Exhibit 147: Illumina Inc. – Overview
- Exhibit 148: Illumina Inc. – Business segments
- Exhibit 149: Illumina Inc. – Key news
- Exhibit 150: Illumina Inc. – Key offerings
- Exhibit 151: Illumina Inc. – Segment focus
- 12.13 Myriad Genetics Inc.
- Exhibit 152: Myriad Genetics Inc. – Overview
- Exhibit 153: Myriad Genetics Inc. – Product / Service
- Exhibit 154: Myriad Genetics Inc. – Key offerings
- 12.14 Oxford Nanopore Technologies plc
- Exhibit 155: Oxford Nanopore Technologies plc – Overview
- Exhibit 156: Oxford Nanopore Technologies plc – Product / Service
- Exhibit 157: Oxford Nanopore Technologies plc – Key offerings
- 12.15 Pacific Biosciences of California Inc.
- Exhibit 158: Pacific Biosciences of California Inc. – Overview
- Exhibit 159: Pacific Biosciences of California Inc. – Product / Service
- Exhibit 160: Pacific Biosciences of California Inc. – Key offerings
- 12.16 QIAGEN NV
- Exhibit 161: QIAGEN NV – Overview
- Exhibit 162: QIAGEN NV – Product / Service
- Exhibit 163: QIAGEN NV – Key news
- Exhibit 164: QIAGEN NV – Key offerings
- 12.17 Standard BioTools Inc.
- Exhibit 165: Standard BioTools Inc. – Overview
- Exhibit 166: Standard BioTools Inc. – Product / Service
- Exhibit 167: Standard BioTools Inc. – Key news
- Exhibit 168: Standard BioTools Inc. – Key offerings
13 Appendix
- 13.1 Scope of the report
- 13.2 Inclusions and exclusions checklist
- Exhibit 169: Inclusions checklist
- Exhibit 170: Exclusions checklist
- 13.3 Currency conversion rates for US$
- Exhibit 171: Currency conversion rates for US$
- 13.4 Research methodology
- Exhibit 172: Research methodology
- Exhibit 173: Validation techniques employed for market sizing
- Exhibit 174: Information sources
- 13.5 List of abbreviations
- Exhibit 175: List of abbreviations
About Us
Technavio is a leading global technology research and advisory company. Their research and analysis focus on emerging market trends and provide actionable insights to help businesses identify market opportunities and develop effective strategies to optimize their market positions. With over 500 specialized analysts, Technavio’s report library consists of more than 17,000 reports and counting, covering 800 technologies, spanning 50 countries. Their client base consists of enterprises of all sizes, including more than 100 Fortune 500 companies. This growing client base relies on Technavio’s comprehensive coverage, extensive research, and actionable market insights to identify opportunities in existing and potential markets and assess their competitive positions within changing market scenarios.
Contact
Technavio Research
Jesse Maida
Media & Marketing Executive
US: +1 844 364 1100
UK: +44 203 893 3200
Email: [email protected]
Website: www.technavio.com
SOURCE Technavio
