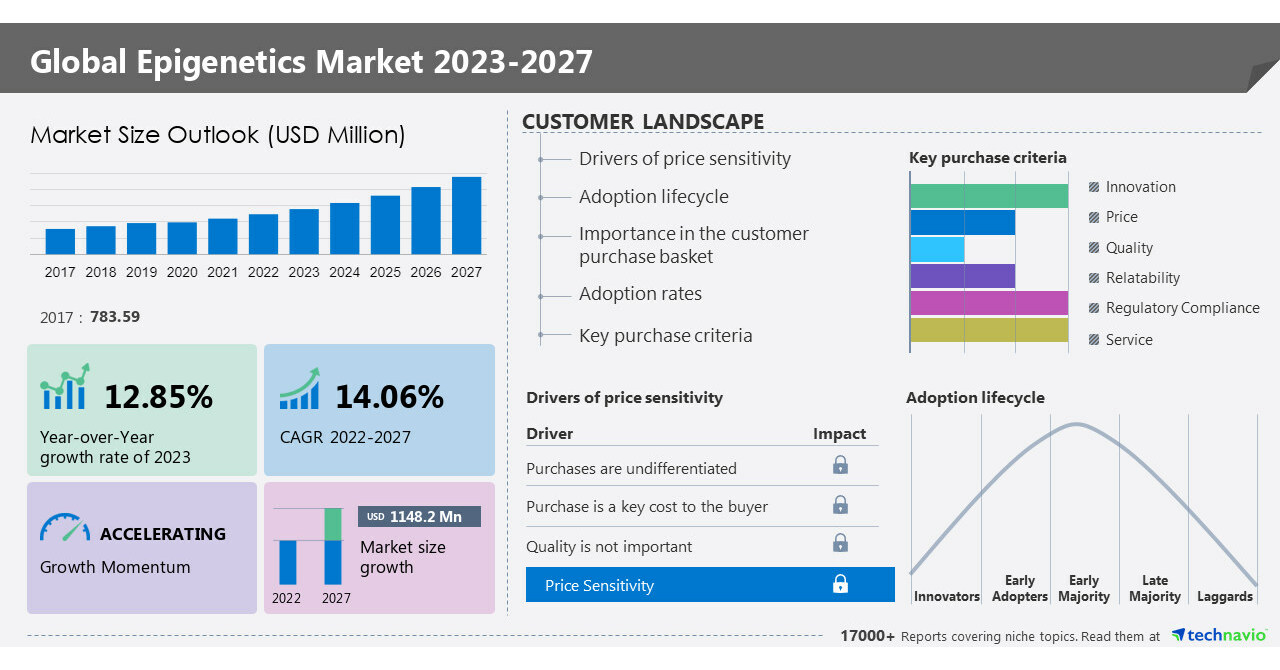
NEW YORK, June 16, 2023 /PRNewswire/ — The epigenetics market size is expected to grow by USD 1,148.2 million during 2022-2027, progressing at a CAGR of 14.06% as per the latest Technavio market research report. North America is going to have lucrative growth during the forecast period. North America is estimated to contribute 40% of the global market during the forecast period. Technavio’s analysts have elaborately explained the regional trends and drivers that shape the market during the forecast period. Furthermore, the growing incidence of chronic diseases, increasing healthcare expenditure, and the presence of key vendors are leading to a rise in the use of epigenetics in North America. Leading biotechnology and life sciences companies export epigenetics instruments to other regions, such as Asia and South America. The large number of clinical trials is also driving the demand for epigenetics across North America. For more insights on the market share of various regions- Download sample report in MINUTES
What’s New?
- Special coverage on the Russia–Ukraine war; global inflation; recovery analysis from COVID-19; supply chain disruptions, global trade tensions; and risk of recession
- Global competitiveness and key competitor positions
- Market presence across multiple geographical footprints – Strong/Active/Niche/Trivial – buy the report!
Epigenetics Market: The increasing prevalence of CVDs to drive growth
- A major factor driving the growth of the epigenetics market is the rising prevalence of CVDs.
- The prevalence of CVDs is estimated to be equal among men and women across different countries.
- Low awareness, particularly in the developing economies of Asia, is one of the major reasons for the spread of CVDs.
- Smoking, high cardiac rhythm, atherosclerosis, diabetes, and high cholesterol are other risk factors contributing to the prevalence of CVDs.
- Hence, epigenetics solutions are required to treat CVD patients, which, in turn, is anticipated to grow their demand during the forecast period.
Epigenetics Market: The rising number of genome projects is a key market trend
- The increasing number of genome projects is one of the emerging market trends.
- The number of genome projects undertaken by researchers and scientists has grown in recent years.
- For instance, the Human Genome Project (HGP), coordinated by the National Institutes of Health (NIH) and the US Department of Energy, was an international research project aimed at determining the sequence of the human genome.
- Additionally, these kinds of projects help researchers understand the functions of genes and proteins, which play a significant role in the fields of medicine, biotechnology, and life sciences.
- Researchers, scientists, and clinicians use epigenetics solutions to study the role of DNA and genes that cause complex diseases.
- Therefore, the increasing emphasis of researchers and scientists on genome projects is increasing the adoption of epigenetics solutions for applications such as DNA sequencing, which will support market expansion during the forecast period.
To know about more drivers, trends along with challenges – Download a sample now!
Some of the key Epigenetics Market Players:
The epigenetics market is fragmented and the vendors are deploying organic and inorganic growth strategies to compete in the market. Some of the key vendors covered in the report include Abcam plc, Active Motif Inc., Agilent Technologies Inc., Bio Rad Laboratories Inc., Bio-Techne Corp., BioVision Inc., CellCentric Ltd., Enzo Biochem Inc., EpiGentek Group Inc., F. Hoffmann La Roche Ltd., Hologic Inc., Illumina Inc., Merck KGaA, New England Biolabs Inc., Pacific Biosciences of California Inc., Perkin Elmer Inc., Promega Corp., QIAGEN NV, Thermo Fisher Scientific Inc., and Zymo Research Corp.
Market Segmentation:
The market is segmented by application (oncology and non-oncology), product (reagents, kits, and others), and geography (North America, Europe, Asia, and Rest of World (ROW)).
- The market share growth by the oncology segment will be significant for overall market growth during the forecast period. The increasing prevalence of cancer will increase the adoption of epigenetics. Cancer is caused by multiple factors, including genetics, lifestyle choices, and exposure to certain environmental factors. Epigenetics solutions help in identifying diseases such as cancer. Globally, researchers are working on identifying and categorizing epigenetic patterns linked to cancer, and each identified change must be confirmed in many patients. Thus, the demand for epigenetics solutions is anticipated to increase in the oncology segment and these factors will boost the growth of the segment during the forecast period.
Gain instant access to 17,000+ market research reports
Technavio’s SUBSCRIPTION platform
Related Reports:
The endocrinology drugs market size is estimated to grow at a CAGR of 7.82% between 2022 and 2027. This market report extensively covers market segmentation by distribution channel (hospital pharmacies, retail pharmacies, and online pharmacies), therapy area (diabetes drugs, HGH, thyroid hormone, others), and geography (North America, Europe, Asia, and the Rest of the World (ROW)). The increase in the incidence of endocrine disorders is notably driving the endocrinology drug market growth.
The colorectal cancer therapeutics market share is expected to increase to USD 2.45 bn from 2021 to 2026, and the market’s growth momentum will accelerate at a CAGR of 5.43%. This report extensively covers colorectal cancer therapeutics market segmentation by type (targeted therapy, immunotherapy, and chemotherapy) and geography (North America, Europe, Asia, and the Rest of the World (ROW)). One of the key factors driving the global colorectal cancer therapeutics market growth is the increasing geriatric population.
|
Epigenetics Market Scope |
|
|
Report Coverage |
Details |
|
Base year |
2022 |
|
Historic period |
2017-2021 |
|
Forecast period |
2023-2027 |
|
Growth momentum & CAGR |
Accelerate at a CAGR of 14.06% |
|
Market growth 2023-2027 |
USD 1,148.2 million |
|
Market structure |
Fragmented |
|
YoY growth 2022-2023 (%) |
12.85 |
|
Regional analysis |
North America, Europe, Asia, and the Rest of the World (ROW) |
|
Performing market contribution |
North America at 40% |
|
Key countries |
US, Canada, Germany, UK, and China |
|
Competitive landscape |
Leading Vendors, Market Positioning of Vendors, Competitive Strategies, and Industry Risks |
|
Key companies profiled |
Abcam plc, Active Motif Inc., Agilent Technologies Inc., Bio Rad Laboratories Inc., Bio-Techne Corp., BioVision Inc., CellCentric Ltd., Enzo Biochem Inc., EpiGentek Group Inc., F. Hoffmann La Roche Ltd., Hologic Inc., Illumina Inc., Merck KGaA, New England Biolabs Inc., Pacific Biosciences of California Inc., Perkin Elmer Inc., Promega Corp., QIAGEN NV, Thermo Fisher Scientific Inc., and Zymo Research Corp. |
|
Market dynamics |
Parent market analysis, Market growth inducers and obstacles, Fast-growing and slow-growing segment analysis, COVID-19 impact and recovery analysis and future consumer dynamics, Market condition analysis for the forecast period |
|
Customization purview |
If our report has not included the data that you are looking for, you can reach out to our analysts and get segments customized. |
Table of Contents
1 Executive Summary
- 1.1 Market overview
- Exhibit 01: Executive Summary – Chart on Market Overview
- Exhibit 02: Executive Summary – Data Table on Market Overview
- Exhibit 03: Executive Summary – Chart on Global Market Characteristics
- Exhibit 04: Executive Summary – Chart on Market by Geography
- Exhibit 05: Executive Summary – Chart on Market Segmentation by Application
- Exhibit 06: Executive Summary – Chart on Market Segmentation by Product
- Exhibit 07: Executive Summary – Chart on Incremental Growth
- Exhibit 08: Executive Summary – Data Table on Incremental Growth
- Exhibit 09: Executive Summary – Chart on Vendor Market Positioning
2 Market Landscape
- 2.1 Market ecosystem
- Exhibit 10: Parent market
- Exhibit 11: Market Characteristics
3 Market Sizing
- 3.1 Market definition
- Exhibit 12: Offerings of vendors included in the market definition
- 3.2 Market segment analysis
- Exhibit 13: Market segments
- 3.4 Market outlook: Forecast for 2022-2027
- Exhibit 14: Chart on Global – Market size and forecast 2022-2027 ($ million)
- Exhibit 15: Data Table on Global – Market size and forecast 2022-2027 ($ million)
- Exhibit 16: Chart on Global Market: Year-over-year growth 2022-2027 (%)
- Exhibit 17: Data Table on Global Market: Year-over-year growth 2022-2027 (%)
4 Historic Market Size
- 4.1 Global epigenetics market 2017 – 2021
- Exhibit 18: Historic Market Size – Data Table on Global epigenetics market 2017 – 2021 ($ million)
- 4.2 Application Segment Analysis 2017 – 2021
- Exhibit 19: Historic Market Size – Application Segment 2017 – 2021 ($ million)
- 4.3 Product Segment Analysis 2017 – 2021
- Exhibit 20: Historic Market Size – Product Segment 2017 – 2021 ($ million)
- 4.4 Geography Segment Analysis 2017 – 2021
- Exhibit 21: Historic Market Size – Geography Segment 2017 – 2021 ($ million)
- 4.5 Country Segment Analysis 2017 – 2021
- Exhibit 22: Historic Market Size – Country Segment 2017 – 2021 ($ million)
5 Five Forces Analysis
- 5.1 Five forces summary
- Exhibit 23: Five forces analysis – Comparison between 2022 and 2027
- 5.2 Bargaining power of buyers
- Exhibit 24: Chart on Bargaining power of buyers – Impact of key factors 2022 and 2027
- 5.3 Bargaining power of suppliers
- Exhibit 25: Bargaining power of suppliers – Impact of key factors in 2022 and 2027
- 5.4 Threat of new entrants
- Exhibit 26: Threat of new entrants – Impact of key factors in 2022 and 2027
- 5.5 Threat of substitutes
- Exhibit 27: Threat of substitutes – Impact of key factors in 2022 and 2027
- 5.6 Threat of rivalry
- Exhibit 28: Threat of rivalry – Impact of key factors in 2022 and 2027
- 5.7 Market condition
- Exhibit 29: Chart on Market condition – Five forces 2022 and 2027
6 Market Segmentation by Application
- 6.1 Market segments
- Exhibit 30: Chart on Application – Market share 2022-2027 (%)
- Exhibit 31: Data Table on Application – Market share 2022-2027 (%)
- 6.2 Comparison by Application
- Exhibit 32: Chart on Comparison by Application
- Exhibit 33: Data Table on Comparison by Application
- 6.3 Oncology – Market size and forecast 2022-2027
- Exhibit 34: Chart on Oncology – Market size and forecast 2022-2027 ($ million)
- Exhibit 35: Data Table on Oncology – Market size and forecast 2022-2027 ($ million)
- Exhibit 36: Chart on Oncology – Year-over-year growth 2022-2027 (%)
- Exhibit 37: Data Table on Oncology – Year-over-year growth 2022-2027 (%)
- 6.4 Non-oncology – Market size and forecast 2022-2027
- Exhibit 38: Chart on Non-oncology – Market size and forecast 2022-2027 ($ million)
- Exhibit 39: Data Table on Non-oncology – Market size and forecast 2022-2027 ($ million)
- Exhibit 40: Chart on Non-oncology – Year-over-year growth 2022-2027 (%)
- Exhibit 41: Data Table on Non-oncology – Year-over-year growth 2022-2027 (%)
- 6.5 Market opportunity by Application
- Exhibit 42: Market opportunity by Application ($ million)
- Exhibit 43: Data Table on Market opportunity by Application ($ million)
7 Market Segmentation by Product
- 7.1 Market segments
- Exhibit 44: Chart on Product – Market share 2022-2027 (%)
- Exhibit 45: Data Table on Product – Market share 2022-2027 (%)
- 7.2 Comparison by Product
- Exhibit 46: Chart on Comparison by Product
- Exhibit 47: Data Table on Comparison by Product
- 7.3 Reagents – Market size and forecast 2022-2027
- Exhibit 48: Chart on Reagents – Market size and forecast 2022-2027 ($ million)
- Exhibit 49: Data Table on Reagents – Market size and forecast 2022-2027 ($ million)
- Exhibit 50: Chart on Reagents – Year-over-year growth 2022-2027 (%)
- Exhibit 51: Data Table on Reagents – Year-over-year growth 2022-2027 (%)
- 7.4 Kits – Market size and forecast 2022-2027
- Exhibit 52: Chart on Kits – Market size and forecast 2022-2027 ($ million)
- Exhibit 53: Data Table on Kits – Market size and forecast 2022-2027 ($ million)
- Exhibit 54: Chart on Kits – Year-over-year growth 2022-2027 (%)
- Exhibit 55: Data Table on Kits – Year-over-year growth 2022-2027 (%)
- 7.5 Others – Market size and forecast 2022-2027
- Exhibit 56: Chart on Others – Market size and forecast 2022-2027 ($ million)
- Exhibit 57: Data Table on Others – Market size and forecast 2022-2027 ($ million)
- Exhibit 58: Chart on Others – Year-over-year growth 2022-2027 (%)
- Exhibit 59: Data Table on Others – Year-over-year growth 2022-2027 (%)
- 7.6 Market opportunity by Product
- Exhibit 60: Market opportunity by Product ($ million)
- Exhibit 61: Data Table on Market opportunity by Product ($ million)
8 Customer Landscape
- 8.1 Customer landscape overview
- Exhibit 62: Analysis of price sensitivity, lifecycle, customer purchase basket, adoption rates, and purchase criteria
9 Geographic Landscape
- 9.1 Geographic segmentation
- Exhibit 63: Chart on Market share by geography 2022-2027 (%)
- Exhibit 64: Data Table on Market share by geography 2022-2027 (%)
- 9.2 Geographic comparison
- Exhibit 65: Chart on Geographic comparison
- Exhibit 66: Data Table on Geographic comparison
- 9.3 North America – Market size and forecast 2022-2027
- Exhibit 67: Chart on North America – Market size and forecast 2022-2027 ($ million)
- Exhibit 68: Data Table on North America – Market size and forecast 2022-2027 ($ million)
- Exhibit 69: Chart on North America – Year-over-year growth 2022-2027 (%)
- Exhibit 70: Data Table on North America – Year-over-year growth 2022-2027 (%)
- 9.4 Europe – Market size and forecast 2022-2027
- Exhibit 71: Chart on Europe – Market size and forecast 2022-2027 ($ million)
- Exhibit 72: Data Table on Europe – Market size and forecast 2022-2027 ($ million)
- Exhibit 73: Chart on Europe – Year-over-year growth 2022-2027 (%)
- Exhibit 74: Data Table on Europe – Year-over-year growth 2022-2027 (%)
- 9.5 Asia – Market size and forecast 2022-2027
- Exhibit 75: Chart on Asia – Market size and forecast 2022-2027 ($ million)
- Exhibit 76: Data Table on Asia – Market size and forecast 2022-2027 ($ million)
- Exhibit 77: Chart on Asia – Year-over-year growth 2022-2027 (%)
- Exhibit 78: Data Table on Asia – Year-over-year growth 2022-2027 (%)
- 9.6 Rest of World (ROW) – Market size and forecast 2022-2027
- Exhibit 79: Chart on Rest of World (ROW) – Market size and forecast 2022-2027 ($ million)
- Exhibit 80: Data Table on Rest of World (ROW) – Market size and forecast 2022-2027 ($ million)
- Exhibit 81: Chart on Rest of World (ROW) – Year-over-year growth 2022-2027 (%)
- Exhibit 82: Data Table on Rest of World (ROW) – Year-over-year growth 2022-2027 (%)
- 9.7 US – Market size and forecast 2022-2027
- Exhibit 83: Chart on US – Market size and forecast 2022-2027 ($ million)
- Exhibit 84: Data Table on US – Market size and forecast 2022-2027 ($ million)
- Exhibit 85: Chart on US – Year-over-year growth 2022-2027 (%)
- Exhibit 86: Data Table on US – Year-over-year growth 2022-2027 (%)
- 9.8 Germany – Market size and forecast 2022-2027
- Exhibit 87: Chart on Germany – Market size and forecast 2022-2027 ($ million)
- Exhibit 88: Data Table on Germany – Market size and forecast 2022-2027 ($ million)
- Exhibit 89: Chart on Germany – Year-over-year growth 2022-2027 (%)
- Exhibit 90: Data Table on Germany – Year-over-year growth 2022-2027 (%)
- 9.9 UK – Market size and forecast 2022-2027
- Exhibit 91: Chart on UK – Market size and forecast 2022-2027 ($ million)
- Exhibit 92: Data Table on UK – Market size and forecast 2022-2027 ($ million)
- Exhibit 93: Chart on UK – Year-over-year growth 2022-2027 (%)
- Exhibit 94: Data Table on UK – Year-over-year growth 2022-2027 (%)
- 9.10 Canada – Market size and forecast 2022-2027
- Exhibit 95: Chart on Canada – Market size and forecast 2022-2027 ($ million)
- Exhibit 96: Data Table on Canada – Market size and forecast 2022-2027 ($ million)
- Exhibit 97: Chart on Canada – Year-over-year growth 2022-2027 (%)
- Exhibit 98: Data Table on Canada – Year-over-year growth 2022-2027 (%)
- 9.11 China – Market size and forecast 2022-2027
- Exhibit 99: Chart on China – Market size and forecast 2022-2027 ($ million)
- Exhibit 100: Data Table on China – Market size and forecast 2022-2027 ($ million)
- Exhibit 101: Chart on China – Year-over-year growth 2022-2027 (%)
- Exhibit 102: Data Table on China – Year-over-year growth 2022-2027 (%)
- 9.12 Market opportunity by geography
- Exhibit 103: Market opportunity by geography ($ million)
- Exhibit 104: Data Tables on Market opportunity by geography ($ million)
10 Drivers, Challenges, and Trends
- 10.3 Impact of drivers and challenges
- Exhibit 105: Impact of drivers and challenges in 2022 and 2027
11 Vendor Landscape
- 11.2 Vendor landscape
- Exhibit 106: Overview on Criticality of inputs and Factors of differentiation
- 11.3 Landscape disruption
- Exhibit 107: Overview on factors of disruption
- 11.4 Industry risks
- Exhibit 108: Impact of key risks on business
12 Vendor Analysis
- 12.1 Vendors covered
- Exhibit 109: Vendors covered
- 12.2 Market positioning of vendors
- Exhibit 110: Matrix on vendor position and classification
- 12.3 Abcam plc
- Exhibit 111: Abcam plc – Overview
- Exhibit 112: Abcam plc – Product / Service
- Exhibit 113: Abcam plc – Key news
- Exhibit 114: Abcam plc – Key offerings
- 12.4 Active Motif Inc.
- Exhibit 115: Active Motif Inc. – Overview
- Exhibit 116: Active Motif Inc. – Product / Service
- Exhibit 117: Active Motif Inc. – Key offerings
- 12.5 Agilent Technologies Inc.
- Exhibit 118: Agilent Technologies Inc. – Overview
- Exhibit 119: Agilent Technologies Inc. – Business segments
- Exhibit 120: Agilent Technologies Inc. – Key news
- Exhibit 121: Agilent Technologies Inc. – Key offerings
- Exhibit 122: Agilent Technologies Inc. – Segment focus
- 12.6 Bio Rad Laboratories Inc.
- Exhibit 123: Bio Rad Laboratories Inc. – Overview
- Exhibit 124: Bio Rad Laboratories Inc. – Business segments
- Exhibit 125: Bio Rad Laboratories Inc. – Key news
- Exhibit 126: Bio Rad Laboratories Inc. – Key offerings
- Exhibit 127: Bio Rad Laboratories Inc. – Segment focus
- 12.7 BioVision Inc.
- Exhibit 128: BioVision Inc. – Overview
- Exhibit 129: BioVision Inc. – Product / Service
- Exhibit 130: BioVision Inc. – Key offerings
- 12.8 EpiGentek Group Inc.
- Exhibit 131: EpiGentek Group Inc. – Overview
- Exhibit 132: EpiGentek Group Inc. – Product / Service
- Exhibit 133: EpiGentek Group Inc. – Key offerings
- 12.9 F. Hoffmann La Roche Ltd.
- Exhibit 134: F. Hoffmann La Roche Ltd. – Overview
- Exhibit 135: F. Hoffmann La Roche Ltd. – Business segments
- Exhibit 136: F. Hoffmann La Roche Ltd. – Key news
- Exhibit 137: F. Hoffmann La Roche Ltd. – Key offerings
- Exhibit 138: F. Hoffmann La Roche Ltd. – Segment focus
- 12.10 Hologic Inc.
- Exhibit 139: Hologic Inc. – Overview
- Exhibit 140: Hologic Inc. – Business segments
- Exhibit 141: Hologic Inc. – Key news
- Exhibit 142: Hologic Inc. – Key offerings
- Exhibit 143: Hologic Inc. – Segment focus
- 12.11 Illumina Inc.
- Exhibit 144: Illumina Inc. – Overview
- Exhibit 145: Illumina Inc. – Business segments
- Exhibit 146: Illumina Inc. – Key news
- Exhibit 147: Illumina Inc. – Key offerings
- Exhibit 148: Illumina Inc. – Segment focus
- 12.12 Merck KGaA
- Exhibit 149: Merck KGaA – Overview
- Exhibit 150: Merck KGaA – Business segments
- Exhibit 151: Merck KGaA – Key news
- Exhibit 152: Merck KGaA – Key offerings
- Exhibit 153: Merck KGaA – Segment focus
- 12.13 New England Biolabs Inc.
- Exhibit 154: New England Biolabs Inc. – Overview
- Exhibit 155: New England Biolabs Inc. – Product / Service
- Exhibit 156: New England Biolabs Inc. – Key news
- Exhibit 157: New England Biolabs Inc. – Key offerings
- 12.14 Perkin Elmer Inc.
- Exhibit 158: Perkin Elmer Inc. – Overview
- Exhibit 159: Perkin Elmer Inc. – Business segments
- Exhibit 160: Perkin Elmer Inc. – Key news
- Exhibit 161: Perkin Elmer Inc. – Key offerings
- Exhibit 162: Perkin Elmer Inc. – Segment focus
- 12.15 QIAGEN NV
- Exhibit 163: QIAGEN NV – Overview
- Exhibit 164: QIAGEN NV – Product / Service
- Exhibit 165: QIAGEN NV – Key news
- Exhibit 166: QIAGEN NV – Key offerings
- 12.16 Thermo Fisher Scientific Inc.
- Exhibit 167: Thermo Fisher Scientific Inc. – Overview
- Exhibit 168: Thermo Fisher Scientific Inc. – Business segments
- Exhibit 169: Thermo Fisher Scientific Inc. – Key news
- Exhibit 170: Thermo Fisher Scientific Inc. – Key offerings
- Exhibit 171: Thermo Fisher Scientific Inc. – Segment focus
- 12.17 Zymo Research Corp.
- Exhibit 172: Zymo Research Corp. – Overview
- Exhibit 173: Zymo Research Corp. – Product / Service
- Exhibit 174: Zymo Research Corp. – Key offerings
13 Appendix
- 13.1 Scope of the report
- 13.2 Inclusions and exclusions checklist
- Exhibit 175: Inclusions checklist
- Exhibit 176: Exclusions checklist
- 13.3 Currency conversion rates for US$
- Exhibit 177: Currency conversion rates for US$
- 13.4 Research methodology
- Exhibit 178: Research methodology
- Exhibit 179: Validation techniques employed for market sizing
- Exhibit 180: Information sources
- 13.5 List of abbreviations
- Exhibit 181: List of abbreviations
About Technavio
Technavio is a leading global technology research and advisory company. Their research and analysis focuses on emerging market trends and provide actionable insights to help businesses identify market opportunities and develop effective strategies to optimize their market positions. With over 500 specialized analysts, Technavio’s report library consists of more than 17,000 reports and counting, covering 800 technologies, spanning 50 countries. Their client base consists of enterprises of all sizes, including more than 100 Fortune 500 companies. This growing client base relies on Technavio’s comprehensive coverage, extensive research, and actionable market insights to identify opportunities in existing and potential markets and assess their competitive positions within changing market scenarios.
Contacts
Technavio Research
Jesse Maida
Media & Marketing Executive
US: +1 844 364 1100
UK: +44 203 893 3200
Email: [email protected]
Website: www.technavio.com
SOURCE Technavio
