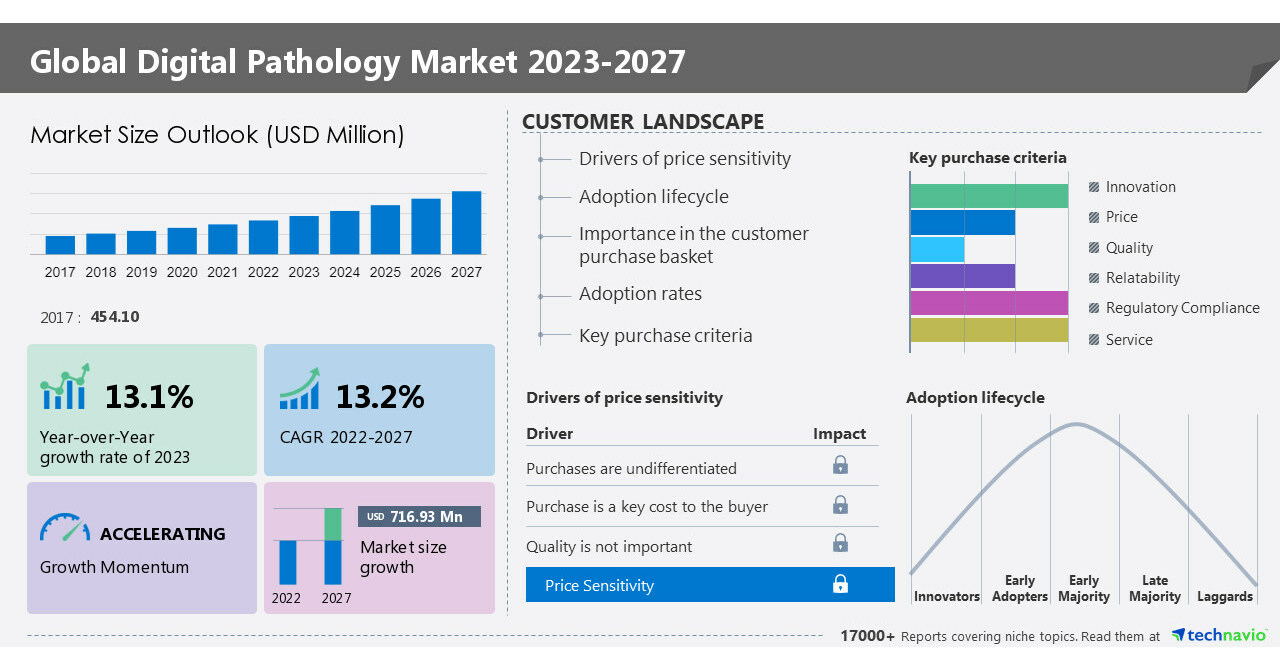
NEW YORK, June 12, 2023 /PRNewswire/ — The digital pathology market size is expected to grow by USD 716.93 million from 2022-2027, progressing at a CAGR of 13.2% as per the latest Technavio market research report. North America is estimated to account for 39% of the market’s overall growth. Growing US FDA approval of whole slide imaging systems used in digital pathology workflows and increasing adoption of advanced pathology practices drive the growth of the market in North America. Furthermore, the vendors are witnessing favorable market conditions due to the increasing approval of digital pathology systems in the region. Such factors have surged the growth opportunities in the US market and have substantially promoted market vendors to develop advanced digital pathology products. This has promoted the swift growth of the digital pathology market in the region. For more insights on the market share of various regions- Download sample report in MINUTES
What’s New?
- Special coverage on the Russia–Ukraine war; global inflation; recovery analysis from COVID-19; supply chain disruptions, global trade tensions; and risk of recession
- Global competitiveness and key competitor positions
- Market presence across multiple geographical footprints – Strong/Active/Niche/Trivial – Buy the Report!
Digital Pathology Market – Driver
Growing adoption of IoT infrastructure among laboratories to drive growth. A paradigm shift toward the development of advanced infrastructure to offer efficient healthcare services has increased the use of advanced equipment and software. Moreover, the increasing interest of governments of emerging economies in promoting mobile health (mHealth) services as a complementary strategy to achieve the health-related Millennium Development Goal has boosted the demand for teleconsultation services. Thus, the growing development of IoT infrastructure facilitates easy integration of digital pathology systems in laboratories and helps offer efficient healthcare services. This will substantially boost the growth of the market.
Digital Pathology Market: Trend
Integration of AI into digital pathology systems is the key trend impacting the global digital pathology market growth. The advent of IoT in pathology laboratory services as a part of digitalization in healthcare has enabled the use of smarter and interoperable laboratory technologies through connected systems. Digital pathology data is largely contributing to the development of big healthcare data. In addition, the reduced cost of cloud-based storage services has eased concerns regarding the storage of data collected through connected systems. The cost of storing laboratory data is expected to reduce by about 98.98% during 2015-2030. This is expected to reduce the additional cost involved in the storage of digital pathology data to some extent, making it more accessible to end-users. Such factors will increase the market growth during the forecast period.
To know about more drivers, trends along with challenges – Download a sample now!
Some of the key Digital Pathology Market Players:
The digital pathology market is fragmented and the vendors are deploying organic and inorganic growth strategies to compete in the market. Some major vendors are 3DHISTECH Ltd., Apollo Enterprise Imaging Corp., Co Diagnostics Inc., Corista, Danaher Corp., F. Hoffmann La Roche Ltd., General Electric Co., Hamamatsu Photonics KK, Huron Digital Pathology, Indica Labs Inc., Inspirata Inc., Kanteron Systems SLU, Koninklijke Philips NV, Mikroscan Technologies Inc., Objective Pathology Services, Olympus Corp., Proscia Inc., Sectra AB, Visiopharm AS, and XIFIN Inc., and among others.
Digital Pathology Market: Segmentation Analysis
This market research report segments the digital pathology market by product (digital slide scanner and software), application (hospitals and laboratories, independent and small clinics, and research centers), and geography (North America, Europe, Asia, and Rest of World (ROW)).
The market share growth by the digital slide scanner segment will be significant for overall market growth during the forecast period. Growing technological advancement in the magnification and scanning of slides is expected to propel further growth of the segment. Moreover, the rising internet bandwidth connectivity and technological developments by vendors in the market are propelling the market growth. Such developments are expected to propel the growth of the segment, which, in turn, is expected to propel the growth of the market in focus during the forecast period.
Gain instant access to 17,000+ market research reports
Technavio’s SUBSCRIPTION platform
Related Reports:
- The digital banking platforms market share is expected to increase by USD 21.07 billion from 2021 to 2026, and the market’s growth momentum will accelerate at a CAGR of 14.52%. Furthermore, this report extensively covers the digital banking platform’s market segmentation by type (retail banking and corporate banking) and geography (North America, Europe, APAC, South America, and the Middle East and Africa). The growing use of digital payment solutions is a key factor driving the global digital banking platforms market growth.
- The digital video recorder market share is expected to increase to USD 6.76 billion from 2021 to 2026, and the market’s growth momentum will accelerate at a CAGR of 7.31%. Furthermore, this report extensively covers digital video recorder market segmentation by deployment (in-home DVR and cloud DVR) and geography (North America, APAC, Europe, South America, and Middle East and Africa). One of the key factors driving the global digital video recorder industry growth is the increasing penetration of mobile computing devices.
|
Digital Pathology Market Scope |
|
|
Report Coverage |
Details |
|
Base year |
2022 |
|
Historic period |
2017-2021 |
|
Forecast period |
2023-2027 |
|
Growth momentum & CAGR |
Accelerate at a CAGR of 13.2% |
|
Market growth 2023-2027 |
USD 716.93 million |
|
Market structure |
Fragmented |
|
YoY growth 2022-2023 (%) |
13.1 |
|
Regional analysis |
North America, Europe, Asia, and Rest of World (ROW) |
|
Performing market contribution |
North America at 39% |
|
Key countries |
US, Canada, UK, Germany, and France |
|
Competitive landscape |
Leading Vendors, Market Positioning of Vendors, Competitive Strategies, and Industry Risks |
|
Key companies profiled |
3DHISTECH Ltd., Apollo Enterprise Imaging Corp., Co Diagnostics Inc., Corista, Danaher Corp., F. Hoffmann La Roche Ltd., General Electric Co., Hamamatsu Photonics KK, Huron Digital Pathology, Indica Labs Inc., Inspirata Inc., Kanteron Systems SLU, Koninklijke Philips NV, Mikroscan Technologies Inc., Objective Pathology Services, Olympus Corp., Proscia Inc., Sectra AB, Visiopharm AS, and XIFIN Inc. |
|
Market dynamics |
Parent market analysis, Market growth inducers and obstacles, Fast-growing and slow-growing segment analysis, COVID-19 impact and recovery analysis and future consumer dynamics, Market condition analysis for the forecast period. |
|
Customization purview |
If our report has not included the data that you are looking for, you can reach out to our analysts and get segments customized. |
Table of Content
1 Executive Summary
- 1.1 Market overview
- Exhibit 01: Executive Summary – Chart on Market Overview
- Exhibit 02: Executive Summary – Data Table on Market Overview
- Exhibit 03: Executive Summary – Chart on Global Market Characteristics
- Exhibit 04: Executive Summary – Chart on Market by Geography
- Exhibit 05: Executive Summary – Chart on Market Segmentation by Product
- Exhibit 06: Executive Summary – Chart on Market Segmentation by Application
- Exhibit 07: Executive Summary – Chart on Incremental Growth
- Exhibit 08: Executive Summary – Data Table on Incremental Growth
- Exhibit 09: Executive Summary – Chart on Vendor Market Positioning
2 Market Landscape
- 2.1 Market ecosystem
- Exhibit 10: Parent market
- Exhibit 11: Market Characteristics
3 Market Sizing
- 3.1 Market definition
- Exhibit 12: Offerings of vendors included in the market definition
- 3.2 Market segment analysis
- Exhibit 13: Market segments
- 3.4 Market outlook: Forecast for 2022-2027
- Exhibit 14: Chart on Global – Market size and forecast 2022-2027 ($ million)
- Exhibit 15: Data Table on Global – Market size and forecast 2022-2027 ($ million)
- Exhibit 16: Chart on Global Market: Year-over-year growth 2022-2027 (%)
- Exhibit 17: Data Table on Global Market: Year-over-year growth 2022-2027 (%)
4 Historic Market Size
- 4.1 Global digital pathology market 2017 – 2021
- Exhibit 18: Historic Market Size – Data Table on Global digital pathology market 2017 – 2021 ($ million)
- 4.2 Product Segment Analysis 2017 – 2021
- Exhibit 19: Historic Market Size – Product Segment 2017 – 2021 ($ million)
- 4.3 Application Segment Analysis 2017 – 2021
- Exhibit 20: Historic Market Size – Application Segment 2017 – 2021 ($ million)
- 4.4 Geography Segment Analysis 2017 – 2021
- Exhibit 21: Historic Market Size – Geography Segment 2017 – 2021 ($ million)
- 4.5 Country Segment Analysis 2017 – 2021
- Exhibit 22: Historic Market Size – Country Segment 2017 – 2021 ($ million)
5 Five Forces Analysis
- 5.1 Five forces summary
- Exhibit 23: Five forces analysis – Comparison between 2022 and 2027
- 5.2 Bargaining power of buyers
- Exhibit 24: Chart on Bargaining power of buyers – Impact of key factors 2022 and 2027
- 5.3 Bargaining power of suppliers
- Exhibit 25: Bargaining power of suppliers – Impact of key factors in 2022 and 2027
- 5.4 Threat of new entrants
- Exhibit 26: Threat of new entrants – Impact of key factors in 2022 and 2027
- 5.5 Threat of substitutes
- Exhibit 27: Threat of substitutes – Impact of key factors in 2022 and 2027
- 5.6 Threat of rivalry
- Exhibit 28: Threat of rivalry – Impact of key factors in 2022 and 2027
- 5.7 Market condition
- Exhibit 29: Chart on Market condition – Five forces 2022 and 2027
6 Market Segmentation by Product
- 6.1 Market segments
- Exhibit 30: Chart on Product – Market share 2022-2027 (%)
- Exhibit 31: Data Table on Product – Market share 2022-2027 (%)
- 6.2 Comparison by Product
- Exhibit 32: Chart on Comparison by Product
- Exhibit 33: Data Table on Comparison by Product
- 6.3 Digital slide scanner – Market size and forecast 2022-2027
- Exhibit 34: Chart on Digital slide scanner – Market size and forecast 2022-2027 ($ million)
- Exhibit 35: Data Table on Digital slide scanner – Market size and forecast 2022-2027 ($ million)
- Exhibit 36: Chart on Digital slide scanner – Year-over-year growth 2022-2027 (%)
- Exhibit 37: Data Table on Digital slide scanner – Year-over-year growth 2022-2027 (%)
- 6.4 Software – Market size and forecast 2022-2027
- Exhibit 38: Chart on Software – Market size and forecast 2022-2027 ($ million)
- Exhibit 39: Data Table on Software – Market size and forecast 2022-2027 ($ million)
- Exhibit 40: Chart on Software – Year-over-year growth 2022-2027 (%)
- Exhibit 41: Data Table on Software – Year-over-year growth 2022-2027 (%)
- 6.5 Market opportunity by Product
- Exhibit 42: Market opportunity by Product ($ million)
7 Market Segmentation by Application
- 7.1 Market segments
- Exhibit 43: Chart on Application – Market share 2022-2027 (%)
- Exhibit 44: Data Table on Application – Market share 2022-2027 (%)
- 7.2 Comparison by Application
- Exhibit 45: Chart on Comparison by Application
- Exhibit 46: Data Table on Comparison by Application
- 7.3 Hospitals and laboratories – Market size and forecast 2022-2027
- Exhibit 47: Chart on Hospitals and laboratories – Market size and forecast 2022-2027 ($ million)
- Exhibit 48: Data Table on Hospitals and laboratories – Market size and forecast 2022-2027 ($ million)
- Exhibit 49: Chart on Hospitals and laboratories – Year-over-year growth 2022-2027 (%)
- Exhibit 50: Data Table on Hospitals and laboratories – Year-over-year growth 2022-2027 (%)
- 7.4 Independent and small clinics – Market size and forecast 2022-2027
- Exhibit 51: Chart on Independent and small clinics – Market size and forecast 2022-2027 ($ million)
- Exhibit 52: Data Table on Independent and small clinics – Market size and forecast 2022-2027 ($ million)
- Exhibit 53: Chart on Independent and small clinics – Year-over-year growth 2022-2027 (%)
- Exhibit 54: Data Table on Independent and small clinics – Year-over-year growth 2022-2027 (%)
- 7.5 Research centers – Market size and forecast 2022-2027
- Exhibit 55: Chart on Research centers – Market size and forecast 2022-2027 ($ million)
- Exhibit 56: Data Table on Research centers – Market size and forecast 2022-2027 ($ million)
- Exhibit 57: Chart on Research centers – Year-over-year growth 2022-2027 (%)
- Exhibit 58: Data Table on Research centers – Year-over-year growth 2022-2027 (%)
- 7.6 Market opportunity by Application
- Exhibit 59: Market opportunity by Application ($ million)
8 Customer Landscape
- 8.1 Customer landscape overview
- Exhibit 60: Analysis of price sensitivity, lifecycle, customer purchase basket, adoption rates, and purchase criteria
9 Geographic Landscape
- 9.1 Geographic segmentation
- Exhibit 61: Chart on Market share by geography 2022-2027 (%)
- Exhibit 62: Data Table on Market share by geography 2022-2027 (%)
- 9.2 Geographic comparison
- Exhibit 63: Chart on Geographic comparison
- Exhibit 64: Data Table on Geographic comparison
- 9.3 North America – Market size and forecast 2022-2027
- Exhibit 65: Chart on North America – Market size and forecast 2022-2027 ($ million)
- Exhibit 66: Data Table on North America – Market size and forecast 2022-2027 ($ million)
- Exhibit 67: Chart on North America – Year-over-year growth 2022-2027 (%)
- Exhibit 68: Data Table on North America – Year-over-year growth 2022-2027 (%)
- 9.4 Europe – Market size and forecast 2022-2027
- Exhibit 69: Chart on Europe – Market size and forecast 2022-2027 ($ million)
- Exhibit 70: Data Table on Europe – Market size and forecast 2022-2027 ($ million)
- Exhibit 71: Chart on Europe – Year-over-year growth 2022-2027 (%)
- Exhibit 72: Data Table on Europe – Year-over-year growth 2022-2027 (%)
- 9.5 Asia – Market size and forecast 2022-2027
- Exhibit 73: Chart on Asia – Market size and forecast 2022-2027 ($ million)
- Exhibit 74: Data Table on Asia – Market size and forecast 2022-2027 ($ million)
- Exhibit 75: Chart on Asia – Year-over-year growth 2022-2027 (%)
- Exhibit 76: Data Table on Asia – Year-over-year growth 2022-2027 (%)
- 9.6 Rest of World (ROW) – Market size and forecast 2022-2027
- Exhibit 77: Chart on Rest of World (ROW) – Market size and forecast 2022-2027 ($ million)
- Exhibit 78: Data Table on Rest of World (ROW) – Market size and forecast 2022-2027 ($ million)
- Exhibit 79: Chart on Rest of World (ROW) – Year-over-year growth 2022-2027 (%)
- Exhibit 80: Data Table on Rest of World (ROW) – Year-over-year growth 2022-2027 (%)
- 9.7 US – Market size and forecast 2022-2027
- Exhibit 81: Chart on US – Market size and forecast 2022-2027 ($ million)
- Exhibit 82: Data Table on US – Market size and forecast 2022-2027 ($ million)
- Exhibit 83: Chart on US – Year-over-year growth 2022-2027 (%)
- Exhibit 84: Data Table on US – Year-over-year growth 2022-2027 (%)
- 9.8 UK – Market size and forecast 2022-2027
- Exhibit 85: Chart on UK – Market size and forecast 2022-2027 ($ million)
- Exhibit 86: Data Table on UK – Market size and forecast 2022-2027 ($ million)
- Exhibit 87: Chart on UK – Year-over-year growth 2022-2027 (%)
- Exhibit 88: Data Table on UK – Year-over-year growth 2022-2027 (%)
- 9.9 Germany – Market size and forecast 2022-2027
- Exhibit 89: Chart on Germany – Market size and forecast 2022-2027 ($ million)
- Exhibit 90: Data Table on Germany – Market size and forecast 2022-2027 ($ million)
- Exhibit 91: Chart on Germany – Year-over-year growth 2022-2027 (%)
- Exhibit 92: Data Table on Germany – Year-over-year growth 2022-2027 (%)
- 9.10 France – Market size and forecast 2022-2027
- Exhibit 93: Chart on France – Market size and forecast 2022-2027 ($ million)
- Exhibit 94: Data Table on France – Market size and forecast 2022-2027 ($ million)
- Exhibit 95: Chart on France – Year-over-year growth 2022-2027 (%)
- Exhibit 96: Data Table on France – Year-over-year growth 2022-2027 (%)
- 9.11 Canada – Market size and forecast 2022-2027
- Exhibit 97: Chart on Canada – Market size and forecast 2022-2027 ($ million)
- Exhibit 98: Data Table on Canada – Market size and forecast 2022-2027 ($ million)
- Exhibit 99: Chart on Canada – Year-over-year growth 2022-2027 (%)
- Exhibit 100: Data Table on Canada – Year-over-year growth 2022-2027 (%)
- 9.12 Market opportunity by geography
- Exhibit 101: Market opportunity by geography ($ million)
10 Drivers, Challenges, and Trends
- 10.3 Impact of drivers and challenges
- Exhibit 102: Impact of drivers and challenges in 2022 and 2027
11 Vendor Landscape
- 11.2 Vendor landscape
- Exhibit 103: Overview on Criticality of inputs and Factors of differentiation
- 11.3 Landscape disruption
- Exhibit 104: Overview on factors of disruption
- 11.4 Industry risks
- Exhibit 105: Impact of key risks on business
12 Vendor Analysis
- 12.1 Vendors covered
- Exhibit 106: Vendors covered
- 12.2 Market positioning of vendors
- Exhibit 107: Matrix on vendor position and classification
- 12.3 3DHISTECH Ltd.
- Exhibit 108: 3DHISTECH Ltd. – Overview
- Exhibit 109: 3DHISTECH Ltd. – Product / Service
- Exhibit 110: 3DHISTECH Ltd. – Key offerings
- 12.4 Apollo Enterprise Imaging Corp.
- Exhibit 111: Apollo Enterprise Imaging Corp. – Overview
- Exhibit 112: Apollo Enterprise Imaging Corp. – Product / Service
- Exhibit 113: Apollo Enterprise Imaging Corp. – Key offerings
- 12.5 Co Diagnostics Inc.
- Exhibit 114: Co Diagnostics Inc. – Overview
- Exhibit 115: Co Diagnostics Inc. – Product / Service
- Exhibit 116: Co Diagnostics Inc. – Key news
- Exhibit 117: Co Diagnostics Inc. – Key offerings
- 12.6 Corista
- Exhibit 118: Corista – Overview
- Exhibit 119: Corista – Product / Service
- Exhibit 120: Corista – Key offerings
- 12.7 Danaher Corp.
- Exhibit 121: Danaher Corp. – Overview
- Exhibit 122: Danaher Corp. – Business segments
- Exhibit 123: Danaher Corp. – Key news
- Exhibit 124: Danaher Corp. – Key offerings
- Exhibit 125: Danaher Corp. – Segment focus
- 12.8 F. Hoffmann La Roche Ltd.
- Exhibit 126: F. Hoffmann La Roche Ltd. – Overview
- Exhibit 127: F. Hoffmann La Roche Ltd. – Business segments
- Exhibit 128: F. Hoffmann La Roche Ltd. – Key news
- Exhibit 129: F. Hoffmann La Roche Ltd. – Key offerings
- Exhibit 130: F. Hoffmann La Roche Ltd. – Segment focus
- 12.9 General Electric Co.
- Exhibit 131: General Electric Co. – Overview
- Exhibit 132: General Electric Co. – Business segments
- Exhibit 133: General Electric Co. – Key news
- Exhibit 134: General Electric Co. – Key offerings
- Exhibit 135: General Electric Co. – Segment focus
- 12.10 Hamamatsu Photonics KK
- Exhibit 136: Hamamatsu Photonics KK – Overview
- Exhibit 137: Hamamatsu Photonics KK – Business segments
- Exhibit 138: Hamamatsu Photonics KK – Key offerings
- Exhibit 139: Hamamatsu Photonics KK – Segment focus
- 12.11 Huron Digital Pathology
- Exhibit 140: Huron Digital Pathology – Overview
- Exhibit 141: Huron Digital Pathology – Product / Service
- Exhibit 142: Huron Digital Pathology – Key offerings
- 12.12 Inspirata Inc.
- Exhibit 143: Inspirata Inc. – Overview
- Exhibit 144: Inspirata Inc. – Product / Service
- Exhibit 145: Inspirata Inc. – Key offerings
- 12.13 Koninklijke Philips NV
- Exhibit 146: Koninklijke Philips NV – Overview
- Exhibit 147: Koninklijke Philips NV – Business segments
- Exhibit 148: Koninklijke Philips NV – Key news
- Exhibit 149: Koninklijke Philips NV – Key offerings
- Exhibit 150: Koninklijke Philips NV – Segment focus
- 12.14 Olympus Corp.
- Exhibit 151: Olympus Corp. – Overview
- Exhibit 152: Olympus Corp. – Business segments
- Exhibit 153: Olympus Corp. – Key news
- Exhibit 154: Olympus Corp. – Key offerings
- Exhibit 155: Olympus Corp. – Segment focus
- 12.15 Sectra AB
- Exhibit 156: Sectra AB – Overview
- Exhibit 157: Sectra AB – Business segments
- Exhibit 158: Sectra AB – Key offerings
- Exhibit 159: Sectra AB – Segment focus
- 12.16 Visiopharm AS
- Exhibit 160: Visiopharm AS – Overview
- Exhibit 161: Visiopharm AS – Product / Service
- Exhibit 162: Visiopharm AS – Key offerings
- 12.17 XIFIN Inc.
- Exhibit 163: XIFIN Inc. – Overview
- Exhibit 164: XIFIN Inc. – Product / Service
- Exhibit 165: XIFIN Inc. – Key offerings
13 Appendix
- 13.1 Scope of the report
- 13.2 Inclusions and exclusions checklist
- Exhibit 166: Inclusions checklist
- Exhibit 167: Exclusions checklist
- 13.3 Currency conversion rates for US$
- Exhibit 168: Currency conversion rates for US$
- 13.4 Research methodology
- Exhibit 169: Research methodology
- Exhibit 170: Validation techniques employed for market sizing
- Exhibit 171: Information sources
- 13.5 List of abbreviations
- Exhibit 172: List of abbreviations
About Technavio
Technavio is a leading global technology research and advisory company. Their research and analysis focuses on emerging market trends and provides actionable insights to help businesses identify market opportunities and develop effective strategies to optimize their market positions.
With over 500 specialized analysts, Technavio’s report library consists of more than 17,000 reports and counting, covering 800 technologies, spanning across 50 countries. Their client base consists of enterprises of all sizes, including more than 100 Fortune 500 companies. This growing client base relies on Technavio’s comprehensive coverage, extensive research, and actionable market insights to identify opportunities in existing and potential markets and assess their competitive positions within changing market scenarios.
Contacts
Technavio Research
Jesse Maida
Media & Marketing Executive
US: +1 844 364 1100
UK: +44 203 893 3200
Email: [email protected]
Website: www.technavio.com
SOURCE Technavio
