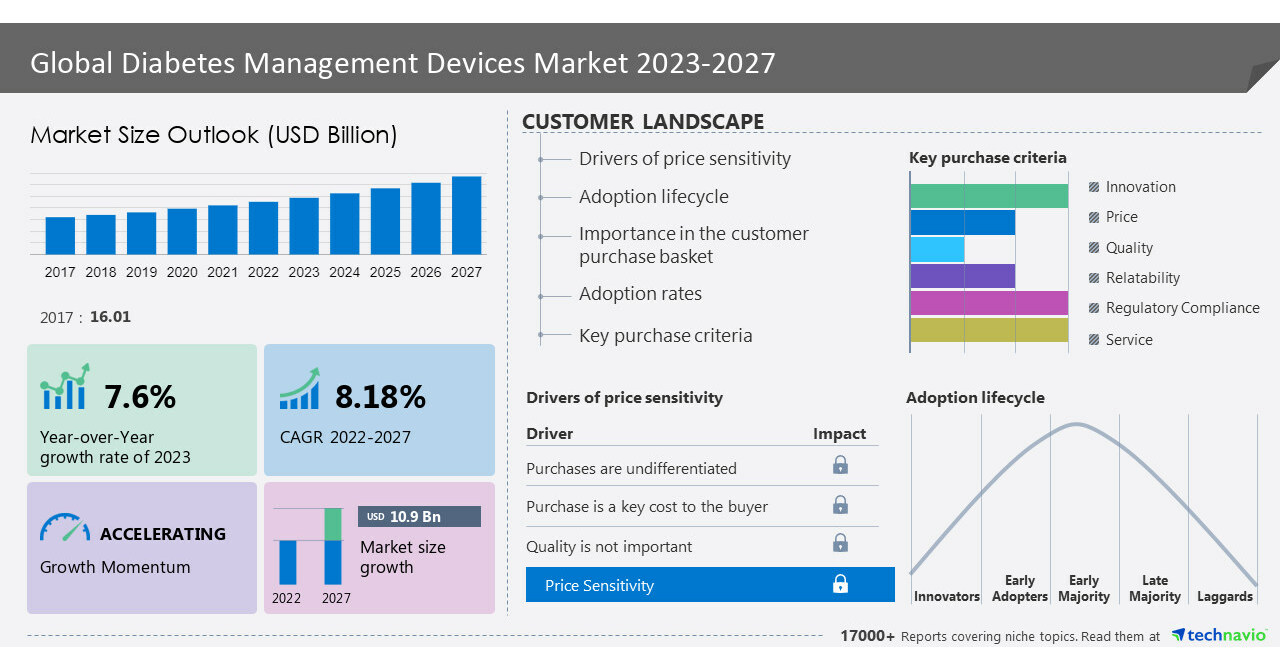
NEW YORK, May 19, 2023 /PRNewswire/ — The diabetes management devices market is set to grow by USD 10.9 billion from 2022 to 2027. The market is expected to be progressing at a CAGR of 8.18% during the forecast period. The report offers an up-to-date analysis regarding the current global market scenario, the latest trends and drivers, and the overall market environment. The market is driven by the rising global burden of diabetes. Diabetes is a chronic disease, in which either the body cannot use insulin effectively or the pancreas produces insufficient insulin. Hyperglycemia, or elevated blood sugar levels, if left untreated, can cause serious harm and complications that can be life-threatening to the patient. The global burden of this disease is rapidly increasing. – Here is an Exclusive report talking about Market scenarios with a historical period (2017-2021) and a forecast period (2023-2027). Download Sample Report in minutes!
The diabetes management devices market covers the following areas:
The report on the diabetes management devices market provides a holistic update, market size and forecast, trends, growth drivers, and challenges, as well as vendor analysis.
What’s New? –
- Special coverage on the Russia–Ukraine war; global inflation; recovery analysis from COVID-19; supply chain disruptions, global trade tensions; and risk of recession
- Global competitiveness and key competitor positions
- Market presence across multiple geographical footprints – Strong/Active/Niche/Trivial - Buy the report!
Diabetes Management Devices Market 2023-2027 – Market Dynamics
Significant Trends
- Growing focus on the artificial pancreas is a leading trend in the diabetes management devices market growth.
- The market pays increasing attention to the development and adoption of artificial pancreas systems.
- An artificial pancreas is a closed system, which uses a continuous glucose monitor (CGM) and an insulin pump to automatically regulate blood glucose levels in diabetics.
- Furthermore, the introduction of artificial pancreas systems has attracted attention due to their ability to improve glycemic control and reduce the risk of hypoglycemia in diabetics.
- Hence, such trends fuel the market growth during the forecast period.
Major Challenges
- A stringent regulatory framework is a challenge for the diabetes management devices market growth.
- Better regulation of medical devices is required to ensure that high-quality, efficient, and safe technology reaches people.
- The increasing number and modernization of medical devices pose new regulatory challenges.
- For instance, European and US regulatory networks are strict. Providers face several challenges in order to ensure patient safety and bring efficient devices to market.
- Market vendors who offer advanced diabetes management devices must comply with stringent regulatory scenarios before commercialization.
- Hence, such challenges impede market growth during the forecast period.
Diabetes Management Devices Market 2023-2027: Market Segmentation
- The market share growth by the blood glucose monitoring devices segment will be significant for overall market growth during the forecast period. A blood glucose monitoring device measures glucose (sugar) levels in a person’s blood and these devices are important for diabetics because they need to monitor blood sugar levels regularly to manage their health. Hence, such factors drive the segment growth during the forecast period.
This report presents a detailed picture of the market by way of study, synthesis, and
summation of data from multiple sources through an analysis of key parameters- View
Sample Report!
Companies Mentioned
- Abbott Laboratories
- B. Braun Melsungen AG
- Bionime Corp.
- Dexcom Inc.
- F. Hoffmann La Roche Ltd.
- iHealth Labs Inc.
- Insulet Corp.
- Medtronic Plc
- Nemaura Medical Inc.
- Nipro Corp.
- Nova Biomedical Corp.
- Novo Nordisk AS
- PHC Holdings Corp.
- Prodigy Diabetes Care LL
- Sanofi SA
- Senseonics Holdings Inc.
- WellDoc Inc.
- Tandem Diabetes Care Inc.
- LifeScan IP Holdings LLC
- Eli Lilly and Co.
Vendor Offerings
- Abbott Laboratories – The company offers diabetes management devices such as Freestyle Libre 3, Freestyle Libre 2, and Freestyle Lite.
- B. Braun Melsungen AG – The company offers diabetes management devices such as Space GlucoseControl System.
- Bionime Corp. – The company offers diabetes management devices such as GM550 glucose meters.
Gain instant access to 17,000+ market research reports.
Technavio’s SUBSCRIPTION platform
Related Reports:
The type 2 diabetes market size is estimated to grow at a CAGR of 10.94% and the size of the market is forecast to increase by USD 39.37 billion between 2022 and 2027. pharmacies, and online pharmacies), and geography (North America, Europe, Asia, and Rest of World (ROW). The rising prevalence of diabetes is notably driving the type 2 diabetes (T2D) market growth.
The digital diabetes management market size is expected to increase by USD 12.45 billion from 2021 to 2026, and the market’s growth momentum will accelerate at a CAGR of 21.15%. Furthermore, this report extensively covers digital diabetes management market segmentation by type (wearable devices and hand-held devices) and geography (North America, Europe, APAC, South America, and MEA). The rising global burden of diabetes is notably driving the digital diabetes management market growth.
|
Diabetes Management Devices Market Scope |
|
|
Report Coverage |
Details |
|
Base year |
2022 |
|
Historic period |
2017-2021 |
|
Forecast period |
2023-2027 |
|
Growth momentum & CAGR |
Accelerate at a CAGR of 8.18% |
|
Market growth 2023-2027 |
USD 10.9 billion |
|
Market structure |
Fragmented |
|
YoY growth 2022-2023(%) |
7.6 |
|
Regional analysis |
North America, Europe, Asia, and Rest of World (ROW) |
|
Performing market contribution |
North America at 40% |
|
Key countries |
US, France, Germany, China, and Japan |
|
Competitive landscape |
Leading Vendors, Market Positioning of Vendors, Competitive Strategies, and Industry Risks |
|
Key companies profiled |
Abbott Laboratories, B. Braun Melsungen AG, Bionime Corp., Dexcom Inc., F. Hoffmann La Roche Ltd., iHealth Labs Inc., Insulet Corp., Medtronic Plc, Nemaura Medical Inc., Nipro Corp., Nova Biomedical Corp., Novo Nordisk AS, PHC Holdings Corp., Prodigy Diabetes Care LL, Sanofi SA, Senseonics Holdings Inc., WellDoc Inc., Tandem Diabetes Care Inc., LifeScan IP Holdings LLC, and Eli Lilly and Co. |
|
Market dynamics |
Parent market analysis, Market growth inducers and obstacles, Fast-growing and slow-growing segment analysis, COVID-19 impact and recovery analysis and future consumer dynamics, Market condition analysis for forecast period |
|
Customization purview |
If our report has not included the data that you are looking for, you can reach out to our analysts and get segments customized. |
Key Topics Covered:
1 Executive Summary
- 1.1 Market overview
- Exhibit 01: Executive Summary – Chart on Market Overview
- Exhibit 02: Executive Summary – Data Table on Market Overview
- Exhibit 03: Executive Summary – Chart on Global Market Characteristics
- Exhibit 04: Executive Summary – Chart on Market by Geography
- Exhibit 05: Executive Summary – Chart on Market Segmentation by Product Type
- Exhibit 06: Executive Summary – Chart on Market Segmentation by Distribution Channel
- Exhibit 07: Executive Summary – Chart on Incremental Growth
- Exhibit 08: Executive Summary – Data Table on Incremental Growth
- Exhibit 09: Executive Summary – Chart on Vendor Market Positioning
2 Market Landscape
- 2.1 Market ecosystem
- Exhibit 10: Parent market
- Exhibit 11: Market Characteristics
3 Market Sizing
- 3.1 Market definition
- Exhibit 12: Offerings of vendors included in the market definition
- 3.2 Market segment analysis
- Exhibit 13: Market segments
- 3.4 Market outlook: Forecast for 2022-2027
- Exhibit 14: Chart on Global – Market size and forecast 2022-2027 ($ billion)
- Exhibit 15: Data Table on Global – Market size and forecast 2022-2027 ($ billion)
- Exhibit 16: Chart on Global Market: Year-over-year growth 2022-2027 (%)
- Exhibit 17: Data Table on Global Market: Year-over-year growth 2022-2027 (%)
4 Historic Market Size
- 4.1 Global diabetes management devices market 2017 – 2021
- Exhibit 18: Historic Market Size – Data Table on global diabetes management devices market 2017 – 2021 ($ billion)
- 4.2 Product Type Segment Analysis 2017 – 2021
- Exhibit 19: Historic Market Size – Product Type Segment 2017 – 2021 ($ billion)
- 4.3 Distribution Channel Segment Analysis 2017 – 2021
- Exhibit 20: Historic Market Size – Distribution Channel Segment 2017 – 2021 ($ billion)
- 4.4 Geography Segment Analysis 2017 – 2021
- Exhibit 21: Historic Market Size – Geography Segment 2017 – 2021 ($ billion)
- 4.5 Country Segment Analysis 2017 – 2021
- Exhibit 22: Historic Market Size – Country Segment 2017 – 2021 ($ billion)
5 Five Forces Analysis
- 5.1 Five forces summary
- Exhibit 23: Five forces analysis – Comparison between 2022 and 2027
- 5.2 Bargaining power of buyers
- Exhibit 24: Chart on Bargaining power of buyers – Impact of key factors 2022 and 2027
- 5.3 Bargaining power of suppliers
- Exhibit 25: Bargaining power of suppliers – Impact of key factors in 2022 and 2027
- 5.4 Threat of new entrants
- Exhibit 26: Threat of new entrants – Impact of key factors in 2022 and 2027
- 5.5 Threat of substitutes
- Exhibit 27: Threat of substitutes – Impact of key factors in 2022 and 2027
- 5.6 Threat of rivalry
- Exhibit 28: Threat of rivalry – Impact of key factors in 2022 and 2027
- 5.7 Market condition
- Exhibit 29: Chart on Market condition – Five forces 2022 and 2027
6 Market Segmentation by Product Type
- 6.1 Market segments
- Exhibit 30: Chart on Product Type – Market share 2022-2027 (%)
- Exhibit 31: Data Table on Product Type – Market share 2022-2027 (%)
- 6.2 Comparison by Product Type
- Exhibit 32: Chart on Comparison by Product Type
- Exhibit 33: Data Table on Comparison by Product Type
- 6.3 Blood glucose monitoring devices – Market size and forecast 2022-2027
- Exhibit 34: Chart on Blood glucose monitoring devices – Market size and forecast 2022-2027 ($ billion)
- Exhibit 35: Data Table on Blood glucose monitoring devices – Market size and forecast 2022-2027 ($ billion)
- Exhibit 36: Chart on Blood glucose monitoring devices – Year-over-year growth 2022-2027 (%)
- Exhibit 37: Data Table on Blood glucose monitoring devices – Year-over-year growth 2022-2027 (%)
- 6.4 Insulin delivery systems – Market size and forecast 2022-2027
- Exhibit 38: Chart on Insulin delivery systems – Market size and forecast 2022-2027 ($ billion)
- Exhibit 39: Data Table on Insulin delivery systems – Market size and forecast 2022-2027 ($ billion)
- Exhibit 40: Chart on Insulin delivery systems – Year-over-year growth 2022-2027 (%)
- Exhibit 41: Data Table on Insulin delivery systems – Year-over-year growth 2022-2027 (%)
- 6.5 Market opportunity by Product Type
- Exhibit 42: Market opportunity by Product Type ($ billion)
- Exhibit 43: Data Table on Market opportunity by Product Type ($ billion)
7 Market Segmentation by Distribution Channel
- 7.1 Market segments
- Exhibit 44: Chart on Distribution Channel – Market share 2022-2027 (%)
- Exhibit 45: Data Table on Distribution Channel – Market share 2022-2027 (%)
- 7.2 Comparison by Distribution Channel
- Exhibit 46: Chart on Comparison by Distribution Channel
- Exhibit 47: Data Table on Comparison by Distribution Channel
- 7.3 Offline – Market size and forecast 2022-2027
- Exhibit 48: Chart on Offline – Market size and forecast 2022-2027 ($ billion)
- Exhibit 49: Data Table on Offline – Market size and forecast 2022-2027 ($ billion)
- Exhibit 50: Chart on Offline – Year-over-year growth 2022-2027 (%)
- Exhibit 51: Data Table on Offline – Year-over-year growth 2022-2027 (%)
- 7.4 Online – Market size and forecast 2022-2027
- Exhibit 52: Chart on Online – Market size and forecast 2022-2027 ($ billion)
- Exhibit 53: Data Table on Online – Market size and forecast 2022-2027 ($ billion)
- Exhibit 54: Chart on Online – Year-over-year growth 2022-2027 (%)
- Exhibit 55: Data Table on Online – Year-over-year growth 2022-2027 (%)
- 7.5 Market opportunity by Distribution Channel
- Exhibit 56: Market opportunity by Distribution Channel ($ billion)
- Exhibit 57: Data Table on Market opportunity by Distribution Channel ($ billion)
8 Customer Landscape
- 8.1 Customer landscape overview
- Exhibit 58: Analysis of price sensitivity, lifecycle, customer purchase basket, adoption rates, and purchase criteria
9 Geographic Landscape
- 9.1 Geographic segmentation
- Exhibit 59: Chart on Market share by geography 2022-2027 (%)
- Exhibit 60: Data Table on Market share by geography 2022-2027 (%)
- 9.2 Geographic comparison
- Exhibit 61: Chart on Geographic comparison
- Exhibit 62: Data Table on Geographic comparison
- 9.3 North America – Market size and forecast 2022-2027
- Exhibit 63: Chart on North America – Market size and forecast 2022-2027 ($ billion)
- Exhibit 64: Data Table on North America – Market size and forecast 2022-2027 ($ billion)
- Exhibit 65: Chart on North America – Year-over-year growth 2022-2027 (%)
- Exhibit 66: Data Table on North America – Year-over-year growth 2022-2027 (%)
- 9.4 Europe – Market size and forecast 2022-2027
- Exhibit 67: Chart on Europe – Market size and forecast 2022-2027 ($ billion)
- Exhibit 68: Data Table on Europe – Market size and forecast 2022-2027 ($ billion)
- Exhibit 69: Chart on Europe – Year-over-year growth 2022-2027 (%)
- Exhibit 70: Data Table on Europe – Year-over-year growth 2022-2027 (%)
- 9.5 Asia – Market size and forecast 2022-2027
- Exhibit 71: Chart on Asia – Market size and forecast 2022-2027 ($ billion)
- Exhibit 72: Data Table on Asia – Market size and forecast 2022-2027 ($ billion)
- Exhibit 73: Chart on Asia – Year-over-year growth 2022-2027 (%)
- Exhibit 74: Data Table on Asia – Year-over-year growth 2022-2027 (%)
- 9.6 Rest of World (ROW) – Market size and forecast 2022-2027
- Exhibit 75: Chart on Rest of World (ROW) – Market size and forecast 2022-2027 ($ billion)
- Exhibit 76: Data Table on Rest of World (ROW) – Market size and forecast 2022-2027 ($ billion)
- Exhibit 77: Chart on Rest of World (ROW) – Year-over-year growth 2022-2027 (%)
- Exhibit 78: Data Table on Rest of World (ROW) – Year-over-year growth 2022-2027 (%)
- 9.7 US – Market size and forecast 2022-2027
- Exhibit 79: Chart on US – Market size and forecast 2022-2027 ($ billion)
- Exhibit 80: Data Table on US – Market size and forecast 2022-2027 ($ billion)
- Exhibit 81: Chart on US – Year-over-year growth 2022-2027 (%)
- Exhibit 82: Data Table on US – Year-over-year growth 2022-2027 (%)
- 9.8 China – Market size and forecast 2022-2027
- Exhibit 83: Chart on China – Market size and forecast 2022-2027 ($ billion)
- Exhibit 84: Data Table on China – Market size and forecast 2022-2027 ($ billion)
- Exhibit 85: Chart on China – Year-over-year growth 2022-2027 (%)
- Exhibit 86: Data Table on China – Year-over-year growth 2022-2027 (%)
- 9.9 France – Market size and forecast 2022-2027
- Exhibit 87: Chart on France – Market size and forecast 2022-2027 ($ billion)
- Exhibit 88: Data Table on France – Market size and forecast 2022-2027 ($ billion)
- Exhibit 89: Chart on France – Year-over-year growth 2022-2027 (%)
- Exhibit 90: Data Table on France – Year-over-year growth 2022-2027 (%)
- 9.10 Germany – Market size and forecast 2022-2027
- Exhibit 91: Chart on Germany – Market size and forecast 2022-2027 ($ billion)
- Exhibit 92: Data Table on Germany – Market size and forecast 2022-2027 ($ billion)
- Exhibit 93: Chart on Germany – Year-over-year growth 2022-2027 (%)
- Exhibit 94: Data Table on Germany – Year-over-year growth 2022-2027 (%)
- 9.11 Japan – Market size and forecast 2022-2027
- Exhibit 95: Chart on Japan – Market size and forecast 2022-2027 ($ billion)
- Exhibit 96: Data Table on Japan – Market size and forecast 2022-2027 ($ billion)
- Exhibit 97: Chart on Japan – Year-over-year growth 2022-2027 (%)
- Exhibit 98: Data Table on Japan – Year-over-year growth 2022-2027 (%)
- 9.12 Market opportunity by geography
- Exhibit 99: Market opportunity by geography ($ billion)
- Exhibit 100: Data Tables on Market opportunity by geography ($ billion)
10 Drivers, Challenges, and Trends
- 10.3 Impact of drivers and challenges
- Exhibit 101: Impact of drivers and challenges in 2022 and 2027
11 Vendor Landscape
- 11.2 Vendor landscape
- Exhibit 102: Overview on Criticality of inputs and Factors of differentiation
- 11.3 Landscape disruption
- Exhibit 103: Overview on factors of disruption
- 11.4 Industry risks
- Exhibit 104: Impact of key risks on business
12 Vendor Analysis
- 12.1 Vendors covered
- Exhibit 105: Vendors covered
- 12.2 Market positioning of vendors
- Exhibit 106: Matrix on vendor position and classification
- 12.3 Abbott Laboratories
- Exhibit 107: Abbott Laboratories – Overview
- Exhibit 108: Abbott Laboratories – Business segments
- Exhibit 109: Abbott Laboratories – Key news
- Exhibit 110: Abbott Laboratories – Key offerings
- Exhibit 111: Abbott Laboratories – Segment focus
- 12.4 B. Braun Melsungen AG
- Exhibit 112: B. Braun Melsungen AG – Overview
- Exhibit 113: B. Braun Melsungen AG – Business segments
- Exhibit 114: B. Braun Melsungen AG – Key news
- Exhibit 115: B. Braun Melsungen AG – Key offerings
- Exhibit 116: B. Braun Melsungen AG – Segment focus
- 12.5 Bionime Corp.
- Exhibit 117: Bionime Corp. – Overview
- Exhibit 118: Bionime Corp. – Product / Service
- Exhibit 119: Bionime Corp. – Key offerings
- 12.6 Dexcom Inc.
- Exhibit 120: Dexcom Inc. – Overview
- Exhibit 121: Dexcom Inc. – Product / Service
- Exhibit 122: Dexcom Inc. – Key news
- Exhibit 123: Dexcom Inc. – Key offerings
- 12.7 Eli Lilly and Co.
- Exhibit 124: Eli Lilly and Co. – Overview
- Exhibit 125: Eli Lilly and Co. – Product / Service
- Exhibit 126: Eli Lilly and Co. – Key news
- Exhibit 127: Eli Lilly and Co. – Key offerings
- 12.8 F. Hoffmann La Roche Ltd.
- Exhibit 128: F. Hoffmann La Roche Ltd. – Overview
- Exhibit 129: F. Hoffmann La Roche Ltd. – Business segments
- Exhibit 130: F. Hoffmann La Roche Ltd. – Key news
- Exhibit 131: F. Hoffmann La Roche Ltd. – Key offerings
- Exhibit 132: F. Hoffmann La Roche Ltd. – Segment focus
- 12.9 iHealth Labs Inc.
- Exhibit 133: iHealth Labs Inc. – Overview
- Exhibit 134: iHealth Labs Inc. – Product / Service
- Exhibit 135: iHealth Labs Inc. – Key offerings
- 12.10 Insulet Corp.
- Exhibit 136: Insulet Corp. – Overview
- Exhibit 137: Insulet Corp. – Product / Service
- Exhibit 138: Insulet Corp. – Key news
- Exhibit 139: Insulet Corp. – Key offerings
- 12.11 LifeScan IP Holdings LLC
- Exhibit 140: LifeScan IP Holdings LLC – Overview
- Exhibit 141: LifeScan IP Holdings LLC – Product / Service
- Exhibit 142: LifeScan IP Holdings LLC – Key offerings
- 12.12 Medtronic Plc
- Exhibit 143: Medtronic Plc – Overview
- Exhibit 144: Medtronic Plc – Business segments
- Exhibit 145: Medtronic Plc – Key news
- Exhibit 146: Medtronic Plc – Key offerings
- Exhibit 147: Medtronic Plc – Segment focus
- 12.13 Nemaura Medical Inc.
- Exhibit 148: Nemaura Medical Inc. – Overview
- Exhibit 149: Nemaura Medical Inc. – Product / Service
- Exhibit 150: Nemaura Medical Inc. – Key offerings
- 12.14 Nipro Corp.
- Exhibit 151: Nipro Corp. – Overview
- Exhibit 152: Nipro Corp. – Business segments
- Exhibit 153: Nipro Corp. – Key offerings
- Exhibit 154: Nipro Corp. – Segment focus
- 12.15 Novo Nordisk AS
- Exhibit 155: Novo Nordisk AS – Overview
- Exhibit 156: Novo Nordisk AS – Business segments
- Exhibit 157: Novo Nordisk AS – Key offerings
- Exhibit 158: Novo Nordisk AS – Segment focus
- 12.16 PHC Holdings Corp.
- Exhibit 159: PHC Holdings Corp. – Overview
- Exhibit 160: PHC Holdings Corp. – Business segments
- Exhibit 161: PHC Holdings Corp. – Key offerings
- Exhibit 162: PHC Holdings Corp. – Segment focus
- 12.17 WellDoc Inc.
- Exhibit 163: WellDoc Inc. – Overview
- Exhibit 164: WellDoc Inc. – Key offerings
13 Appendix
- 13.1 Scope of the report
- 13.2 Inclusions and exclusions checklist
- Exhibit 165: Inclusions checklist
- Exhibit 166: Exclusions checklist
- 13.3 Currency conversion rates for US$
- Exhibit 167: Currency conversion rates for US$
- 13.4 Research methodology
- Exhibit 168: Research methodology
- Exhibit 169: Validation techniques employed for market sizing
- Exhibit 170: Information sources
- 13.5 List of abbreviations
- Exhibit 171: List of abbreviations
About Us
Technavio is a leading global technology research and advisory company. Their research and analysis focuses on emerging market trends and provides actionable insights to help businesses identify market opportunities and develop effective strategies to optimize their market positions. With over 500 specialized analysts, Technavio’s report library consists of more than 17,000 reports and counting, covering 800 technologies, spanning across 50 countries. Their client base consists of enterprises of all sizes, including more than 100 Fortune 500 companies. This growing client base relies on Technavio’s comprehensive coverage, extensive research, and actionable market insights to identify opportunities in existing and potential markets and assess their competitive positions within changing market scenarios.
Contact
Technavio Research
Jesse Maida
Media & Marketing Executive
US: +1 844 364 1100
UK: +44 203 893 3200
Email: [email protected]
Website: www.technavio.com/
SOURCE Technavio
