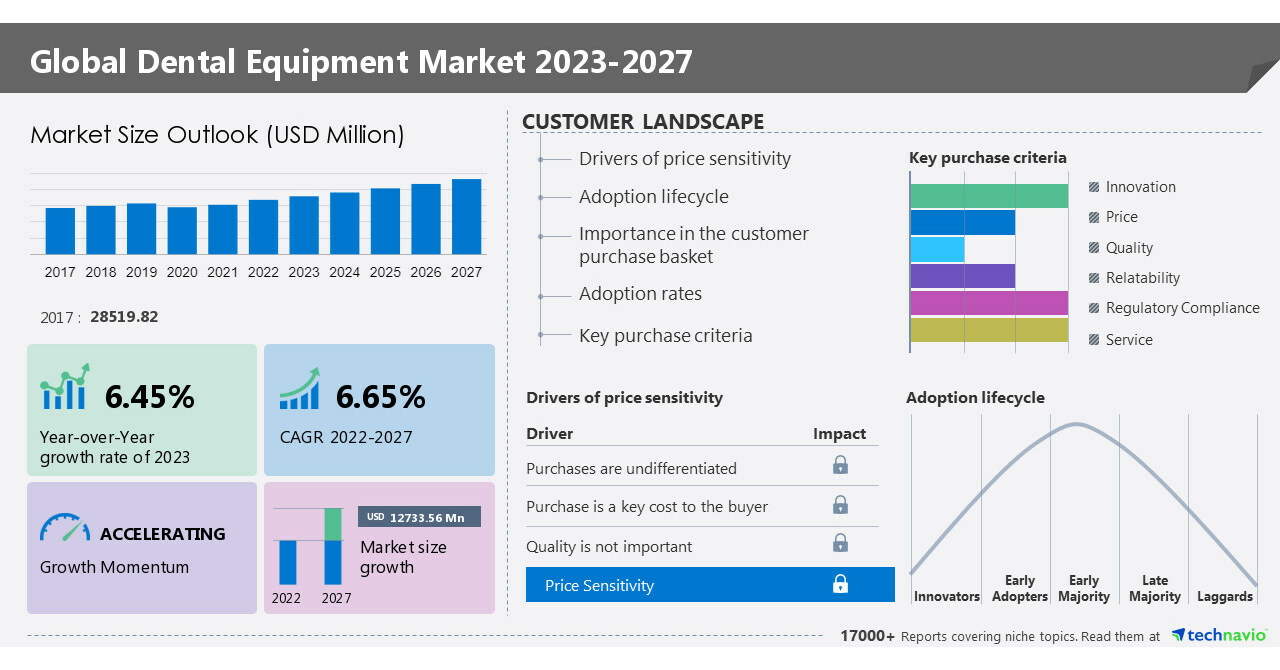
NEW YORK, June 16, 2023 /PRNewswire/ — The dental equipment market is set to grow by USD 12,733.56 million from 2022 to 2027 progressing at a CAGR of 6.65% during the forecast period. The report offers an up-to-date analysis regarding the current global market scenario, the latest trends and drivers, and the overall market environment. Tax reimbursement is a major factor that is driving the market growth. Various countries such as Austria, Mexico, Poland, Spain, Turkey, Denmark, Greece, Italy, Sweden, Finland, and the UK offer free or subsidized dental services. Dental professionals and clinics can benefit from tax deductions under Section 179 of the IRS tax code in the US. Hence, such factors drive the market growth during the forecast period. –Here is an Exclusive report talking about Market scenarios with a historical period (2017-2021) and the forecast period (2023-2027). Download Sample Report in minutes!
The dental equipment market covers the following areas:
The report on the dental equipment market provides a holistic update, market size and forecast, trends, growth drivers, and challenges, as well as vendor analysis.
Dental Equipment Market 2023-2027 – Market Dynamics
Significant Trends
A major trend influencing the growth of the market is the rapid adoption of 3D printing technology for clinical and research purposes. Since 3D printing allows for the creation of complex shapes, porous structures, and internal support structures, which are not possible with conventional manufacturing techniques, it reduces manufacturing costs and waits times. Moreover, the market growth of 3D printing technology in dentistry is driven by its ability to improve the fit, comfort, and ease of dental implant surgery. Hence, such trends fuel the growth of the market during the forecast period.
Major Challenges
A major challenge for the growth of the dental equipment market is the high cost of advanced dental equipment. The earnings of dentists have declined in the US. Moreover, the median overheads for dental practices are around 75%, making the establishment of dental clinics expensive. Furthermore, a high-end dental 3D printer can cost up to millions of dollars, while an advanced dental chair is over USD 7,000. Thus, the cost of a dental laser ranges from USD 6,000- USD 80,000, and end-users are responsible for maintenance and repair expenses. Hence, such challenges impede the market growth during the forecast period.
What’s New? –
- Special coverage on the Russia–Ukraine war; global inflation; recovery analysis from COVID-19; supply chain disruptions, global trade tensions; and risk of recession
- Global competitiveness and key competitor positions
- Market presence across multiple geographical footprints – Strong/Active/Niche/Trivial – Buy the report!
Dental Equipment Market 2023-2027: Market Segmentation
Technavio has divided the market into three segments that are End-User, Product, and Geography. These three segments have their own subsegments. The subsegments for three segments are end-user (laboratories, hospitals, and clinics), product (dental diagnostics and surgical equipment, dental consumables, and dental laser), and geography (North America, Europe, Asia, and Rest Of World (ROW)).
- The market share growth by the laboratories segment will be significant during the forecast period. Over the past few years, the number of dental laboratories and technicians working in dental laboratories has been growing. According to the US Bureau of Labor Statistics, there were 34,150 dental laboratory technicians working in 9,435 dental laboratories all over the US. Also, according to data from the US Bureau of Labor Statistics Employment Projections program, the number of dental laboratory technicians is projected to increase by 12% between 2020 and 2030. Furthermore, there were 14 dental technology programs in the US accredited by the Commission on Dental Accreditation (CODA) in 2022. These training and educational programs affiliated with the government are likely to increase the number of dental laboratory technicians. Hence, such factors drive the segment growth during the forecast period.
This report presents a detailed picture of the market by the way of study, synthesis, and summation of data from multiple sources through an analysis of key parameters- View Sample Report
Companies Mentioned
- 3M Co.
- 3Shape AS
- A dec Inc
- Align Technology Inc.
- Alpha Bio Tec. Ltd.
- BEGO GmbH and Co. KG
- BIOLASE Inc.
- Carestream Dental LLC
- DentalEZ Inc.
- Dentsply Sirona Inc.
- Institut Straumann AG
- GC Corp.
- J. Morita Corp.
- Midmark Corp.
- Nakanishi Inc.
- Planmeca Oy
- PreXion Inc.
- TAKARA BELMONT Corp.
- Ultradent Products Inc.
- THE YOSHIDA DENTAL MFG. Co. Ltd.
Vendor Offerings
- 3M Co. – The company offers dental equipment such as Implant drills, Curing lights, and accessories.
- 3Shape AS – The company offers dental equipment such as Intraoral Scanners.
- A dec Inc – The company offers dental equipment such as A dec Handpieces and Motors.
Gain instant access to 17,000+ market research reports.
Technavio’s SUBSCRIPTION platform
Related Reports:
- The dentures market is estimated to grow at a CAGR of 6.85% between 2022 and 2027. The size of the market is forecast to increase by USD 991.6 million. This report extensively covers market segmentation by product (partial dentures and complete dentures), end-user (hospitals, dental clinics, and others), material (alginates, vinyl polysiloxane, polyether, polysulphides, and others), and geography (North America, Europe, Asia, and Rest of World). The high demand for dental care is notably driving the market growth, although factors such as the availability of alternatives may impede the market growth.
- The dental surgical equipment market is estimated to grow at a CAGR of 7.53% between 2022 and 2027. The size of the market is forecast to increase by USD 2,103.18 million. This dental surgical equipment market report extensively covers market segmentation by Product (dental systems and equipment and dental lasers), End-user (clinics and hospitals), and Geography (North America, Europe, Asia, and Rest of World (ROW)). The increasing prevalence of dental diseases and related risk factors is notably driving the dental surgical equipment market growth, although factors such as the high cost of dental equipment may impede the market growth.
|
Dental Equipment Market Scope |
|
|
Report Coverage |
Details |
|
Base year |
2022 |
|
Historic period |
2017-2021 |
|
Forecast period |
2023-2027 |
|
Growth momentum & CAGR |
Accelerate at a CAGR of 6.65% |
|
Market growth 2023-2027 |
USD 12,733.56 million |
|
Market structure |
Fragmented |
|
YoY growth 2022-2023(%) |
6.45 |
|
Regional analysis |
North America, Europe, Asia, and Rest of World (ROW) |
|
Performing market contribution |
North America at 42% |
|
Key countries |
US, Canada, Germany, France, and UK |
|
Competitive landscape |
Leading Vendors, Market Positioning of Vendors, Competitive Strategies, and Industry Risks |
|
Key companies profiled |
3M Co., 3Shape AS, A dec Inc, Align Technology Inc., Alpha Bio Tec. Ltd., BEGO GmbH and Co. KG, BIOLASE Inc., Carestream Dental LLC, DentalEZ Inc., Dentsply Sirona Inc., Institut Straumann AG, GC Corp., J. Morita Corp., Midmark Corp., Nakanishi Inc., Planmeca Oy, PreXion Inc., TAKARA BELMONT Corp., Ultradent Products Inc., and THE YOSHIDA DENTAL MFG. Co. Ltd. |
|
Market dynamics |
Parent market analysis, Market growth inducers and obstacles, Fast-growing and slow-growing segment analysis, COVID-19 impact and recovery analysis and future consumer dynamics, Market condition analysis for forecast period. |
|
Customization purview |
If our report has not included the data that you are looking for, you can reach out to our analysts and get segments customized. |
Key Topics Covered:
1 Executive Summary
- 1.1 Market overview
- Exhibit 01: Executive Summary – Chart on Market Overview
- Exhibit 02: Executive Summary – Data Table on Market Overview
- Exhibit 03: Executive Summary – Chart on Global Market Characteristics
- Exhibit 04: Executive Summary – Chart on Market by Geography
- Exhibit 05: Executive Summary – Chart on Market Segmentation by End-user
- Exhibit 06: Executive Summary – Chart on Market Segmentation by Product
- Exhibit 07: Executive Summary – Chart on Incremental Growth
- Exhibit 08: Executive Summary – Data Table on Incremental Growth
- Exhibit 09: Executive Summary – Chart on Vendor Market Positioning
2 Market Landscape
- 2.1 Market ecosystem
- Exhibit 10: Parent market
- Exhibit 11: Market Characteristics
3 Market Sizing
- 3.1 Market definition
- Exhibit 12: Offerings of vendors included in the market definition
- 3.2 Market segment analysis
- Exhibit 13: Market segments
- 3.4 Market outlook: Forecast for 2022-2027
- Exhibit 14: Chart on Global – Market size and forecast 2022-2027 ($ million)
- Exhibit 15: Data Table on Global – Market size and forecast 2022-2027 ($ million)
- Exhibit 16: Chart on Global Market: Year-over-year growth 2022-2027 (%)
- Exhibit 17: Data Table on Global Market: Year-over-year growth 2022-2027 (%)
4 Historic Market Size
- 4.1 Global dental equipment market 2017 – 2021
- Exhibit 18: Historic Market Size – Data Table on Global dental equipment market 2017 – 2021 ($ million)
- 4.2 End-User Segment Analysis 2017 – 2021
- Exhibit 19: Historic Market Size – End-User Segment 2017 – 2021 ($ million)
- 4.3 Product Segment Analysis 2017 – 2021
- Exhibit 20: Historic Market Size – Product Segment 2017 – 2021 ($ million)
- 4.4 Geography Segment Analysis 2017 – 2021
- Exhibit 21: Historic Market Size – Geography Segment 2017 – 2021 ($ million)
- 4.5 Country Segment Analysis 2017 – 2021
- Exhibit 22: Historic Market Size – Country Segment 2017 – 2021 ($ million)
5 Five Forces Analysis
- 5.1 Five forces summary
- Exhibit 23: Five forces analysis – Comparison between 2022 and 2027
- 5.2 Bargaining power of buyers
- Exhibit 24: Chart on Bargaining power of buyers – Impact of key factors 2022 and 2027
- 5.3 Bargaining power of suppliers
- Exhibit 25: Bargaining power of suppliers – Impact of key factors in 2022 and 2027
- 5.4 Threat of new entrants
- Exhibit 26: Threat of new entrants – Impact of key factors in 2022 and 2027
- 5.5 Threat of substitutes
- Exhibit 27: Threat of substitutes – Impact of key factors in 2022 and 2027
- 5.6 Threat of rivalry
- Exhibit 28: Threat of rivalry – Impact of key factors in 2022 and 2027
- 5.7 Market condition
- Exhibit 29: Chart on Market condition – Five forces 2022 and 2027
6 Market Segmentation by End-user
- 6.1 Market segments
- Exhibit 30: Chart on End-user – Market share 2022-2027 (%)
- Exhibit 31: Data Table on End-user – Market share 2022-2027 (%)
- 6.2 Comparison by End-user
- Exhibit 32: Chart on Comparison by End-user
- Exhibit 33: Data Table on Comparison by End-user
- 6.3 Laboratories – Market size and forecast 2022-2027
- Exhibit 34: Chart on Laboratories – Market size and forecast 2022-2027 ($ million)
- Exhibit 35: Data Table on Laboratories – Market size and forecast 2022-2027 ($ million)
- Exhibit 36: Chart on Laboratories – Year-over-year growth 2022-2027 (%)
- Exhibit 37: Data Table on Laboratories – Year-over-year growth 2022-2027 (%)
- 6.4 Hospitals – Market size and forecast 2022-2027
- Exhibit 38: Chart on Hospitals – Market size and forecast 2022-2027 ($ million)
- Exhibit 39: Data Table on Hospitals – Market size and forecast 2022-2027 ($ million)
- Exhibit 40: Chart on Hospitals – Year-over-year growth 2022-2027 (%)
- Exhibit 41: Data Table on Hospitals – Year-over-year growth 2022-2027 (%)
- 6.5 Clinics – Market size and forecast 2022-2027
- Exhibit 42: Chart on Clinics – Market size and forecast 2022-2027 ($ million)
- Exhibit 43: Data Table on Clinics – Market size and forecast 2022-2027 ($ million)
- Exhibit 44: Chart on Clinics – Year-over-year growth 2022-2027 (%)
- Exhibit 45: Data Table on Clinics – Year-over-year growth 2022-2027 (%)
- 6.6 Market opportunity by End-user
- Exhibit 46: Market opportunity by End-user ($ million)
7 Market Segmentation by Product
- 7.1 Market segments
- Exhibit 47: Chart on Product – Market share 2022-2027 (%)
- Exhibit 48: Data Table on Product – Market share 2022-2027 (%)
- 7.2 Comparison by Product
- Exhibit 49: Chart on Comparison by Product
- Exhibit 50: Data Table on Comparison by Product
- 7.3 Dental diagnostics and surgical equipment – Market size and forecast 2022-2027
- Exhibit 51: Chart on Dental diagnostics and surgical equipment – Market size and forecast 2022-2027 ($ million)
- Exhibit 52: Data Table on Dental diagnostics and surgical equipment – Market size and forecast 2022-2027 ($ million)
- Exhibit 53: Chart on Dental diagnostics and surgical equipment – Year-over-year growth 2022-2027 (%)
- Exhibit 54: Data Table on Dental diagnostics and surgical equipment – Year-over-year growth 2022-2027 (%)
- 7.4 Dental consumables – Market size and forecast 2022-2027
- Exhibit 55: Chart on Dental consumables – Market size and forecast 2022-2027 ($ million)
- Exhibit 56: Data Table on Dental consumables – Market size and forecast 2022-2027 ($ million)
- Exhibit 57: Chart on Dental consumables – Year-over-year growth 2022-2027 (%)
- Exhibit 58: Data Table on Dental consumables – Year-over-year growth 2022-2027 (%)
- 7.5 Dental laser – Market size and forecast 2022-2027
- Exhibit 59: Chart on Dental laser – Market size and forecast 2022-2027 ($ million)
- Exhibit 60: Data Table on Dental laser – Market size and forecast 2022-2027 ($ million)
- Exhibit 61: Chart on Dental laser – Year-over-year growth 2022-2027 (%)
- Exhibit 62: Data Table on Dental laser – Year-over-year growth 2022-2027 (%)
- 7.6 Market opportunity by Product
- Exhibit 63: Market opportunity by Product ($ million)
8 Customer Landscape
- 8.1 Customer landscape overview
- Exhibit 64: Analysis of price sensitivity, lifecycle, customer purchase basket, adoption rates, and purchase criteria
9 Geographic Landscape
- 9.1 Geographic segmentation
- Exhibit 65: Chart on Market share by geography 2022-2027 (%)
- Exhibit 66: Data Table on Market share by geography 2022-2027 (%)
- 9.2 Geographic comparison
- Exhibit 67: Chart on Geographic comparison
- Exhibit 68: Data Table on Geographic comparison
- 9.3 North America – Market size and forecast 2022-2027
- Exhibit 69: Chart on North America – Market size and forecast 2022-2027 ($ million)
- Exhibit 70: Data Table on North America – Market size and forecast 2022-2027 ($ million)
- Exhibit 71: Chart on North America – Year-over-year growth 2022-2027 (%)
- Exhibit 72: Data Table on North America – Year-over-year growth 2022-2027 (%)
- 9.4 Europe – Market size and forecast 2022-2027
- Exhibit 73: Chart on Europe – Market size and forecast 2022-2027 ($ million)
- Exhibit 74: Data Table on Europe – Market size and forecast 2022-2027 ($ million)
- Exhibit 75: Chart on Europe – Year-over-year growth 2022-2027 (%)
- Exhibit 76: Data Table on Europe – Year-over-year growth 2022-2027 (%)
- 9.5 Asia – Market size and forecast 2022-2027
- Exhibit 77: Chart on Asia – Market size and forecast 2022-2027 ($ million)
- Exhibit 78: Data Table on Asia – Market size and forecast 2022-2027 ($ million)
- Exhibit 79: Chart on Asia – Year-over-year growth 2022-2027 (%)
- Exhibit 80: Data Table on Asia – Year-over-year growth 2022-2027 (%)
- 9.6 Rest of World (ROW) – Market size and forecast 2022-2027
- Exhibit 81: Chart on Rest of World (ROW) – Market size and forecast 2022-2027 ($ million)
- Exhibit 82: Data Table on Rest of World (ROW) – Market size and forecast 2022-2027 ($ million)
- Exhibit 83: Chart on Rest of World (ROW) – Year-over-year growth 2022-2027 (%)
- Exhibit 84: Data Table on Rest of World (ROW) – Year-over-year growth 2022-2027 (%)
- 9.7 US – Market size and forecast 2022-2027
- Exhibit 85: Chart on US – Market size and forecast 2022-2027 ($ million)
- Exhibit 86: Data Table on US – Market size and forecast 2022-2027 ($ million)
- Exhibit 87: Chart on US – Year-over-year growth 2022-2027 (%)
- Exhibit 88: Data Table on US – Year-over-year growth 2022-2027 (%)
- 9.8 Germany – Market size and forecast 2022-2027
- Exhibit 89: Chart on Germany – Market size and forecast 2022-2027 ($ million)
- Exhibit 90: Data Table on Germany – Market size and forecast 2022-2027 ($ million)
- Exhibit 91: Chart on Germany – Year-over-year growth 2022-2027 (%)
- Exhibit 92: Data Table on Germany – Year-over-year growth 2022-2027 (%)
- 9.9 France – Market size and forecast 2022-2027
- Exhibit 93: Chart on France – Market size and forecast 2022-2027 ($ million)
- Exhibit 94: Data Table on France – Market size and forecast 2022-2027 ($ million)
- Exhibit 95: Chart on France – Year-over-year growth 2022-2027 (%)
- Exhibit 96: Data Table on France – Year-over-year growth 2022-2027 (%)
- 9.10 Canada – Market size and forecast 2022-2027
- Exhibit 97: Chart on Canada – Market size and forecast 2022-2027 ($ million)
- Exhibit 98: Data Table on Canada – Market size and forecast 2022-2027 ($ million)
- Exhibit 99: Chart on Canada – Year-over-year growth 2022-2027 (%)
- Exhibit 100: Data Table on Canada – Year-over-year growth 2022-2027 (%)
- 9.11 UK – Market size and forecast 2022-2027
- Exhibit 101: Chart on UK – Market size and forecast 2022-2027 ($ million)
- Exhibit 102: Data Table on UK – Market size and forecast 2022-2027 ($ million)
- Exhibit 103: Chart on UK – Year-over-year growth 2022-2027 (%)
- Exhibit 104: Data Table on UK – Year-over-year growth 2022-2027 (%)
- 9.12 Market opportunity by geography
- Exhibit 105: Market opportunity by geography ($ million)
10 Drivers, Challenges, and Trends
- 10.3 Impact of drivers and challenges
- Exhibit 106: Impact of drivers and challenges in 2022 and 2027
11 Vendor Landscape
- 11.2 Vendor landscape
- Exhibit 107: Overview on Criticality of inputs and Factors of differentiation
- 11.3 Landscape disruption
- Exhibit 108: Overview on factors of disruption
- 11.4 Industry risks
- Exhibit 109: Impact of key risks on business
12 Vendor Analysis
- 12.1 Vendors covered
- Exhibit 110: Vendors covered
- 12.2 Market positioning of vendors
- Exhibit 111: Matrix on vendor position and classification
- 12.3 3M Co.
- Exhibit 112: 3M Co. – Overview
- Exhibit 113: 3M Co. – Business segments
- Exhibit 114: 3M Co. – Key offerings
- Exhibit 115: 3M Co. – Segment focus
- 12.4 3Shape AS
- Exhibit 116: 3Shape AS – Overview
- Exhibit 117: 3Shape AS – Product / Service
- Exhibit 118: 3Shape AS – Key offerings
- 12.5 A dec Inc
- Exhibit 119: A dec Inc – Overview
- Exhibit 120: A dec Inc – Product / Service
- Exhibit 121: A dec Inc – Key offerings
- 12.6 Align Technology Inc.
- Exhibit 122: Align Technology Inc. – Overview
- Exhibit 123: Align Technology Inc. – Business segments
- Exhibit 124: Align Technology Inc. – Key offerings
- Exhibit 125: Align Technology Inc. – Segment focus
- 12.7 Alpha Bio Tec. Ltd.
- Exhibit 126: Alpha Bio Tec. Ltd. – Overview
- Exhibit 127: Alpha Bio Tec. Ltd. – Product / Service
- Exhibit 128: Alpha Bio Tec. Ltd. – Key offerings
- 12.8 BEGO GmbH and Co. KG
- Exhibit 129: BEGO GmbH and Co. KG – Overview
- Exhibit 130: BEGO GmbH and Co. KG – Product / Service
- Exhibit 131: BEGO GmbH and Co. KG – Key offerings
- 12.9 BIOLASE Inc.
- Exhibit 132: BIOLASE Inc. – Overview
- Exhibit 133: BIOLASE Inc. – Product / Service
- Exhibit 134: BIOLASE Inc. – Key offerings
- 12.10 Dentsply Sirona Inc.
- Exhibit 135: Dentsply Sirona Inc. – Overview
- Exhibit 136: Dentsply Sirona Inc. – Business segments
- Exhibit 137: Dentsply Sirona Inc. – Key news
- Exhibit 138: Dentsply Sirona Inc. – Key offerings
- Exhibit 139: Dentsply Sirona Inc. – Segment focus
- 12.11 Institut Straumann AG
- Exhibit 140: Institut Straumann AG – Overview
- Exhibit 141: Institut Straumann AG – Business segments
- Exhibit 142: Institut Straumann AG – Key news
- Exhibit 143: Institut Straumann AG – Key offerings
- Exhibit 144: Institut Straumann AG – Segment focus
- 12.12 GC Corp.
- Exhibit 145: GC Corp. – Overview
- Exhibit 146: GC Corp. – Product / Service
- Exhibit 147: GC Corp. – Key offerings
- 12.13 J. Morita Corp.
- Exhibit 148: J. Morita Corp. – Overview
- Exhibit 149: J. Morita Corp. – Product / Service
- Exhibit 150: J. Morita Corp. – Key offerings
- 12.14 Midmark Corp.
- Exhibit 151: Midmark Corp. – Overview
- Exhibit 152: Midmark Corp. – Product / Service
- Exhibit 153: Midmark Corp. – Key offerings
- 12.15 Planmeca Oy
- Exhibit 154: Planmeca Oy – Overview
- Exhibit 155: Planmeca Oy – Product / Service
- Exhibit 156: Planmeca Oy – Key offerings
- 12.16 THE YOSHIDA DENTAL MFG. Co. Ltd.
- Exhibit 157: THE YOSHIDA DENTAL MFG. Co. Ltd. – Overview
- Exhibit 158: THE YOSHIDA DENTAL MFG. Co. Ltd. – Product / Service
- Exhibit 159: THE YOSHIDA DENTAL MFG. Co. Ltd. – Key offerings
- 12.17 Ultradent Products Inc.
- Exhibit 160: Ultradent Products Inc. – Overview
- Exhibit 161: Ultradent Products Inc. – Product / Service
- Exhibit 162: Ultradent Products Inc. – Key offerings
13 Appendix
- 13.1 Scope of the report
- 13.2 Inclusions and exclusions checklist
- Exhibit 163: Inclusions checklist
- Exhibit 164: Exclusions checklist
- 13.3 Currency conversion rates for US$
- Exhibit 165: Currency conversion rates for US$
- 13.4 Research methodology
- Exhibit 166: Research methodology
- Exhibit 167: Validation techniques employed for market sizing
- Exhibit 168: Information sources
- 13.5 List of abbreviations
- Exhibit 169: List of abbreviations
About Us
Technavio is a leading global technology research and advisory company. Their research and analysis focuses on emerging market trends and provides actionable insights to help businesses identify market opportunities and develop effective strategies to optimize their market positions. With over 500 specialized analysts, Technavio’s report library consists of more than 17,000 reports and counting, covering 800 technologies, spanning across 50 countries. Their client base consists of enterprises of all sizes, including more than 100 Fortune 500 companies. This growing client base relies on Technavio’s comprehensive coverage, extensive research, and actionable market insights to identify opportunities in existing and potential markets and assess their competitive positions within changing market scenarios.
Contact
Technavio Research
Jesse Maida
Media & Marketing Executive
US: +1 844 364 1100
UK: +44 203 893 3200
Email: [email protected]
Website: www.technavio.com
SOURCE Technavio
