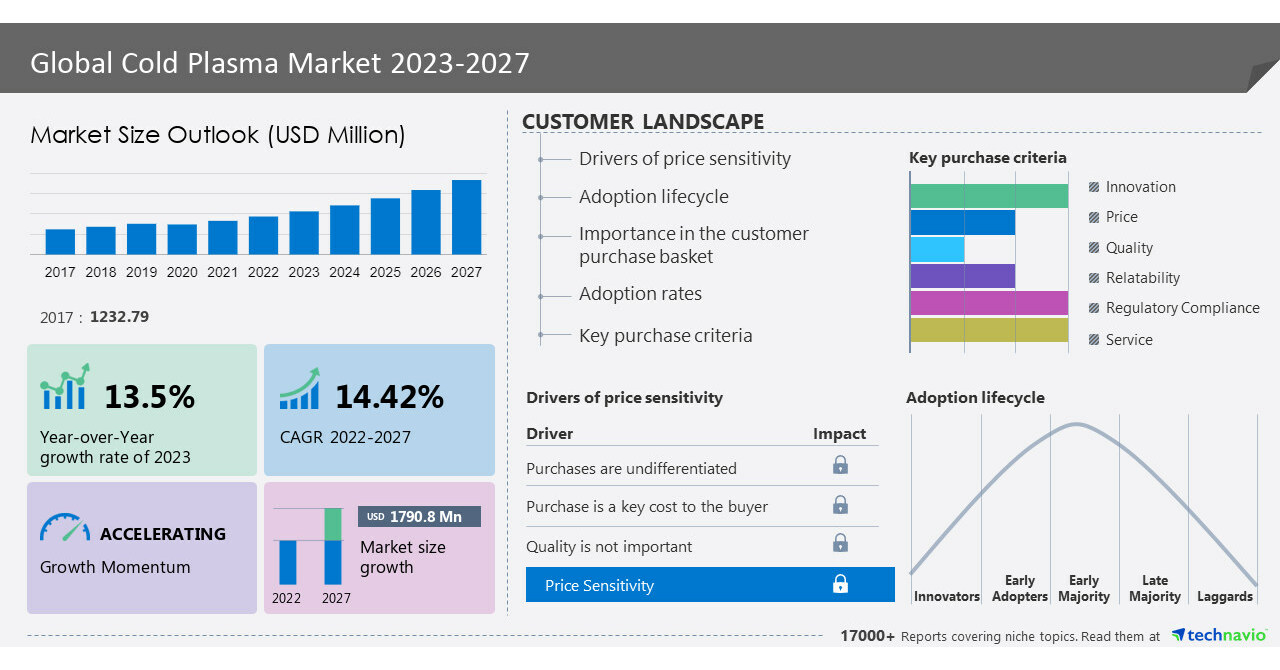
NEW YORK, Nov. 7, 2023 /PRNewswire/ — The cold plasma market is set to grow by USD 1,790.8 million from 2022 to 2027, progressing at a CAGR of 14.42% during the forecast period. The report offers an up-to-date analysis regarding the current global market scenario, the latest trends and drivers, and the overall market environment. The increasing demand for eco-friendly and sustainable technologies is notably driving market growth. Industries, including food, healthcare, and textiles, are seeking alternatives to conventional chemical-based processes. One such alternative gaining attention is cold plasma technology, which offers non-toxic and environmentally friendly advantages. It produces minimal harmful byproducts and requires fewer chemicals. In the textile sector, cold plasma treatment shows promise in replacing traditional chemical methods like scouring and bleaching. Similarly, in the food industry, it can effectively remove chemical residues, replace disinfectants, and decontaminate surfaces. Furthermore, the healthcare industry is exploring cold plasma sterilization techniques. The demand for eco-friendly and sustainable solutions is driven by factors such as increasing consumer awareness, corporate sustainability initiatives, and governmental regulations. As cold plasma technology aligns with sustainability goals, the global cold plasma market is experiencing expansion. The growing demand for environmentally friendly and sustainable technologies will continue to drive the market’s growth during the forecast period. Here is an Exclusive report talking about Market scenarios with a historical period (2017-2021) and forecast period (2023-2027). Download Sample Report in minutes!
The cold plasma market covers the following areas:
Cold Plasma Market 2023-2027 – Market Dynamics
Trends
The increasing demand for miniaturization and portability of cold plasma equipment is an emerging trend shaping the market growth. The market is witnessing a growing trend of developing small and portable cold plasma equipment. The versatility and convenience of cold plasma technology make it suitable for various settings and applications, including decontamination, surface sterilization, surface activation in manufacturing, and tissue regeneration in medical settings. The compact and portable nature of these devices allows for easy integration into existing systems and equipment, making them ideal for laboratories, clinics, field applications, and even homes. For instance, portable cold plasma devices are being designed specifically for wound healing applications. These advancements open up new opportunities for expanding the use of cold plasma technology across different industries, such as electronics and textiles. As a result, the market is expected to experience significant growth during the forecast period.
Challenge
High initial setup and operating costs are major challenges hindering market growth. The adoption of cold plasma technology by small and medium-sized businesses (SMEs) can be challenging due to the high costs involved. Cold plasma systems require significant upfront investments and ongoing expenses, including equipment purchase, installation, training, and maintenance. For SMEs with limited financial resources, these costs can be prohibitive, making it difficult for them to incorporate cold plasma technology into their operations. This limitation can particularly affect SMEs in the manufacturing sector, as they may struggle to compete in the market if they cannot afford to invest in cold plasma equipment. As a result, the market growth for cold plasma technology may be negatively impacted during the forecast period.
What’s New? –
- Special coverage on the Russia–Ukraine war; global inflation; recovery analysis from COVID-19; supply chain disruptions, global trade tensions; and risk of recession
- Global competitiveness and key competitor positions
- Market presence across multiple geographical footprints – Strong/Active/Niche/Trivial – Buy the report!
Cold Plasma Market 2023-2027: Market Segmentation
This cold plasma market report extensively covers market segmentation by end-user (polymer and plastic industry, electronics and semiconductors industry, food and agriculture industry, textile industry, and medical industry), type (atmospheric cold plasma and low-pressure cold plasma), and geography (North America, Europe, Asia, and Rest of World (ROW)).
- The market share growth by the polymer and plastic industry segment will be significant during the forecast period. The growth of this segment can be attributed to various factors, including enhanced coating and plastic adhesion, improved surface activation and cleaning, efficient elimination of impurities and pollutants, modification of surface quality, and reduced environmental impact. Cold plasma technology finds extensive use in the polymer and plastics industry due to its ability to activate surfaces, deposit coatings, and modify polymer characteristics. Through cold plasma treatment, polymer adhesion qualities are improved, resulting in more effective bonding and coating processes. Additionally, the technology enhances product quality by enabling efficient cleaning and removal of contaminants from plastic surfaces. Moreover, the use of cold plasma technology eliminates the need for chemical cleaners, promoting environmentally friendly manufacturing practices. Key industry players such as Plasmatreat, Europlasma, and Nordson offer products tailored for the polymer and plastic sectors. These factors are expected to drive significant growth in this segment during the forecast period.
This report presents a detailed picture of the market by way of study, synthesis, and summation of data from multiple sources through an analysis of key parameters- View Sample Report
Companies Mentioned
- AcXys Technologies
- Adtec RF
- Advanced Plasma Solutions
- Apyx Medical Corp.
- CINOGY System GmbH
- Coating Plasma Innovation
- Enercon Industries Corp.
- Europlasma NV
- Ferrarini and Benelli Srl
- Henniker Scientific Ltd.
- MPG SA
- Neoplas GmbH
- Nordson Corp.
- PlasmaLeap Pty. Ltd.
- Plasmatreat GmbH
- Tantec AS
- TDK Corp.
- Terraplasma GmbH
- UNIQAIR Technologies Ltd.
- US Medical Innovations LLC
Companies Offerings
- AcXys Technologies – The company offers cold plasma solutions such as ULS nano and ULS range.
- Adtec RF – The company offers cold plasma products such as PlasmaTact 50.
- Advanced Plasma Solutions – The company offers cold plasma solutions for agriculture, 3D Printing, and medicine.
Gain instant access to 17,000+ market research reports.
Technavio’s SUBSCRIPTION platform
Related Reports:
The plasma protease C1 inhibitor market share is expected to increase by USD 1.7 billion from 2021 to 2026, and the market’s growth momentum will accelerate at a CAGR of 7.4%. This report extensively covers plasma protease C1 inhibitor market segmentations by product (lyophilized and injectable) and geography (North America, Europe, Asia, and Rest of World (ROW)). Increasing research and development is one of the key drivers supporting the plasma protease c1 inhibitor market growth.
The plasma therapeutics market share is expected to increase by USD 8.98 billion from 2021 to 2026, and the market’s growth momentum will accelerate at a CAGR of 6.1%. This report extensively covers plasma therapeutics market segmentations by product (immunoglobulin, albumin, blood factors, and others) and geography (North America, Europe, Asia, and Rest of World (ROW)). One of the key factors driving the global plasma therapeutics market growth is the high demand for albumin in China.
|
Cold Plasma Market Scope |
|
|
Report Coverage |
Details |
|
Base year |
2022 |
|
Historic period |
2017-2021 |
|
Forecast period |
2023-2027 |
|
Growth momentum & CAGR |
Accelerate at a CAGR of 14.42% |
|
Market growth 2023-2027 |
USD 1,790.8 million |
|
Market structure |
Fragmented |
|
YoY growth 2022-2023(%) |
13.5 |
|
Regional analysis |
North America, Europe, Asia, and the Rest of the World (ROW) |
|
Performing market contribution |
North America at 35% |
|
Key countries |
US, Canada, Germany, UK, and China |
|
Competitive landscape |
Leading Vendors, Market Positioning of Vendors, Competitive Strategies, and Industry Risks |
|
Key companies profiled |
AcXys Technologies, Adtec RF, Advanced Plasma Solutions, Apyx Medical Corp., CINOGY System GmbH, Coating Plasma Innovation, Enercon Industries Corp., Europlasma NV, Ferrarini and Benelli Srl, Henniker Scientific Ltd., MPG SA, Neoplas GmbH, Nordson Corp., PlasmaLeap Pty. Ltd., Plasmatreat GmbH, Tantec AS, TDK Corp., Terraplasma GmbH, UNIQAIR Technologies Ltd., and US Medical Innovations LLC |
|
Market dynamics |
Parent market analysis, Market growth inducers and obstacles, Fast-growing and slow-growing segment analysis, COVID-19 impact and recovery analysis and future consumer dynamics, Market condition analysis for the forecast period |
|
Customization purview |
If our report has not included the data that you are looking for, you can reach out to our analysts and get segments customized. |
Key Topics Covered:
1 Executive Summary
- 1.1 Market overview
- Exhibit 01: Executive Summary – Chart on Market Overview
- Exhibit 02: Executive Summary – Data Table on Market Overview
- Exhibit 03: Executive Summary – Chart on Global Market Characteristics
- Exhibit 04: Executive Summary – Chart on Market by Geography
- Exhibit 05: Executive Summary – Chart on Market Segmentation by End-user
- Exhibit 06: Executive Summary – Chart on Market Segmentation by Type
- Exhibit 07: Executive Summary – Chart on Incremental Growth
- Exhibit 08: Executive Summary – Data Table on Incremental Growth
- Exhibit 09: Executive Summary – Chart on Vendor Market Positioning
2 Market Landscape
- 2.1 Market ecosystem
- Exhibit 10: Parent market
- Exhibit 11: Market Characteristics
3 Market Sizing
- 3.1 Market definition
- Exhibit 12: Offerings of vendors included in the market definition
- 3.2 Market segment analysis
- Exhibit 13: Market segments
- 3.4 Market outlook: Forecast for 2022-2027
- Exhibit 14: Chart on Global – Market size and forecast 2022-2027 ($ million)
- Exhibit 15: Data Table on Global – Market size and forecast 2022-2027 ($ million)
- Exhibit 16: Chart on Global Market: Year-over-year growth 2022-2027 (%)
- Exhibit 17: Data Table on Global Market: Year-over-year growth 2022-2027 (%)
4 Historic Market Size
- 4.1 Global cold plasma market 2017 – 2021
- Exhibit 18: Historic Market Size – Data Table on global cold plasma market 2017 – 2021 ($ million)
- 4.2 End-user Segment Analysis 2017 – 2021
- Exhibit 19: Historic Market Size – End-user Segment 2017 – 2021 ($ million)
- 4.3 Type Segment Analysis 2017 – 2021
- Exhibit 20: Historic Market Size – Type Segment 2017 – 2021 ($ million)
- 4.4 Geography Segment Analysis 2017 – 2021
- Exhibit 21: Historic Market Size – Geography Segment 2017 – 2021 ($ million)
- 4.5 Country Segment Analysis 2017 – 2021
- Exhibit 22: Historic Market Size – Country Segment 2017 – 2021 ($ million)
5 Five Forces Analysis
- 5.1 Five forces summary
- Exhibit 23: Five forces analysis – Comparison between 2022 and 2027
- 5.2 Bargaining power of buyers
- Exhibit 24: Chart on Bargaining power of buyers – Impact of key factors 2022 and 2027
- 5.3 Bargaining power of suppliers
- Exhibit 25: Bargaining power of suppliers – Impact of key factors in 2022 and 2027
- 5.4 Threat of new entrants
- Exhibit 26: Threat of new entrants – Impact of key factors in 2022 and 2027
- 5.5 Threat of substitutes
- Exhibit 27: Threat of substitutes – Impact of key factors in 2022 and 2027
- 5.6 Threat of rivalry
- Exhibit 28: Threat of rivalry – Impact of key factors in 2022 and 2027
- 5.7 Market condition
- Exhibit 29: Chart on Market condition – Five forces 2022 and 2027
6 Market Segmentation by End-user
- 6.1 Market segments
- Exhibit 30: Chart on End-user – Market share 2022-2027 (%)
- Exhibit 31: Data Table on End-user – Market share 2022-2027 (%)
- 6.2 Comparison by End-user
- Exhibit 32: Chart on Comparison by End-user
- Exhibit 33: Data Table on Comparison by End-user
- 6.3 Polymer and plastic industry – Market size and forecast 2022-2027
- Exhibit 34: Chart on Polymer and plastic industry – Market size and forecast 2022-2027 ($ million)
- Exhibit 35: Data Table on Polymer and plastic industry – Market size and forecast 2022-2027 ($ million)
- Exhibit 36: Chart on Polymer and plastic industry – Year-over-year growth 2022-2027 (%)
- Exhibit 37: Data Table on Polymer and plastic industry – Year-over-year growth 2022-2027 (%)
- 6.4 Electronics and semiconductors industry – Market size and forecast 2022-2027
- Exhibit 38: Chart on Electronics and semiconductors industry – Market size and forecast 2022-2027 ($ million)
- Exhibit 39: Data Table on Electronics and semiconductors industry – Market size and forecast 2022-2027 ($ million)
- Exhibit 40: Chart on Electronics and semiconductors industry – Year-over-year growth 2022-2027 (%)
- Exhibit 41: Data Table on Electronics and semiconductors industry – Year-over-year growth 2022-2027 (%)
- 6.5 Food and agriculture industry – Market size and forecast 2022-2027
- Exhibit 42: Chart on Food and agriculture industry – Market size and forecast 2022-2027 ($ million)
- Exhibit 43: Data Table on Food and agriculture industry – Market size and forecast 2022-2027 ($ million)
- Exhibit 44: Chart on Food and agriculture industry – Year-over-year growth 2022-2027 (%)
- Exhibit 45: Data Table on Food and agriculture industry – Year-over-year growth 2022-2027 (%)
- 6.6 Textile industry – Market size and forecast 2022-2027
- Exhibit 46: Chart on Textile industry – Market size and forecast 2022-2027 ($ million)
- Exhibit 47: Data Table on Textile industry – Market size and forecast 2022-2027 ($ million)
- Exhibit 48: Chart on Textile industry – Year-over-year growth 2022-2027 (%)
- Exhibit 49: Data Table on Textile industry – Year-over-year growth 2022-2027 (%)
- 6.7 Medical industry – Market size and forecast 2022-2027
- Exhibit 50: Chart on Medical industry – Market size and forecast 2022-2027 ($ million)
- Exhibit 51: Data Table on Medical industry – Market size and forecast 2022-2027 ($ million)
- Exhibit 52: Chart on Medical industry – Year-over-year growth 2022-2027 (%)
- Exhibit 53: Data Table on Medical industry – Year-over-year growth 2022-2027 (%)
- 6.8 Market opportunity by End-user
- Exhibit 54: Market opportunity by End-user ($ million)
- Exhibit 55: Data Table on Market opportunity by End-user ($ million)
7 Market Segmentation by Type
- 7.1 Market segments
- Exhibit 56: Chart on Type – Market share 2022-2027 (%)
- Exhibit 57: Data Table on Type – Market share 2022-2027 (%)
- 7.2 Comparison by Type
- Exhibit 58: Chart on Comparison by Type
- Exhibit 59: Data Table on Comparison by Type
- 7.3 Atmospheric cold plasma – Market size and forecast 2022-2027
- Exhibit 60: Chart on Atmospheric cold plasma – Market size and forecast 2022-2027 ($ million)
- Exhibit 61: Data Table on Atmospheric cold plasma – Market size and forecast 2022-2027 ($ million)
- Exhibit 62: Chart on Atmospheric cold plasma – Year-over-year growth 2022-2027 (%)
- Exhibit 63: Data Table on Atmospheric cold plasma – Year-over-year growth 2022-2027 (%)
- 7.4 Low-pressure cold plasma – Market size and forecast 2022-2027
- Exhibit 64: Chart on Low-pressure cold plasma – Market size and forecast 2022-2027 ($ million)
- Exhibit 65: Data Table on Low-pressure cold plasma – Market size and forecast 2022-2027 ($ million)
- Exhibit 66: Chart on Low-pressure cold plasma – Year-over-year growth 2022-2027 (%)
- Exhibit 67: Data Table on Low-pressure cold plasma – Year-over-year growth 2022-2027 (%)
- 7.5 Market opportunity by Type
- Exhibit 68: Market opportunity by Type ($ million)
- Exhibit 69: Data Table on Market opportunity by Type ($ million)
8 Customer Landscape
- 8.1 Customer landscape overview
- Exhibit 70: Analysis of price sensitivity, lifecycle, customer purchase basket, adoption rates, and purchase criteria
9 Geographic Landscape
- 9.1 Geographic segmentation
- Exhibit 71: Chart on Market share by geography 2022-2027 (%)
- Exhibit 72: Data Table on Market share by geography 2022-2027 (%)
- 9.2 Geographic comparison
- Exhibit 73: Chart on Geographic comparison
- Exhibit 74: Data Table on Geographic comparison
- 9.3 North America – Market size and forecast 2022-2027
- Exhibit 75: Chart on North America – Market size and forecast 2022-2027 ($ million)
- Exhibit 76: Data Table on North America – Market size and forecast 2022-2027 ($ million)
- Exhibit 77: Chart on North America – Year-over-year growth 2022-2027 (%)
- Exhibit 78: Data Table on North America – Year-over-year growth 2022-2027 (%)
- 9.4 Europe – Market size and forecast 2022-2027
- Exhibit 79: Chart on Europe – Market size and forecast 2022-2027 ($ million)
- Exhibit 80: Data Table on Europe – Market size and forecast 2022-2027 ($ million)
- Exhibit 81: Chart on Europe – Year-over-year growth 2022-2027 (%)
- Exhibit 82: Data Table on Europe – Year-over-year growth 2022-2027 (%)
- 9.5 Asia – Market size and forecast 2022-2027
- Exhibit 83: Chart on Asia – Market size and forecast 2022-2027 ($ million)
- Exhibit 84: Data Table on Asia – Market size and forecast 2022-2027 ($ million)
- Exhibit 85: Chart on Asia – Year-over-year growth 2022-2027 (%)
- Exhibit 86: Data Table on Asia – Year-over-year growth 2022-2027 (%)
- 9.6 Rest of World (ROW) – Market size and forecast 2022-2027
- Exhibit 87: Chart on Rest of World (ROW) – Market size and forecast 2022-2027 ($ million)
- Exhibit 88: Data Table on Rest of World (ROW) – Market size and forecast 2022-2027 ($ million)
- Exhibit 89: Chart on Rest of World (ROW) – Year-over-year growth 2022-2027 (%)
- Exhibit 90: Data Table on Rest of World (ROW) – Year-over-year growth 2022-2027 (%)
- 9.7 US – Market size and forecast 2022-2027
- Exhibit 91: Chart on US – Market size and forecast 2022-2027 ($ million)
- Exhibit 92: Data Table on US – Market size and forecast 2022-2027 ($ million)
- Exhibit 93: Chart on US – Year-over-year growth 2022-2027 (%)
- Exhibit 94: Data Table on US – Year-over-year growth 2022-2027 (%)
- 9.8 China – Market size and forecast 2022-2027
- Exhibit 95: Chart on China – Market size and forecast 2022-2027 ($ million)
- Exhibit 96: Data Table on China – Market size and forecast 2022-2027 ($ million)
- Exhibit 97: Chart on China – Year-over-year growth 2022-2027 (%)
- Exhibit 98: Data Table on China – Year-over-year growth 2022-2027 (%)
- 9.9 Germany – Market size and forecast 2022-2027
- Exhibit 99: Chart on Germany – Market size and forecast 2022-2027 ($ million)
- Exhibit 100: Data Table on Germany – Market size and forecast 2022-2027 ($ million)
- Exhibit 101: Chart on Germany – Year-over-year growth 2022-2027 (%)
- Exhibit 102: Data Table on Germany – Year-over-year growth 2022-2027 (%)
- 9.10 Canada – Market size and forecast 2022-2027
- Exhibit 103: Chart on Canada – Market size and forecast 2022-2027 ($ million)
- Exhibit 104: Data Table on Canada – Market size and forecast 2022-2027 ($ million)
- Exhibit 105: Chart on Canada – Year-over-year growth 2022-2027 (%)
- Exhibit 106: Data Table on Canada – Year-over-year growth 2022-2027 (%)
- 9.11 UK – Market size and forecast 2022-2027
- Exhibit 107: Chart on UK – Market size and forecast 2022-2027 ($ million)
- Exhibit 108: Data Table on UK – Market size and forecast 2022-2027 ($ million)
- Exhibit 109: Chart on UK – Year-over-year growth 2022-2027 (%)
- Exhibit 110: Data Table on UK – Year-over-year growth 2022-2027 (%)
- 9.12 Market opportunity by geography
- Exhibit 111: Market opportunity by geography ($ million)
- Exhibit 112: Data Tables on Market opportunity by geography ($ million)
10 Drivers, Challenges, and Trends
- 10.3 Impact of drivers and challenges
- Exhibit 113: Impact of drivers and challenges in 2022 and 2027
11 Vendor Landscape
- 11.2 Vendor landscape
- Exhibit 114: Overview on Criticality of inputs and Factors of differentiation
- 11.3 Landscape disruption
- Exhibit 115: Overview on factors of disruption
- 11.4 Industry risks
- Exhibit 116: Impact of key risks on business
12 Vendor Analysis
- 12.1 Vendors covered
- Exhibit 117: Vendors covered
- 12.2 Market positioning of vendors
- Exhibit 118: Matrix on vendor position and classification
- 12.3 AcXys Technologies
- Exhibit 119: AcXys Technologies – Overview
- Exhibit 120: AcXys Technologies – Product / Service
- Exhibit 121: AcXys Technologies – Key offerings
- 12.4 Adtec RF
- Exhibit 122: Adtec RF – Overview
- Exhibit 123: Adtec RF – Product / Service
- Exhibit 124: Adtec RF – Key offerings
- 12.5 Advanced Plasma Solutions
- Exhibit 125: Advanced Plasma Solutions – Overview
- Exhibit 126: Advanced Plasma Solutions – Product / Service
- Exhibit 127: Advanced Plasma Solutions – Key offerings
- 12.6 Apyx Medical Corp.
- Exhibit 128: Apyx Medical Corp. – Overview
- Exhibit 129: Apyx Medical Corp. – Business segments
- Exhibit 130: Apyx Medical Corp. – Key offerings
- Exhibit 131: Apyx Medical Corp. – Segment focus
- 12.7 CINOGY System GmbH
- Exhibit 132: CINOGY System GmbH – Overview
- Exhibit 133: CINOGY System GmbH – Product / Service
- Exhibit 134: CINOGY System GmbH – Key offerings
- 12.8 Coating Plasma Innovation
- Exhibit 135: Coating Plasma Innovation – Overview
- Exhibit 136: Coating Plasma Innovation – Product / Service
- Exhibit 137: Coating Plasma Innovation – Key offerings
- 12.9 Europlasma NV
- Exhibit 138: Europlasma NV – Overview
- Exhibit 139: Europlasma NV – Product / Service
- Exhibit 140: Europlasma NV – Key offerings
- 12.10 MPG SA
- Exhibit 141: MPG SA – Overview
- Exhibit 142: MPG SA – Product / Service
- Exhibit 143: MPG SA – Key offerings
- 12.11 Neoplas GmbH
- Exhibit 144: Neoplas GmbH – Overview
- Exhibit 145: Neoplas GmbH – Product / Service
- Exhibit 146: Neoplas GmbH – Key offerings
- 12.12 Nordson Corp.
- Exhibit 147: Nordson Corp. – Overview
- Exhibit 148: Nordson Corp. – Business segments
- Exhibit 149: Nordson Corp. – Key news
- Exhibit 150: Nordson Corp. – Key offerings
- Exhibit 151: Nordson Corp. – Segment focus
- 12.13 Plasmatreat GmbH
- Exhibit 152: Plasmatreat GmbH – Overview
- Exhibit 153: Plasmatreat GmbH – Product / Service
- Exhibit 154: Plasmatreat GmbH – Key offerings
- 12.14 Tantec AS
- Exhibit 155: Tantec AS – Overview
- Exhibit 156: Tantec AS – Product / Service
- Exhibit 157: Tantec AS – Key offerings
- 12.15 TDK Corp.
- Exhibit 158: TDK Corp. – Overview
- Exhibit 159: TDK Corp. – Business segments
- Exhibit 160: TDK Corp. – Key news
- Exhibit 161: TDK Corp. – Key offerings
- Exhibit 162: TDK Corp. – Segment focus
- 12.16 Terraplasma GmbH
- Exhibit 163: Terraplasma GmbH – Overview
- Exhibit 164: Terraplasma GmbH – Product / Service
- Exhibit 165: Terraplasma GmbH – Key offerings
- 12.17 US Medical Innovations LLC
- Exhibit 166: US Medical Innovations LLC – Overview
- Exhibit 167: US Medical Innovations LLC – Product / Service
- Exhibit 168: US Medical Innovations LLC – Key offerings
13 Appendix
- 13.1 Scope of the report
- 13.2 Inclusions and exclusions checklist
- Exhibit 169: Inclusions checklist
- Exhibit 170: Exclusions checklist
- 13.3 Currency conversion rates for US$
- Exhibit 171: Currency conversion rates for US$
- 13.4 Research methodology
- Exhibit 172: Research methodology
- Exhibit 173: Validation techniques employed for market sizing
- Exhibit 174: Information sources
- 13.5 List of abbreviations
- Exhibit 175: List of abbreviations
About Us
Technavio is a leading global technology research and advisory company. Their research and analysis focuses on emerging market trends and provides actionable insights to help businesses identify market opportunities and develop effective strategies to optimize their market positions. With over 500 specialized analysts, Technavio’s report library consists of more than 17,000 reports and counting, covering 800 technologies, spanning across 50 countries. Their client base consists of enterprises of all sizes, including more than 100 Fortune 500 companies. This growing client base relies on Technavio’s comprehensive coverage, extensive research, and actionable market insights to identify opportunities in existing and potential markets and assess their competitive positions within changing market scenarios.
Contact
Technavio Research
Jesse Maida
Media & Marketing Executive
US: +1 844 364 1100
UK: +44 203 893 3200
Email: [email protected]
Website: www.technavio.com
SOURCE Technavio
