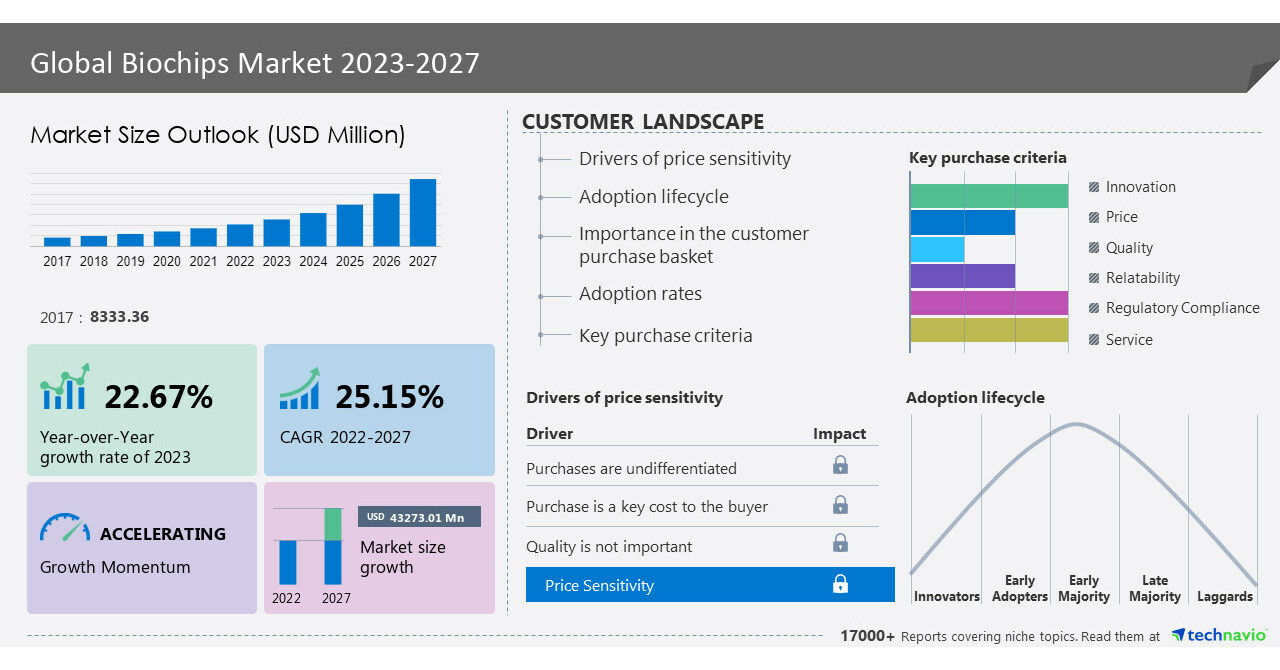
NEW YORK, May 22, 2023 /PRNewswire/ — The global biochips market size is estimated to grow by USD 43,273.01 million from 2022 to 2027, according to Technavio. The market is estimated to grow at a CAGR of 25.15% during the forecast period. North America is estimated to account for 41% of the market growth. This is due to the infrastructure, which has been developed for genomic and proteomic research in medicine. North America has recently been involved in a number of healthcare innovation projects and has also experienced rapid technological advancement, particularly in the fields of robotics and drug formulations. Hence, such factors drive regional growth during the forecast period. For more insights on the historic period (2017 to 2021) and forecast market size (2023 to 2027) – Request a sample report
What’s New?
- Special coverage on the Russia–Ukraine war; global inflation; recovery analysis from COVID-19; supply chain disruptions, global trade tensions; and risk of recession
- Global competitiveness and key competitor positions
- Market presence across multiple geographical footprints – Strong/Active/Niche/Trivial – buy the report!
Biochips Market – Segmentation Assessment
Segment Overview
This biochips market report extensively covers market segmentation by end-user (biotechnology and pharmaceutical companies, hospitals and diagnostics centers, and academic and research institutes), technology (microarrays and microfluidics), and geography (North America, Europe, APAC, Middle East and Africa, and South America).
- The market share growth by the biotechnology and pharmaceutical companies segment will be significant for overall market growth during the forecast period. Over the past decade, demand for biochips has increased significantly across a range of end-user industries, including biotechnology and pharmaceutical companies. Pharmaceutical and biotechnology companies use biochips for a wide range of purposes, such as drug discovery, genomics, proteomics, and diagnostics.
Get Insights on the market contribution of various segments including country and region wise, for historic period (2017 to 2021) and forecast period (2023 to 2027) – Download a Sample Report
Biochips Market – Market Dynamics
Key factor driving market growth
The growing use of personalized medicines notably drives market growth. Prior to the adoption of microarray biochips, drug discovery was considered to be a major component of operations in pharmaceutical companies but biotechnology companies have now begun to engage in some drug discovery-related activities. Microarray biochips shorten the drug pipeline timelines in drug discovery companies. Manufacturers are attempting to offer better and incredibly effective solutions for drug discovery in response to the rise in end users. Multi-parameter testing, chip technology miniaturization, and flexible array technology introduction are some of examples.
Leading trends influencing the market
The increasing use of chemical microarray technology is an emerging trend in the market. The study of genomics and proteomics makes extensive use of microarray technology and it has made it possible for several bioentities to function in parallel at the same time. All kinds of microarrays, including chemical microarrays, which are also known as chemical compound microarrays, protein microarrays, and DNA microarrays, are crucial for research and are in high demand. Hence, such trends fuel the market growth during the forecast period.
Major challenges hindering the market growth
High costs associated with biochip R&D are major challenges hindering market growth. An important challenge for the market is the high cost of biochip research and development. Large investments in R&D along with specialized manufacturing facilities and equipment are necessary for the development and commercialization of biochips. The cost of raw materials, such as reagents and oligonucleotides, can also be high because of these factors, biochips are expensive, which may limit their use and accessibility, particularly in places with limited resources.
In addition to the forecast, the report also highlights the key opportunities by analyzing drivers, trends, challenges for the market – Request a sample report!
What are the key data covered in this Biochips Market report?
- CAGR of the market during the forecast period
- Detailed information on factors that will drive the growth of the biochips market between 2023 and 2027
- Precise estimation of the size of the biochips market and its contribution to the market with a focus on the parent market
- Accurate predictions about upcoming trends and changes in consumer behavior
- Growth of the Biochips Market industry across North America, Europe, APAC, Middle East and Africa, and South America
- A thorough analysis of the market’s competitive landscape and detailed information about vendors
- Comprehensive analysis of factors that will challenge the growth of biochips market vendors
Gain instant access to 17,000+ market research reports.
Technavio’s SUBSCRIPTION platform
Related Reports:
The bio-detection market is estimated to grow at a CAGR of 12.96% between 2022 and 2027. The size of the market is forecast to increase by USD 12,270.05 million. This report extensively covers market segmentation by application (clinical, food and environmental, and defense), product (instruments, accessories and consumables, and reagents and media), and geography (North America, Europe, Asia, and Rest of World). The increasing incidence of infectious diseases is notably driving the biodetectors and accessories market growth.
The bio-based platform chemicals market size is expected to increase by USD 2.12 billion from 2020 to 2025, and the market’s growth momentum will accelerate at a CAGR of 10.78%. Furthermore, this report extensively covers bio-based platform chemicals market segmentation by chemical type (bio-1 4 diacids, bio-glycerol, bio-glutamic acid, bio-3-HPA, and bio-itaconic acid) and geography (APAC, Europe, North America, MEA, and South America). The volatility in crude oil prices is notably driving the bio-based platform chemicals market growth.
|
Biochips Market Scope |
|
|
Report Coverage |
Details |
|
Base year |
2022 |
|
Historic period |
2017-2021 |
|
Forecast period |
2023-2027 |
|
Growth momentum & CAGR |
Accelerate at a CAGR of 25.15% |
|
Market growth 2023-2027 |
USD 43,273.01 million |
|
Market structure |
Fragmented |
|
YoY growth 2022-2023 (%) |
22.67 |
|
Regional analysis |
North America, Europe, APAC, Middle East and Africa, and South America |
|
Performing market contribution |
North America at 41% |
|
Key countries |
US, China, Russia, UK, and France, Canada, Mexico, Italy,Spain, India, Japan, Australia, and South Korea |
|
Competitive landscape |
Leading Vendors, Market Positioning of Vendors, Competitive Strategies, and Industry Risks |
|
Key companies profiled |
Agilent Technologies Inc., Analis sa, Arrayit Corp., BICO Group AB, Bio Rad Laboratories Inc., Boao Bio Group Co. Ltd., Dynamic Biosensors GmbH, Eden Tech, Greiner Bio One International GmbH, Illumina Inc., INNOPSYS, Micronit BV, Nutcracker Therapeutics Inc., Perkin Elmer Inc., QIAGEN NV, Randox Laboratories Ltd., Sphere Fluidics Ltd., Takara Holdings Inc., IDEX Corp., and Thermo Fisher Scientific Inc. |
|
Market dynamics |
Parent market analysis, Market growth inducers and obstacles, Fast-growing and slow-growing segment analysis, COVID-19 impact and recovery analysis and future consumer dynamics, Market condition analysis for forecast period |
|
Customization purview |
If our report has not included the data that you are looking for, you can reach out to our analysts and get segments customized. |
Table of Contents
1 Executive Summary
- 1.1 Market overview
- Exhibit 01: Executive Summary – Chart on Market Overview
- Exhibit 02: Executive Summary – Data Table on Market Overview
- Exhibit 03: Executive Summary – Chart on Global Market Characteristics
- Exhibit 04: Executive Summary – Chart on Market by Geography
- Exhibit 05: Executive Summary – Chart on Market Segmentation by End-user
- Exhibit 06: Executive Summary – Chart on Market Segmentation by Technology
- Exhibit 07: Executive Summary – Chart on Incremental Growth
- Exhibit 08: Executive Summary – Data Table on Incremental Growth
- Exhibit 09: Executive Summary – Chart on Vendor Market Positioning
2 Market Landscape
- 2.1 Market ecosystem
- Exhibit 10: Parent market
- Exhibit 11: Market Characteristics
3 Market Sizing
- 3.1 Market definition
- Exhibit 12: Offerings of vendors included in the market definition
- 3.2 Market segment analysis
- Exhibit 13: Market segments
- 3.4 Market outlook: Forecast for 2022-2027
- Exhibit 14: Chart on Global – Market size and forecast 2022-2027 ($ million)
- Exhibit 15: Data Table on Global – Market size and forecast 2022-2027 ($ million)
- Exhibit 16: Chart on Global Market: Year-over-year growth 2022-2027 (%)
- Exhibit 17: Data Table on Global Market: Year-over-year growth 2022-2027 (%)
4 Historic Market Size
- 4.1 Global biochips market 2017 – 2021
- Exhibit 18: Historic Market Size – Data Table on Global biochips market 2017 – 2021 ($ million)
- 4.2 By End-user Segment Analysis 2017 – 2021
- Exhibit 19: Historic Market Size – By End-user Segment 2017 – 2021 ($ million)
- 4.3 By Technology Segment Analysis 2017 – 2021
- Exhibit 20: Historic Market Size – By Technology Segment 2017 – 2021 ($ million)
- 4.4 Geography Segment Analysis 2017 – 2021
- Exhibit 21: Historic Market Size – Geography Segment 2017 – 2021 ($ million)
- 4.5 Country Segment Analysis 2017 – 2021
- Exhibit 22: Historic Market Size – Country Segment 2017 – 2021 ($ million)
5 Five Forces Analysis
- 5.1 Five forces summary
- Exhibit 23: Five forces analysis – Comparison between 2022 and 2027
- 5.2 Bargaining power of buyers
- Exhibit 24: Chart on Bargaining power of buyers – Impact of key factors 2022 and 2027
- 5.3 Bargaining power of suppliers
- Exhibit 25: Bargaining power of suppliers – Impact of key factors in 2022 and 2027
- 5.4 Threat of new entrants
- Exhibit 26: Threat of new entrants – Impact of key factors in 2022 and 2027
- 5.5 Threat of substitutes
- Exhibit 27: Threat of substitutes – Impact of key factors in 2022 and 2027
- 5.6 Threat of rivalry
- Exhibit 28: Threat of rivalry – Impact of key factors in 2022 and 2027
- 5.7 Market condition
- Exhibit 29: Chart on Market condition – Five forces 2022 and 2027
6 Market Segmentation by End-user
- 6.1 Market segments
- Exhibit 30: Chart on End-user – Market share 2022-2027 (%)
- Exhibit 31: Data Table on End-user – Market share 2022-2027 (%)
- 6.2 Comparison by End-user
- Exhibit 32: Chart on Comparison by End-user
- Exhibit 33: Data Table on Comparison by End-user
- 6.3 Biotechnology and pharmaceutical companies – Market size and forecast 2022-2027
- Exhibit 34: Chart on Biotechnology and pharmaceutical companies – Market size and forecast 2022-2027 ($ million)
- Exhibit 35: Data Table on Biotechnology and pharmaceutical companies – Market size and forecast 2022-2027 ($ million)
- Exhibit 36: Chart on Biotechnology and pharmaceutical companies – Year-over-year growth 2022-2027 (%)
- Exhibit 37: Data Table on Biotechnology and pharmaceutical companies – Year-over-year growth 2022-2027 (%)
- 6.4 Hospitals and diagnostics centers – Market size and forecast 2022-2027
- Exhibit 38: Chart on Hospitals and diagnostics centers – Market size and forecast 2022-2027 ($ million)
- Exhibit 39: Data Table on Hospitals and diagnostics centers – Market size and forecast 2022-2027 ($ million)
- Exhibit 40: Chart on Hospitals and diagnostics centers – Year-over-year growth 2022-2027 (%)
- Exhibit 41: Data Table on Hospitals and diagnostics centers – Year-over-year growth 2022-2027 (%)
- 6.5 Academic and research institutes – Market size and forecast 2022-2027
- Exhibit 42: Chart on Academic and research institutes – Market size and forecast 2022-2027 ($ million)
- Exhibit 43: Data Table on Academic and research institutes – Market size and forecast 2022-2027 ($ million)
- Exhibit 44: Chart on Academic and research institutes – Year-over-year growth 2022-2027 (%)
- Exhibit 45: Data Table on Academic and research institutes – Year-over-year growth 2022-2027 (%)
- 6.6 Market opportunity by End-user
- Exhibit 46: Market opportunity by End-user ($ million)
- Exhibit 47: Data Table on Market opportunity by End-user ($ million)
7 Market Segmentation by Technology
- 7.1 Market segments
- Exhibit 48: Chart on Technology – Market share 2022-2027 (%)
- Exhibit 49: Data Table on Technology – Market share 2022-2027 (%)
- 7.2 Comparison by Technology
- Exhibit 50: Chart on Comparison by Technology
- Exhibit 51: Data Table on Comparison by Technology
- 7.3 Microarrays – Market size and forecast 2022-2027
- Exhibit 52: Chart on Microarrays – Market size and forecast 2022-2027 ($ million)
- Exhibit 53: Data Table on Microarrays – Market size and forecast 2022-2027 ($ million)
- Exhibit 54: Chart on Microarrays – Year-over-year growth 2022-2027 (%)
- Exhibit 55: Data Table on Microarrays – Year-over-year growth 2022-2027 (%)
- 7.4 Microfluidics – Market size and forecast 2022-2027
- Exhibit 56: Chart on Microfluidics – Market size and forecast 2022-2027 ($ million)
- Exhibit 57: Data Table on Microfluidics – Market size and forecast 2022-2027 ($ million)
- Exhibit 58: Chart on Microfluidics – Year-over-year growth 2022-2027 (%)
- Exhibit 59: Data Table on Microfluidics – Year-over-year growth 2022-2027 (%)
- 7.5 Market opportunity by Technology
- Exhibit 60: Market opportunity by Technology ($ million)
- Exhibit 61: Data Table on Market opportunity by Technology ($ million)
8 Customer Landscape
- 8.1 Customer landscape overview
- Exhibit 62: Analysis of price sensitivity, lifecycle, customer purchase basket, adoption rates, and purchase criteria
9 Geographic Landscape
- 9.1 Geographic segmentation
- Exhibit 63: Chart on Market share by geography 2022-2027 (%)
- Exhibit 64: Data Table on Market share by geography 2022-2027 (%)
- 9.2 Geographic comparison
- Exhibit 65: Chart on Geographic comparison
- Exhibit 66: Data Table on Geographic comparison
- 9.3 North America – Market size and forecast 2022-2027
- Exhibit 67: Chart on North America – Market size and forecast 2022-2027 ($ million)
- Exhibit 68: Data Table on North America – Market size and forecast 2022-2027 ($ million)
- Exhibit 69: Chart on North America – Year-over-year growth 2022-2027 (%)
- Exhibit 70: Data Table on North America – Year-over-year growth 2022-2027 (%)
- 9.4 Europe – Market size and forecast 2022-2027
- Exhibit 71: Chart on Europe – Market size and forecast 2022-2027 ($ million)
- Exhibit 72: Data Table on Europe – Market size and forecast 2022-2027 ($ million)
- Exhibit 73: Chart on Europe – Year-over-year growth 2022-2027 (%)
- Exhibit 74: Data Table on Europe – Year-over-year growth 2022-2027 (%)
- 9.5 APAC – Market size and forecast 2022-2027
- Exhibit 75: Chart on APAC – Market size and forecast 2022-2027 ($ million)
- Exhibit 76: Data Table on APAC – Market size and forecast 2022-2027 ($ million)
- Exhibit 77: Chart on APAC – Year-over-year growth 2022-2027 (%)
- Exhibit 78: Data Table on APAC – Year-over-year growth 2022-2027 (%)
- 9.6 Middle East and Africa – Market size and forecast 2022-2027
- Exhibit 79: Chart on Middle East and Africa – Market size and forecast 2022-2027 ($ million)
- Exhibit 80: Data Table on Middle East and Africa – Market size and forecast 2022-2027 ($ million)
- Exhibit 81: Chart on Middle East and Africa – Year-over-year growth 2022-2027 (%)
- Exhibit 82: Data Table on Middle East and Africa – Year-over-year growth 2022-2027 (%)
- 9.7 South America – Market size and forecast 2022-2027
- Exhibit 83: Chart on South America – Market size and forecast 2022-2027 ($ million)
- Exhibit 84: Data Table on South America – Market size and forecast 2022-2027 ($ million)
- Exhibit 85: Chart on South America – Year-over-year growth 2022-2027 (%)
- Exhibit 86: Data Table on South America – Year-over-year growth 2022-2027 (%)
- 9.8 US – Market size and forecast 2022-2027
- Exhibit 87: Chart on US – Market size and forecast 2022-2027 ($ million)
- Exhibit 88: Data Table on US – Market size and forecast 2022-2027 ($ million)
- Exhibit 89: Chart on US – Year-over-year growth 2022-2027 (%)
- Exhibit 90: Data Table on US – Year-over-year growth 2022-2027 (%)
- 9.9 China – Market size and forecast 2022-2027
- Exhibit 91: Chart on China – Market size and forecast 2022-2027 ($ million)
- Exhibit 92: Data Table on China – Market size and forecast 2022-2027 ($ million)
- Exhibit 93: Chart on China – Year-over-year growth 2022-2027 (%)
- Exhibit 94: Data Table on China – Year-over-year growth 2022-2027 (%)
- 9.10 Russia – Market size and forecast 2022-2027
- Exhibit 95: Chart on Russia – Market size and forecast 2022-2027 ($ million)
- Exhibit 96: Data Table on Russia – Market size and forecast 2022-2027 ($ million)
- Exhibit 97: Chart on Russia – Year-over-year growth 2022-2027 (%)
- Exhibit 98: Data Table on Russia – Year-over-year growth 2022-2027 (%)
- 9.11 UK – Market size and forecast 2022-2027
- Exhibit 99: Chart on UK – Market size and forecast 2022-2027 ($ million)
- Exhibit 100: Data Table on UK – Market size and forecast 2022-2027 ($ million)
- Exhibit 101: Chart on UK – Year-over-year growth 2022-2027 (%)
- Exhibit 102: Data Table on UK – Year-over-year growth 2022-2027 (%)
- 9.12 France – Market size and forecast 2022-2027
- Exhibit 103: Chart on France – Market size and forecast 2022-2027 ($ million)
- Exhibit 104: Data Table on France – Market size and forecast 2022-2027 ($ million)
- Exhibit 105: Chart on France – Year-over-year growth 2022-2027 (%)
- Exhibit 106: Data Table on France – Year-over-year growth 2022-2027 (%)
- 9.13 Market opportunity by geography
- Exhibit 107: Market opportunity by geography ($ million)
- Exhibit 108: Data Tables on Market opportunity by geography ($ million)
10 Drivers, Challenges, and Trends
- 10.3 Impact of drivers and challenges
- Exhibit 109: Impact of drivers and challenges in 2022 and 2027
11 Vendor Landscape
- 11.2 Vendor landscape
- Exhibit 110: Overview on Criticality of inputs and Factors of differentiation
- 11.3 Landscape disruption
- Exhibit 111: Overview on factors of disruption
- 11.4 Industry risks
- Exhibit 112: Impact of key risks on business
12 Vendor Analysis
- 12.1 Vendors covered
- Exhibit 113: Vendors covered
- 12.2 Market positioning of vendors
- Exhibit 114: Matrix on vendor position and classification
- 12.3 Agilent Technologies Inc.
- Exhibit 115: Agilent Technologies Inc. – Overview
- Exhibit 116: Agilent Technologies Inc. – Business segments
- Exhibit 117: Agilent Technologies Inc. – Key offerings
- Exhibit 118: Agilent Technologies Inc. – Segment focus
- 12.4 Arrayit Corp.
- Exhibit 119: Arrayit Corp. – Overview
- Exhibit 120: Arrayit Corp. – Product / Service
- Exhibit 121: Arrayit Corp. – Key offerings
- 12.5 BICO Group AB
- Exhibit 122: BICO Group AB – Overview
- Exhibit 123: BICO Group AB – Business segments
- Exhibit 124: BICO Group AB – Key offerings
- Exhibit 125: BICO Group AB – Segment focus
- 12.6 Bio Rad Laboratories Inc.
- Exhibit 126: Bio Rad Laboratories Inc. – Overview
- Exhibit 127: Bio Rad Laboratories Inc. – Business segments
- Exhibit 128: Bio Rad Laboratories Inc. – Key news
- Exhibit 129: Bio Rad Laboratories Inc. – Key offerings
- Exhibit 130: Bio Rad Laboratories Inc. – Segment focus
- 12.7 Boao Bio Group Co. Ltd.
- Exhibit 131: Boao Bio Group Co. Ltd. – Overview
- Exhibit 132: Boao Bio Group Co. Ltd. – Product / Service
- Exhibit 133: Boao Bio Group Co. Ltd. – Key offerings
- 12.8 Eden Tech
- Exhibit 134: Eden Tech – Overview
- Exhibit 135: Eden Tech – Product / Service
- Exhibit 136: Eden Tech – Key offerings
- 12.9 Greiner Bio One International GmbH
- Exhibit 137: Greiner Bio One International GmbH – Overview
- Exhibit 138: Greiner Bio One International GmbH – Product / Service
- Exhibit 139: Greiner Bio One International GmbH – Key offerings
- 12.10 Illumina Inc.
- Exhibit 140: Illumina Inc. – Overview
- Exhibit 141: Illumina Inc. – Business segments
- Exhibit 142: Illumina Inc. – Key news
- Exhibit 143: Illumina Inc. – Key offerings
- Exhibit 144: Illumina Inc. – Segment focus
- 12.11 INNOPSYS
- Exhibit 145: INNOPSYS – Overview
- Exhibit 146: INNOPSYS – Product / Service
- Exhibit 147: INNOPSYS – Key offerings
- 12.12 Nutcracker Therapeutics Inc.
- Exhibit 148: Nutcracker Therapeutics Inc. – Overview
- Exhibit 149: Nutcracker Therapeutics Inc. – Product / Service
- Exhibit 150: Nutcracker Therapeutics Inc. – Key offerings
- 12.13 Perkin Elmer Inc.
- Exhibit 151: Perkin Elmer Inc. – Overview
- Exhibit 152: Perkin Elmer Inc. – Business segments
- Exhibit 153: Perkin Elmer Inc. – Key news
- Exhibit 154: Perkin Elmer Inc. – Key offerings
- Exhibit 155: Perkin Elmer Inc. – Segment focus
- 12.14 QIAGEN NV
- Exhibit 156: QIAGEN NV – Overview
- Exhibit 157: QIAGEN NV – Product / Service
- Exhibit 158: QIAGEN NV – Key news
- Exhibit 159: QIAGEN NV – Key offerings
- 12.15 Sphere Fluidics Ltd.
- Exhibit 160: Sphere Fluidics Ltd. – Overview
- Exhibit 161: Sphere Fluidics Ltd. – Product / Service
- Exhibit 162: Sphere Fluidics Ltd. – Key offerings
- 12.16 Takara Holdings Inc.
- Exhibit 163: Takara Holdings Inc. – Overview
- Exhibit 164: Takara Holdings Inc. – Business segments
- Exhibit 165: Takara Holdings Inc. – Key offerings
- Exhibit 166: Takara Holdings Inc. – Segment focus
- 12.17 Thermo Fisher Scientific Inc.
- Exhibit 167: Thermo Fisher Scientific Inc. – Overview
- Exhibit 168: Thermo Fisher Scientific Inc. – Business segments
- Exhibit 169: Thermo Fisher Scientific Inc. – Key news
- Exhibit 170: Thermo Fisher Scientific Inc. – Key offerings
- Exhibit 171: Thermo Fisher Scientific Inc. – Segment focus
13 Appendix
- 13.1 Scope of the report
- 13.2 Inclusions and exclusions checklist
- Exhibit 172: Inclusions checklist
- Exhibit 173: Exclusions checklist
- 13.3 Currency conversion rates for US$
- Exhibit 174: Currency conversion rates for US$
- 13.4 Research methodology
- Exhibit 175: Research methodology
- Exhibit 176: Validation techniques employed for market sizing
- Exhibit 177: Information sources
- 13.5 List of abbreviations
- Exhibit 178: List of abbreviations
About Us
Technavio is a leading global technology research and advisory company. Their research and analysis focuses on emerging market trends and provides actionable insights to help businesses identify market opportunities and develop effective strategies to optimize their market positions. With over 500 specialized analysts, Technavio’s report library consists of more than 17,000 reports and counting, covering 800 technologies, spanning across 50 countries. Their client base consists of enterprises of all sizes, including more than 100 Fortune 500 companies. This growing client base relies on Technavio’s comprehensive coverage, extensive research, and actionable market insights to identify opportunities in existing and potential markets and assess their competitive positions within changing market scenarios.
Contact
Technavio Research
Jesse Maida
Media & Marketing Executive
US: +1 844 364 1100
UK: +44 203 893 3200
Email: [email protected]
Website: www.technavio.com/
SOURCE Technavio
