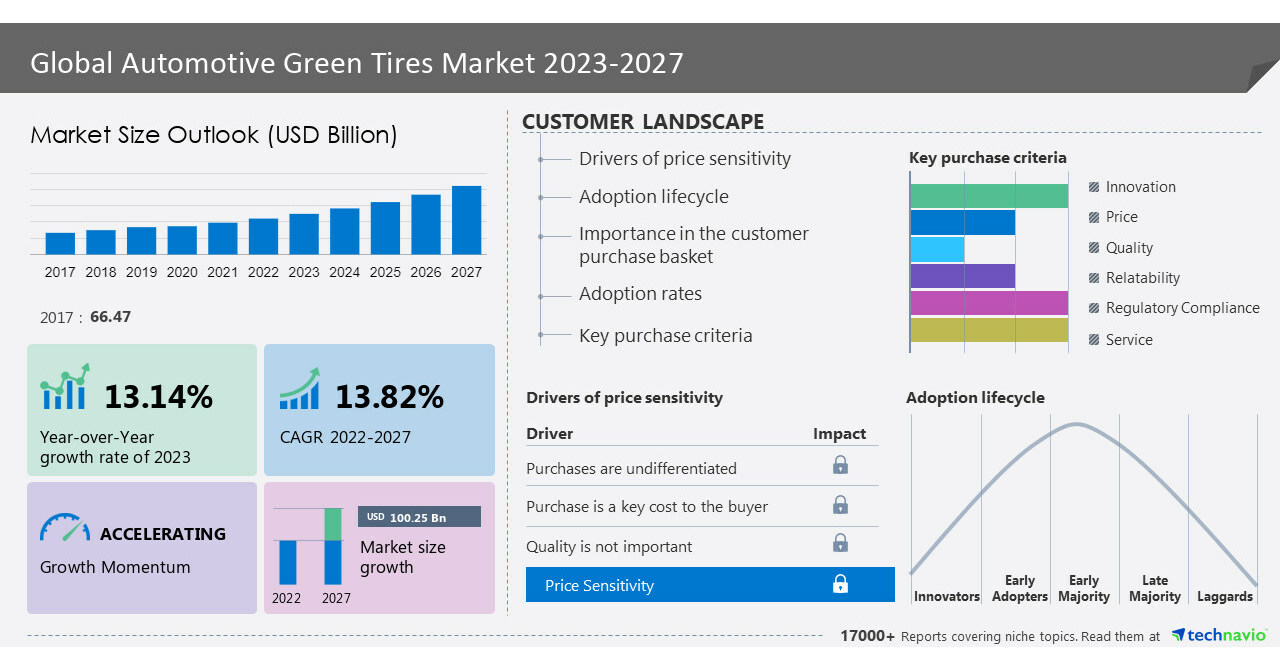
NEW YORK, May 11, 2023 /PRNewswire/ — Technavio has been monitoring the automotive green tires market and it is set to grow by USD 100.25 billion from 2022 to 2027, progressing at a CAGR of 13.82% during the forecast period. The report offers an up-to-date analysis regarding the current market scenario, latest trends and drivers, and the overall market environment. Download a Sample Report
Automotive Green Tires Market – Vendor Analysis
The global automotive green tires market is characterized by the presence of numerous large, small, and medium-sized manufacturers. Most of the large and established players have extensive sales and distribution networks globally, whereas most small players are concentrated in regional markets. Vendors compete based on parameters such as price, quality, technology, brand identity, and distribution. Rivalry among vendors is high.
The report analyzes the market’s competitive landscape and offers information on several market vendors, including Bridgestone Corp., DOUBLE STAR TIRE, Emerald Resilient Tyre Manufacturers Pvt. Ltd., Giti Tire, GRI Tires, Hankook Tire and Technology Co. Ltd., Maxxis International, Michelin Group, NEXEN TIRE Co. Ltd., Nokian Tyres Plc, Pirelli Tyre Spa, RPG Enterprises, Sailun Group Co. Ltd., Schaeffler AG, The Goodyear Tire and Rubber Co., Triangle Tyre Co. Ltd., Yokohama Tire Corp., Apollo Tyres Ltd., Balkrishna Industries Ltd., and Zhongce Rubber Group Co. Ltd.
For details on vendors and their offerings, request a sample report!
What’s New?
- Special coverage on the Russia–Ukraine war; global inflation; recovery analysis from COVID-19; supply chain disruptions, global trade tensions; and risk of recession
- Global competitiveness and key competitor positions
- Market presence across multiple geographical footprints – Strong/Active/Niche/Trivial - buy the report!
Geographic Analysis
- Europe is estimated to account for 32% of the global market growth during the forecast period. Western European countries such as Germany, the UK, France, Italy, and Spain dominate the market in terms of both the mounting rate and volume of green car tires in the region. Eastern European economies contribute significantly to the market in the region but the penetration rate is higher in Western countries. The EU is home to some of the world’s leading car manufacturers including Daimler, BMW, AUDI, Volkswagen Group, and Renault. These automakers offer green tires for their vehicles and Germany, Spain, and France are the three largest countries in the automotive green tires market in the European region.
Segment Analysis
This automotive green tires market report extensively covers market segmentation by application (passenger vehicles and commercial vehicles), type (radial tire and bias tire), and geography (Europe, North America, APAC, South America, and Middle East and Africa).
- The market share growth by the passenger vehicles segment will be significant for overall market growth during the forecast period. There is an increasing demand among vehicle owners for fuel-efficient, low rolling resistance, and high-performance tires, which are the main drivers of the passenger cars segment. Additionally, increasing passenger car sales in emerging and developing countries such as China, Japan, South Korea, India, and Southeast Asian countries will serve as market enablers for this segment. Hence, such factors drive the segment growth during the forecast period.
Automotive Green Tires Market 2023-2027: Market Dynamics
Key Drivers
The high affordability and low maintenance cost of automotive green tires are factors that are driving the automotive green tires market growth. Low initial cost, affordability, and low maintenance costs are some of the major drivers of the automotive green tires market and are driving the penetration of eco-friendly automotive tires in the global automotive market. Global vendors operating in the eco-friendly automotive tire market offer eco-friendly tires for each vehicle segment. Hence, such factors influence the growth of the automotive green tires market during the forecast period.
Major Trends
Developments in the field of automotive green tires are a key trend fueling the automotive green tires market growth. Growing concerns regarding pollution from automobile tires drive developments in the field of environmentally friendly automobile tires. Stringent emission standards also drive the development of innovative tire designs made from advanced, energy-efficient materials. Moreover, the affected markets are increasingly adopting the technologically sound processes required to design, develop and manufacture such tires. Hence, such trends influence the growth of the market during the forecast period.
Key Challenges
The high-cost pressures on tire vendors for competitive pricing are challenges impeding the automotive green tires market growth. The global automotive industry is in competition with an increasing number of technological innovations, along with which, the integration of automotive electronics into automobiles has made automobiles more technologically advanced, safer, and more energy efficient. These factors increase the competition in the global automotive market. Moreover, these factors have gradually increased the cost pressure on various players operating in the automotive value chain, and the same is evident in the global automotive green tires market which acts as a major constraint on the market. Hence, such challenges hinder the growth of the market during the forecast period.
To learn more about the impact of drivers, trends, and challenges on the market growth, request a sample report!
Automotive Green Tires Market 2023-2027: Key Highlights
- CAGR of the market during the forecast period 2023-2027
- Detailed information on factors that will assist automotive green tires market growth during the next five years
- Estimation of the automotive green tires market size and its contribution to the parent market
- Predictions on upcoming trends and changes in consumer behavior
- The growth of the automotive green tires market
- Analysis of the market’s competitive landscape and detailed information on vendors
- Comprehensive details of factors that will challenge the growth of automotive green tires market vendors
Gain instant access to 17,000+ market research reports.
Technavio’s SUBSCRIPTION platform
Related Reports:
The automotive airless tire market size is expected to increase to USD 251.06 million from 2021 to 2026, at a CAGR of 4.33%. Furthermore, this report extensively covers automotive airless tire market segmentation by material (rubber and plastic) and geography (APAC, Europe, North America, South America, and Middle East and Africa). The performance benefits of using airless tires is notably driving the automotive airless tire market growth.
The specialty tires market size is expected to increase by USD 10.86 billion from 2021 to 2026, and the market’s growth momentum will accelerate at a CAGR of 4.36%. This specialty tires market research report extensively covers market segmentations by the application(Mining and construction, aircraft, and others) and geography (Europe, North America, APAC, Middle East and Africa, and South America). One of the key factors driving the global specialty tires industry growth is the reducing prices of natural rubber, as it will reduce the overall production costs.
|
Automotive Green Tires Market Scope |
|
|
Report Coverage |
Details |
|
Base year |
2022 |
|
Historic period |
2017-2021 |
|
Forecast period |
2023-2027 |
|
Growth momentum & CAGR |
Accelerate at a CAGR of 13.82% |
|
Market growth 2023-2027 |
USD 100.25 billion |
|
Market structure |
Fragmented |
|
YoY growth 2022-2023(%) |
13.14 |
|
Regional analysis |
Europe, North America, APAC, South America, and Middle East and Africa |
|
Performing market contribution |
Europe at 32% |
|
Key countries |
US, China, Japan, Germany, and France |
|
Competitive landscape |
Leading Vendors, Market Positioning of Vendors, Competitive Strategies, and Industry Risks |
|
Key companies profiled |
Bridgestone Corp., DOUBLE STAR TIRE, Emerald Resilient Tyre Manufacturers Pvt. Ltd., Giti Tire, GRI Tires, Hankook Tire and Technology Co. Ltd., Maxxis International, Michelin Group, NEXEN TIRE Co. Ltd., Nokian Tyres Plc, Pirelli Tyre Spa, RPG Enterprises, Sailun Group Co. Ltd., Schaeffler AG, The Goodyear Tire and Rubber Co., Triangle Tyre Co. Ltd., Yokohama Tire Corp., Apollo Tyres Ltd., Balkrishna Industries Ltd., and Zhongce Rubber Group Co. Ltd. |
|
Market dynamics |
Parent market analysis, Market growth inducers and obstacles, Fast-growing and slow-growing segment analysis, COVID-19 impact and recovery analysis and future consumer dynamics, Market condition analysis for forecast period |
|
Customization purview |
If our report has not included the data that you are looking for, you can reach out to our analysts and get segments customized. |
Browse for Technavio’s Consumer Discretionary Market Reports
Table of Contents:
1 Executive Summary
- 1.1 Market overview
- Exhibit 01: Executive Summary – Chart on Market Overview
- Exhibit 02: Executive Summary – Data Table on Market Overview
- Exhibit 03: Executive Summary – Chart on Global Market Characteristics
- Exhibit 04: Executive Summary – Chart on Market by Geography
- Exhibit 05: Executive Summary – Chart on Market Segmentation by Application
- Exhibit 06: Executive Summary – Chart on Market Segmentation by Type
- Exhibit 07: Executive Summary – Chart on Incremental Growth
- Exhibit 08: Executive Summary – Data Table on Incremental Growth
- Exhibit 09: Executive Summary – Chart on Vendor Market Positioning
2 Market Landscape
- 2.1 Market ecosystem
- Exhibit 10: Parent market
- Exhibit 11: Market Characteristics
3 Market Sizing
- 3.1 Market definition
- Exhibit 12: Offerings of vendors included in the market definition
- 3.2 Market segment analysis
- Exhibit 13: Market segments
- 3.4 Market outlook: Forecast for 2022-2027
- Exhibit 14: Chart on Global – Market size and forecast 2022-2027 ($ billion)
- Exhibit 15: Data Table on Global – Market size and forecast 2022-2027 ($ billion)
- Exhibit 16: Chart on Global Market: Year-over-year growth 2022-2027 (%)
- Exhibit 17: Data Table on Global Market: Year-over-year growth 2022-2027 (%)
4 Historic Market Size
- 4.1 Global automotive green tires market 2017 – 2021
- Exhibit 18: Historic Market Size – Data Table on Global automotive green tires market 2017 – 2021 ($ billion)
- 4.2 Application Segment Analysis 2017 – 2021
- Exhibit 19: Historic Market Size – Application Segment 2017 – 2021 ($ billion)
- 4.3 Type Segment Analysis 2017 – 2021
- Exhibit 20: Historic Market Size – Type Segment 2017 – 2021 ($ billion)
- 4.4 Geography Segment Analysis 2017 – 2021
- Exhibit 21: Historic Market Size – Geography Segment 2017 – 2021 ($ billion)
- 4.5 Country Segment Analysis 2017 – 2021
- Exhibit 22: Historic Market Size – Country Segment 2017 – 2021 ($ billion)
5 Five Forces Analysis
- 5.1 Five forces summary
- Exhibit 23: Five forces analysis – Comparison between 2022 and 2027
- 5.2 Bargaining power of buyers
- Exhibit 24: Chart on Bargaining power of buyers – Impact of key factors 2022 and 2027
- 5.3 Bargaining power of suppliers
- Exhibit 25: Bargaining power of suppliers – Impact of key factors in 2022 and 2027
- 5.4 Threat of new entrants
- Exhibit 26: Threat of new entrants – Impact of key factors in 2022 and 2027
- 5.5 Threat of substitutes
- Exhibit 27: Threat of substitutes – Impact of key factors in 2022 and 2027
- 5.6 Threat of rivalry
- Exhibit 28: Threat of rivalry – Impact of key factors in 2022 and 2027
- 5.7 Market condition
- Exhibit 29: Chart on Market condition – Five forces 2022 and 2027
6 Market Segmentation by Application
- 6.1 Market segments
- Exhibit 30: Chart on Application – Market share 2022-2027 (%)
- Exhibit 31: Data Table on Application – Market share 2022-2027 (%)
- 6.2 Comparison by Application
- Exhibit 32: Chart on Comparison by Application
- Exhibit 33: Data Table on Comparison by Application
- 6.3 Passenger vehicles – Market size and forecast 2022-2027
- Exhibit 34: Chart on Passenger vehicles – Market size and forecast 2022-2027 ($ billion)
- Exhibit 35: Data Table on Passenger vehicles – Market size and forecast 2022-2027 ($ billion)
- Exhibit 36: Chart on Passenger vehicles – Year-over-year growth 2022-2027 (%)
- Exhibit 37: Data Table on Passenger vehicles – Year-over-year growth 2022-2027 (%)
- 6.4 Commercial vehicles – Market size and forecast 2022-2027
- Exhibit 38: Chart on Commercial vehicles – Market size and forecast 2022-2027 ($ billion)
- Exhibit 39: Data Table on Commercial vehicles – Market size and forecast 2022-2027 ($ billion)
- Exhibit 40: Chart on Commercial vehicles – Year-over-year growth 2022-2027 (%)
- Exhibit 41: Data Table on Commercial vehicles – Year-over-year growth 2022-2027 (%)
- 6.5 Market opportunity by Application
- Exhibit 42: Market opportunity by Application ($ billion)
- Exhibit 43: Data Table on Market opportunity by Application ($ billion)
7 Market Segmentation by Type
- 7.1 Market segments
- Exhibit 44: Chart on Type – Market share 2022-2027 (%)
- Exhibit 45: Data Table on Type – Market share 2022-2027 (%)
- 7.2 Comparison by Type
- Exhibit 46: Chart on Comparison by Type
- Exhibit 47: Data Table on Comparison by Type
- 7.3 Radial tire – Market size and forecast 2022-2027
- Exhibit 48: Chart on Radial tire – Market size and forecast 2022-2027 ($ billion)
- Exhibit 49: Data Table on Radial tire – Market size and forecast 2022-2027 ($ billion)
- Exhibit 50: Chart on Radial tire – Year-over-year growth 2022-2027 (%)
- Exhibit 51: Data Table on Radial tire – Year-over-year growth 2022-2027 (%)
- 7.4 Bias tire – Market size and forecast 2022-2027
- Exhibit 52: Chart on Bias tire – Market size and forecast 2022-2027 ($ billion)
- Exhibit 53: Data Table on Bias tire – Market size and forecast 2022-2027 ($ billion)
- Exhibit 54: Chart on Bias tire – Year-over-year growth 2022-2027 (%)
- Exhibit 55: Data Table on Bias tire – Year-over-year growth 2022-2027 (%)
- 7.5 Market opportunity by Type
- Exhibit 56: Market opportunity by Type ($ billion)
- Exhibit 57: Data Table on Market opportunity by Type ($ billion)
8 Customer Landscape
- 8.1 Customer landscape overview
- Exhibit 58: Analysis of price sensitivity, lifecycle, customer purchase basket, adoption rates, and purchase criteria
9 Geographic Landscape
- 9.1 Geographic segmentation
- Exhibit 59: Chart on Market share by geography 2022-2027 (%)
- Exhibit 60: Data Table on Market share by geography 2022-2027 (%)
- 9.2 Geographic comparison
- Exhibit 61: Chart on Geographic comparison
- Exhibit 62: Data Table on Geographic comparison
- 9.3 Europe – Market size and forecast 2022-2027
- Exhibit 63: Chart on Europe – Market size and forecast 2022-2027 ($ billion)
- Exhibit 64: Data Table on Europe – Market size and forecast 2022-2027 ($ billion)
- Exhibit 65: Chart on Europe – Year-over-year growth 2022-2027 (%)
- Exhibit 66: Data Table on Europe – Year-over-year growth 2022-2027 (%)
- 9.4 North America – Market size and forecast 2022-2027
- Exhibit 67: Chart on North America – Market size and forecast 2022-2027 ($ billion)
- Exhibit 68: Data Table on North America – Market size and forecast 2022-2027 ($ billion)
- Exhibit 69: Chart on North America – Year-over-year growth 2022-2027 (%)
- Exhibit 70: Data Table on North America – Year-over-year growth 2022-2027 (%)
- 9.5 APAC – Market size and forecast 2022-2027
- Exhibit 71: Chart on APAC – Market size and forecast 2022-2027 ($ billion)
- Exhibit 72: Data Table on APAC – Market size and forecast 2022-2027 ($ billion)
- Exhibit 73: Chart on APAC – Year-over-year growth 2022-2027 (%)
- Exhibit 74: Data Table on APAC – Year-over-year growth 2022-2027 (%)
- 9.6 South America – Market size and forecast 2022-2027
- Exhibit 75: Chart on South America – Market size and forecast 2022-2027 ($ billion)
- Exhibit 76: Data Table on South America – Market size and forecast 2022-2027 ($ billion)
- Exhibit 77: Chart on South America – Year-over-year growth 2022-2027 (%)
- Exhibit 78: Data Table on South America – Year-over-year growth 2022-2027 (%)
- 9.7 Middle East and Africa – Market size and forecast 2022-2027
- Exhibit 79: Chart on Middle East and Africa – Market size and forecast 2022-2027 ($ billion)
- Exhibit 80: Data Table on Middle East and Africa – Market size and forecast 2022-2027 ($ billion)
- Exhibit 81: Chart on Middle East and Africa – Year-over-year growth 2022-2027 (%)
- Exhibit 82: Data Table on Middle East and Africa – Year-over-year growth 2022-2027 (%)
- 9.8 US – Market size and forecast 2022-2027
- Exhibit 83: Chart on US – Market size and forecast 2022-2027 ($ billion)
- Exhibit 84: Data Table on US – Market size and forecast 2022-2027 ($ billion)
- Exhibit 85: Chart on US – Year-over-year growth 2022-2027 (%)
- Exhibit 86: Data Table on US – Year-over-year growth 2022-2027 (%)
- 9.9 Germany – Market size and forecast 2022-2027
- Exhibit 87: Chart on Germany – Market size and forecast 2022-2027 ($ billion)
- Exhibit 88: Data Table on Germany – Market size and forecast 2022-2027 ($ billion)
- Exhibit 89: Chart on Germany – Year-over-year growth 2022-2027 (%)
- Exhibit 90: Data Table on Germany – Year-over-year growth 2022-2027 (%)
- 9.10 China – Market size and forecast 2022-2027
- Exhibit 91: Chart on China – Market size and forecast 2022-2027 ($ billion)
- Exhibit 92: Data Table on China – Market size and forecast 2022-2027 ($ billion)
- Exhibit 93: Chart on China – Year-over-year growth 2022-2027 (%)
- Exhibit 94: Data Table on China – Year-over-year growth 2022-2027 (%)
- 9.11 Japan – Market size and forecast 2022-2027
- Exhibit 95: Chart on Japan – Market size and forecast 2022-2027 ($ billion)
- Exhibit 96: Data Table on Japan – Market size and forecast 2022-2027 ($ billion)
- Exhibit 97: Chart on Japan – Year-over-year growth 2022-2027 (%)
- Exhibit 98: Data Table on Japan – Year-over-year growth 2022-2027 (%)
- 9.12 France – Market size and forecast 2022-2027
- Exhibit 99: Chart on France – Market size and forecast 2022-2027 ($ billion)
- Exhibit 100: Data Table on France – Market size and forecast 2022-2027 ($ billion)
- Exhibit 101: Chart on France – Year-over-year growth 2022-2027 (%)
- Exhibit 102: Data Table on France – Year-over-year growth 2022-2027 (%)
- 9.13 Market opportunity by geography
- Exhibit 103: Market opportunity by geography ($ billion)
- Exhibit 104: Data Tables on Market opportunity by geography ($ billion)
10 Drivers, Challenges, and Trends
- 10.3 Impact of drivers and challenges
- Exhibit 105: Impact of drivers and challenges in 2022 and 2027
11 Vendor Landscape
- 11.2 Vendor landscape
- Exhibit 106: Overview on Criticality of inputs and Factors of differentiation
- 11.3 Landscape disruption
- Exhibit 107: Overview on factors of disruption
- 11.4 Industry risks
- Exhibit 108: Impact of key risks on business
12 Vendor Analysis
- 12.1 Vendors covered
- Exhibit 109: Vendors covered
- 12.2 Market positioning of vendors
- Exhibit 110: Matrix on vendor position and classification
- 12.3 Apollo Tyres Ltd.
- Exhibit 111: Apollo Tyres Ltd. – Overview
- Exhibit 112: Apollo Tyres Ltd. – Key offerings
- 12.4 Balkrishna Industries Ltd.
- Exhibit 113: Balkrishna Industries Ltd. – Overview
- Exhibit 114: Balkrishna Industries Ltd. – Product / Service
- Exhibit 115: Balkrishna Industries Ltd. – Key offerings
- 12.5 Bridgestone Corp.
- Exhibit 116: Bridgestone Corp. – Overview
- Exhibit 117: Bridgestone Corp. – Business segments
- Exhibit 118: Bridgestone Corp. – Key news
- Exhibit 119: Bridgestone Corp. – Key offerings
- Exhibit 120: Bridgestone Corp. – Segment focus
- 12.6 DOUBLE STAR TIRE
- Exhibit 121: DOUBLE STAR TIRE – Overview
- Exhibit 122: DOUBLE STAR TIRE – Product / Service
- Exhibit 123: DOUBLE STAR TIRE – Key offerings
- 12.7 Giti Tire
- Exhibit 124: Giti Tire – Overview
- Exhibit 125: Giti Tire – Product / Service
- Exhibit 126: Giti Tire – Key offerings
- 12.8 Hankook Tire and Technology Co. Ltd.
- Exhibit 127: Hankook Tire and Technology Co. Ltd. – Overview
- Exhibit 128: Hankook Tire and Technology Co. Ltd. – Product / Service
- Exhibit 129: Hankook Tire and Technology Co. Ltd. – Key offerings
- 12.9 Michelin Group
- Exhibit 130: Michelin Group – Overview
- Exhibit 131: Michelin Group – Business segments
- Exhibit 132: Michelin Group – Key news
- Exhibit 133: Michelin Group – Key offerings
- Exhibit 134: Michelin Group – Segment focus
- 12.10 NEXEN TIRE Co. Ltd.
- Exhibit 135: NEXEN TIRE Co. Ltd. – Overview
- Exhibit 136: NEXEN TIRE Co. Ltd. – Product / Service
- Exhibit 137: NEXEN TIRE Co. Ltd. – Key offerings
- 12.11 Nokian Tyres Plc
- Exhibit 138: Nokian Tyres Plc – Overview
- Exhibit 139: Nokian Tyres Plc – Business segments
- Exhibit 140: Nokian Tyres Plc – Key news
- Exhibit 141: Nokian Tyres Plc – Key offerings
- Exhibit 142: Nokian Tyres Plc – Segment focus
- 12.12 Pirelli Tyre Spa
- Exhibit 143: Pirelli Tyre Spa – Overview
- Exhibit 144: Pirelli Tyre Spa – Business segments
- Exhibit 145: Pirelli Tyre Spa – Key offerings
- Exhibit 146: Pirelli Tyre Spa – Segment focus
- 12.13 Sailun Group Co. Ltd.
- Exhibit 147: Sailun Group Co. Ltd. – Overview
- Exhibit 148: Sailun Group Co. Ltd. – Product / Service
- Exhibit 149: Sailun Group Co. Ltd. – Key offerings
- 12.14 Schaeffler AG
- Exhibit 150: Schaeffler AG – Overview
- Exhibit 151: Schaeffler AG – Business segments
- Exhibit 152: Schaeffler AG – Key offerings
- Exhibit 153: Schaeffler AG – Segment focus
- 12.15 The Goodyear Tire and Rubber Co.
- Exhibit 154: The Goodyear Tire and Rubber Co. – Overview
- Exhibit 155: The Goodyear Tire and Rubber Co. – Business segments
- Exhibit 156: The Goodyear Tire and Rubber Co. – Key news
- Exhibit 157: The Goodyear Tire and Rubber Co. – Key offerings
- Exhibit 158: The Goodyear Tire and Rubber Co. – Segment focus
- 12.16 Yokohama Tire Corp.
- Exhibit 159: Yokohama Tire Corp. – Overview
- Exhibit 160: Yokohama Tire Corp. – Product / Service
- Exhibit 161: Yokohama Tire Corp. – Key offerings
- 12.17 Zhongce Rubber Group Co. Ltd.
- Exhibit 162: Zhongce Rubber Group Co. Ltd. – Overview
- Exhibit 163: Zhongce Rubber Group Co. Ltd. – Product / Service
- Exhibit 164: Zhongce Rubber Group Co. Ltd. – Key offerings
13 Appendix
- 13.2 Inclusions and exclusions checklist
- Exhibit 165: Inclusions checklist
- Exhibit 166: Exclusions checklist
- 13.3 Currency conversion rates for US$
- Exhibit 167: Currency conversion rates for US$
- 13.4 Research methodology
- Exhibit 168: Research methodology
- Exhibit 169: Validation techniques employed for market sizing
- Exhibit 170: Information sources
- 13.5 List of abbreviations
- Exhibit 171: List of abbreviations
About Us
Technavio is a leading global technology research and advisory company. Their research and analysis focuses on emerging market trends and provides actionable insights to help businesses identify market opportunities and develop effective strategies to optimize their market positions. With over 500 specialized analysts, Technavio’s report library consists of more than 17,000 reports and counting, covering 800 technologies, spanning across 50 countries. Their client base consists of enterprises of all sizes, including more than 100 Fortune 500 companies. This growing client base relies on Technavio’s comprehensive coverage, extensive research, and actionable market insights to identify opportunities in existing and potential markets and assess their competitive positions within changing market scenarios.
Contact
Technavio Research
Jesse Maida
Media & Marketing Executive
US: +1 844 364 1100
UK: +44 203 893 3200
Email: [email protected]
Website: www.technavio.com/
SOURCE Technavio
