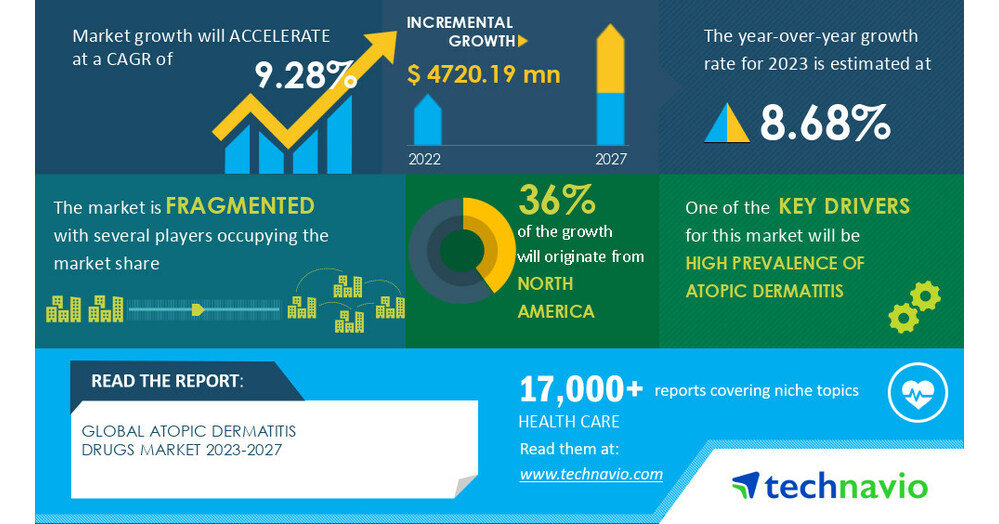
NEW YORK, May 31, 2023 /PRNewswire/ — The global atopic dermatitis drugs market size is estimated to grow by USD 4,720.19 million from 2022 to 2027, according to Technavio. The market is estimated to grow at a CAGR of 9.28%. North America will account for 36% of market growth during the forecast period. This growth is attributed to factors such as a high awareness about health care and the presence of an established medical infrastructure. Favorable reimbursement policies, rising number of drug approvals in the US, and increasing healthcare costs will also drive the regional market’s growth. Thus, the rising expenditure associated with healthcare is likely to increase the demand for atopic dermatitis drugs among patients in the region. For more insights on the historic period (2017 to 2021) and forecast market size (2023 to 2027) – Request a sample report
What’s New?
- Special coverage on the Russia–Ukraine war; global inflation; recovery analysis from COVID-19; supply chain disruptions, global trade tensions; and risk of recession
- Global competitiveness and key competitor positions
- Market presence across multiple geographical footprints – Strong/active/niche/trivial – buy the report!
Atopic dermatitis drugs market – Segmentation assessment
Segment overview
Technavio has segmented the market based on route of administration (oral, topical, and injectable), drug class (biologics, PDE4 inhibitors, corticosteroids, and calcineurin inhibitors), and geography (North America, Europe, Asia, and Rest of World (ROW)).
- The oral segment will account for a significant share of market growth during the forecast period. Factors such as the rising number of approvals of various oral drugs and their benefits are expected to drive the growth of the segment. For instance, in January 2022, the US FDA gave approval to AbbVie and Pfizer for Upadacitinib and Abrocitinib for the treatment of refractory moderate to severe atopic dermatitis. Such developments are likely to fuel the growth of the oral segment during the forecast period.
Insights on the market contribution of various segments, including country- and region-wise data, historic data (2017 to 2021), and forecast market size (2023 to 2027) – Download a sample report
Atopic dermatitis drugs market – Market dynamics
Key factor driving market growth
- The high prevalence of atopic dermatitis is driving market growth.
- Atopic dermatitis can be caused by various factors, including exposure to allergens, skin irritants, certain fabrics or soaps, stress, dry skin, and infections.
- Numerous medications are used to treat atopic dermatitis.
- In the US, approximately 18 million people have atopic dermatitis.
- Asia also has a large patient pool, with China, India, and Japan being the top three revenue contributors to the market in the region.
- Therefore, the high prevalence of atopic dermatitis is expected to fuel the growth of the global atopic dermatitis drugs market during the forecast period.
Leading trends influencing the market
- Geopolitical uncertainties are the primary trend in the market.
- Uncertainty in trade policy creates an unfavorable environment for suppliers.
- For instance, in China, the pharmaceutical landscape is changing rapidly, with the presence of large American pharmaceutical corporations.
- However, the trade dispute between the US and China has adversely affected the operations of many drug makers.
- The ongoing trade war is a major concern for manufacturers and suppliers engaged in the trade of raw materials, active pharmaceutical ingredients (APIs), and finished drugs.
- Such issues may have a negative impact on the growth of the global atopic dermatitis drugs market during the forecast period.
Major challenges hindering the market growth
- Loss of patents and patent expiry is challenging market growth.
- Due to the loss or expiration of patents, the market is flooded with generic drugs. As a result, large companies lose their competitive advantage and margins.
- Generic medicines are similar in quality, dosage form, strength, and potency to branded medicines and are available at lower prices.
- Therefore, the penetration of generic drugs is increasing.
- These factors will hinder the revenue growth prospects of market vendors during the forecast period.
Insights on market drivers, trends, & challenges, historic period (2017 to 2021), and forecast period (2023 to 2027) – Request a sample report!
What are the key data covered in this atopic dermatitis drugs market report?
- CAGR of the market during the forecast period
- Detailed information on factors that will drive the growth of the atopic dermatitis drugs market between 2023 and 2027
- Precise estimation of the size of the atopic dermatitis drugs market and its contribution to the parent market
- Accurate predictions about upcoming trends and changes in consumer behavior
- Growth of the atopic dermatitis drugs market across North America, Europe, Asia, and Rest of World (ROW)
- A thorough analysis of the market’s competitive landscape and detailed information about vendors
- Comprehensive analysis of factors that will challenge the growth of atopic dermatitis drugs market vendors
Gain instant access to 17,000+ market research reports.
Technavio’s SUBSCRIPTION platform
Related Reports:
The canine atopic dermatitis market size is expected to increase by USD 319.37 million from 2021 to 2026, and the market’s growth momentum will accelerate at a CAGR of 7.75%. This report extensively covers market segmentation by product (antihistamines, glucocorticoids, progestational compounds, and others) and geography (North America, Europe, Asia, and ROW).
The eczema therapeutics market size is expected to increase by USD 4.36 billion from 2021 to 2026, and the market’s growth momentum will accelerate at a CAGR of 9.6%. Furthermore, this report extensively covers indications (atopic dermatitis, contact dermatitis, and others) and geography (North America, Europe, Asia, and ROW).
|
Atopic Dermatitis Drugs Market Scope |
|
|
Report Coverage |
Details |
|
Base year |
2022 |
|
Historic period |
2017-2021 |
|
Forecast period |
2023-2027 |
|
Growth momentum & CAGR |
Accelerate at a CAGR of 9.28% |
|
Market growth 2023-2027 |
USD 4,720.19 million |
|
Market structure |
Fragmented |
|
YoY growth 2022-2023 (%) |
8.68 |
|
Regional analysis |
North America, Europe, Asia, and Rest of World (ROW) |
|
Performing market contribution |
North America at 36% |
|
Key countries |
US, Canada, Germany, UK, and China |
|
Competitive landscape |
Leading vendors, market positioning of vendors, competitive strategies, and industry risks |
|
Key companies profiled |
AbbVie Inc., Arcutis Biotherapeutics Inc., Asana BioSciences LLC, Astellas Pharma Inc., Bausch Health Co. Inc., Bayer AG, Bristol Myers Squibb Co., Dermavant Sciences Inc., Eli Lilly and Co., Evelo Biosciences Inc., Galderma SA, Incyte Corp., LEO Pharma AS, Maruho Co. Ltd., Novartis AG, Otsuka Holdings Co. Ltd., Pfizer Inc., Sanofi SA, Viatris Inc., and BiomX Inc. |
|
Market dynamics |
Parent market analysis, market growth inducers and obstacles, fast-growing and slow-growing segment analysis, COVID-19 impact and recovery analysis and future consumer dynamics, and market condition analysis for the forecast period |
|
Customization purview |
If our report has not included the data that you are looking for, you can reach out to our analysts and get segments customized. |
Browse for Technavio consumer discretionary market reports
Table of contents
1 Executive Summary
- 1.1 Market overview
- Exhibit 01: Executive Summary – Chart on Market Overview
- Exhibit 02: Executive Summary – Data Table on Market Overview
- Exhibit 03: Executive Summary – Chart on Global Market Characteristics
- Exhibit 04: Executive Summary – Chart on Market by Geography
- Exhibit 05: Executive Summary – Chart on Market Segmentation by Route of Administration
- Exhibit 06: Executive Summary – Chart on Market Segmentation by Drug Class
- Exhibit 07: Executive Summary – Chart on Incremental Growth
- Exhibit 08: Executive Summary – Data Table on Incremental Growth
- Exhibit 09: Executive Summary – Chart on Vendor Market Positioning
2 Market Landscape
- 2.1 Market ecosystem
- Exhibit 10: Parent market
- Exhibit 11: Market Characteristics
3 Market Sizing
- 3.1 Market definition
- Exhibit 12: Offerings of vendors included in the market definition
- 3.2 Market segment analysis
- Exhibit 13: Market segments
- 3.4 Market outlook: Forecast for 2022-2027
- Exhibit 14: Chart on Global – Market size and forecast 2022-2027 ($ million)
- Exhibit 15: Data Table on Global – Market size and forecast 2022-2027 ($ million)
- Exhibit 16: Chart on Global Market: Year-over-year growth 2022-2027 (%)
- Exhibit 17: Data Table on Global Market: Year-over-year growth 2022-2027 (%)
4 Historic Market Size
- 4.1 Global atopic dermatitis drugs market 2017 – 2021
- Exhibit 18: Historic Market Size – Data Table on global atopic dermatitis drugs market 2017 – 2021 ($ million)
- 4.2 Route of Administration Segment Analysis 2017 – 2021
- Exhibit 19: Historic Market Size – Route of Administration Segment 2017 – 2021 ($ million)
- 4.3 Drug Class Segment Analysis 2017 – 2021
- Exhibit 20: Historic Market Size – Drug Class Segment 2017 – 2021 ($ million)
- 4.4 Geography Segment Analysis 2017 – 2021
- Exhibit 21: Historic Market Size – Geography Segment 2017 – 2021 ($ million)
- 4.5 Country Segment Analysis 2017 – 2021
- Exhibit 22: Historic Market Size – Country Segment 2017 – 2021 ($ million)
5 Five Forces Analysis
- 5.1 Five forces summary
- Exhibit 23: Five forces analysis – Comparison between 2022 and 2027
- 5.2 Bargaining power of buyers
- Exhibit 24: Chart on Bargaining power of buyers – Impact of key factors 2022 and 2027
- 5.3 Bargaining power of suppliers
- Exhibit 25: Bargaining power of suppliers – Impact of key factors in 2022 and 2027
- 5.4 Threat of new entrants
- Exhibit 26: Threat of new entrants – Impact of key factors in 2022 and 2027
- 5.5 Threat of substitutes
- Exhibit 27: Threat of substitutes – Impact of key factors in 2022 and 2027
- 5.6 Threat of rivalry
- Exhibit 28: Threat of rivalry – Impact of key factors in 2022 and 2027
- 5.7 Market condition
- Exhibit 29: Chart on Market condition – Five forces 2022 and 2027
6 Market Segmentation by Route of Administration
- 6.1 Market segments
- Exhibit 30: Chart on Route of Administration – Market share 2022-2027 (%)
- Exhibit 31: Data Table on Route of Administration – Market share 2022-2027 (%)
- 6.2 Comparison by Route of Administration
- Exhibit 32: Chart on Comparison by Route of Administration
- Exhibit 33: Data Table on Comparison by Route of Administration
- 6.3 Oral – Market size and forecast 2022-2027
- Exhibit 34: Chart on Oral – Market size and forecast 2022-2027 ($ million)
- Exhibit 35: Data Table on Oral – Market size and forecast 2022-2027 ($ million)
- Exhibit 36: Chart on Oral – Year-over-year growth 2022-2027 (%)
- Exhibit 37: Data Table on Oral – Year-over-year growth 2022-2027 (%)
- 6.4 Topical – Market size and forecast 2022-2027
- Exhibit 38: Chart on Topical – Market size and forecast 2022-2027 ($ million)
- Exhibit 39: Data Table on Topical – Market size and forecast 2022-2027 ($ million)
- Exhibit 40: Chart on Topical – Year-over-year growth 2022-2027 (%)
- Exhibit 41: Data Table on Topical – Year-over-year growth 2022-2027 (%)
- 6.5 Injectable – Market size and forecast 2022-2027
- Exhibit 42: Chart on Injectable – Market size and forecast 2022-2027 ($ million)
- Exhibit 43: Data Table on Injectable – Market size and forecast 2022-2027 ($ million)
- Exhibit 44: Chart on Injectable – Year-over-year growth 2022-2027 (%)
- Exhibit 45: Data Table on Injectable – Year-over-year growth 2022-2027 (%)
- 6.6 Market opportunity by Route of Administration
- Exhibit 46: Market opportunity by Route of Administration ($ million)
- Exhibit 47: Data Table on Market opportunity by Route of Administration ($ million)
7 Market Segmentation by Drug Class
- 7.1 Market segments
- Exhibit 48: Chart on Drug Class – Market share 2022-2027 (%)
- Exhibit 49: Data Table on Drug Class – Market share 2022-2027 (%)
- 7.2 Comparison by Drug Class
- Exhibit 50: Chart on Comparison by Drug Class
- Exhibit 51: Data Table on Comparison by Drug Class
- 7.3 Biologics – Market size and forecast 2022-2027
- Exhibit 52: Chart on Biologics – Market size and forecast 2022-2027 ($ million)
- Exhibit 53: Data Table on Biologics – Market size and forecast 2022-2027 ($ million)
- Exhibit 54: Chart on Biologics – Year-over-year growth 2022-2027 (%)
- Exhibit 55: Data Table on Biologics – Year-over-year growth 2022-2027 (%)
- 7.4 PDE4 inhibitors – Market size and forecast 2022-2027
- Exhibit 56: Chart on PDE4 inhibitors – Market size and forecast 2022-2027 ($ million)
- Exhibit 57: Data Table on PDE4 inhibitors – Market size and forecast 2022-2027 ($ million)
- Exhibit 58: Chart on PDE4 inhibitors – Year-over-year growth 2022-2027 (%)
- Exhibit 59: Data Table on PDE4 inhibitors – Year-over-year growth 2022-2027 (%)
- 7.5 Corticosteroids – Market size and forecast 2022-2027
- Exhibit 60: Chart on Corticosteroids – Market size and forecast 2022-2027 ($ million)
- Exhibit 61: Data Table on Corticosteroids – Market size and forecast 2022-2027 ($ million)
- Exhibit 62: Chart on Corticosteroids – Year-over-year growth 2022-2027 (%)
- Exhibit 63: Data Table on Corticosteroids – Year-over-year growth 2022-2027 (%)
- 7.6 Calcineurin inhibitors – Market size and forecast 2022-2027
- Exhibit 64: Chart on Calcineurin inhibitors – Market size and forecast 2022-2027 ($ million)
- Exhibit 65: Data Table on Calcineurin inhibitors – Market size and forecast 2022-2027 ($ million)
- Exhibit 66: Chart on Calcineurin inhibitors – Year-over-year growth 2022-2027 (%)
- Exhibit 67: Data Table on Calcineurin inhibitors – Year-over-year growth 2022-2027 (%)
- 7.7 Market opportunity by Drug Class
- Exhibit 68: Market opportunity by Drug Class ($ million)
- Exhibit 69: Data Table on Market opportunity by Drug Class ($ million)
8 Customer Landscape
- 8.1 Customer landscape overview
- Exhibit 70: Analysis of price sensitivity, lifecycle, customer purchase basket, adoption rates, and purchase criteria
9 Geographic Landscape
- 9.1 Geographic segmentation
- Exhibit 71: Chart on Market share by geography 2022-2027 (%)
- Exhibit 72: Data Table on Market share by geography 2022-2027 (%)
- 9.2 Geographic comparison
- Exhibit 73: Chart on Geographic comparison
- Exhibit 74: Data Table on Geographic comparison
- 9.3 North America – Market size and forecast 2022-2027
- Exhibit 75: Chart on North America – Market size and forecast 2022-2027 ($ million)
- Exhibit 76: Data Table on North America – Market size and forecast 2022-2027 ($ million)
- Exhibit 77: Chart on North America – Year-over-year growth 2022-2027 (%)
- Exhibit 78: Data Table on North America – Year-over-year growth 2022-2027 (%)
- 9.4 Europe – Market size and forecast 2022-2027
- Exhibit 79: Chart on Europe – Market size and forecast 2022-2027 ($ million)
- Exhibit 80: Data Table on Europe – Market size and forecast 2022-2027 ($ million)
- Exhibit 81: Chart on Europe – Year-over-year growth 2022-2027 (%)
- Exhibit 82: Data Table on Europe – Year-over-year growth 2022-2027 (%)
- 9.5 Asia – Market size and forecast 2022-2027
- Exhibit 83: Chart on Asia – Market size and forecast 2022-2027 ($ million)
- Exhibit 84: Data Table on Asia – Market size and forecast 2022-2027 ($ million)
- Exhibit 85: Chart on Asia – Year-over-year growth 2022-2027 (%)
- Exhibit 86: Data Table on Asia – Year-over-year growth 2022-2027 (%)
- 9.6 Rest of World (ROW) – Market size and forecast 2022-2027
- Exhibit 87: Chart on Rest of World (ROW) – Market size and forecast 2022-2027 ($ million)
- Exhibit 88: Data Table on Rest of World (ROW) – Market size and forecast 2022-2027 ($ million)
- Exhibit 89: Chart on Rest of World (ROW) – Year-over-year growth 2022-2027 (%)
- Exhibit 90: Data Table on Rest of World (ROW) – Year-over-year growth 2022-2027 (%)
- 9.7 US – Market size and forecast 2022-2027
- Exhibit 91: Chart on US – Market size and forecast 2022-2027 ($ million)
- Exhibit 92: Data Table on US – Market size and forecast 2022-2027 ($ million)
- Exhibit 93: Chart on US – Year-over-year growth 2022-2027 (%)
- Exhibit 94: Data Table on US – Year-over-year growth 2022-2027 (%)
- 9.8 Canada – Market size and forecast 2022-2027
- Exhibit 95: Chart on Canada – Market size and forecast 2022-2027 ($ million)
- Exhibit 96: Data Table on Canada – Market size and forecast 2022-2027 ($ million)
- Exhibit 97: Chart on Canada – Year-over-year growth 2022-2027 (%)
- Exhibit 98: Data Table on Canada – Year-over-year growth 2022-2027 (%)
- 9.9 Germany – Market size and forecast 2022-2027
- Exhibit 99: Chart on Germany – Market size and forecast 2022-2027 ($ million)
- Exhibit 100: Data Table on Germany – Market size and forecast 2022-2027 ($ million)
- Exhibit 101: Chart on Germany – Year-over-year growth 2022-2027 (%)
- Exhibit 102: Data Table on Germany – Year-over-year growth 2022-2027 (%)
- 9.10 UK – Market size and forecast 2022-2027
- Exhibit 103: Chart on UK – Market size and forecast 2022-2027 ($ million)
- Exhibit 104: Data Table on UK – Market size and forecast 2022-2027 ($ million)
- Exhibit 105: Chart on UK – Year-over-year growth 2022-2027 (%)
- Exhibit 106: Data Table on UK – Year-over-year growth 2022-2027 (%)
- 9.11 China – Market size and forecast 2022-2027
- Exhibit 107: Chart on China – Market size and forecast 2022-2027 ($ million)
- Exhibit 108: Data Table on China – Market size and forecast 2022-2027 ($ million)
- Exhibit 109: Chart on China – Year-over-year growth 2022-2027 (%)
- Exhibit 110: Data Table on China – Year-over-year growth 2022-2027 (%)
- 9.12 Market opportunity by geography
- Exhibit 111: Market opportunity by geography ($ million)
- Exhibit 112: Data Tables on Market opportunity by geography ($ million)
10 Drivers, Challenges, and Trends
- 10.3 Impact of drivers and challenges
- Exhibit 113: Impact of drivers and challenges in 2022 and 2027
11 Vendor Landscape
- 11.2 Vendor landscape
- Exhibit 114: Overview on Criticality of inputs and Factors of differentiation
- 11.3 Landscape disruption
- Exhibit 115: Overview on factors of disruption
- 11.4 Industry risks
- Exhibit 116: Impact of key risks on business
12 Vendor Analysis
- 12.1 Vendors covered
- Exhibit 117: Vendors covered
- 12.2 Market positioning of vendors
- Exhibit 118: Matrix on vendor position and classification
- 12.3 AbbVie Inc.
- Exhibit 119: AbbVie Inc. – Overview
- Exhibit 120: AbbVie Inc. – Product / Service
- Exhibit 121: AbbVie Inc. – Key news
- Exhibit 122: AbbVie Inc. – Key offerings
- 12.4 Arcutis Biotherapeutics Inc.
- Exhibit 123: Arcutis Biotherapeutics Inc. – Overview
- Exhibit 124: Arcutis Biotherapeutics Inc. – Product / Service
- Exhibit 125: Arcutis Biotherapeutics Inc. – Key offerings
- 12.5 Bausch Health Co. Inc.
- Exhibit 126: Bausch Health Co. Inc. – Overview
- Exhibit 127: Bausch Health Co. Inc. – Business segments
- Exhibit 128: Bausch Health Co. Inc. – Key news
- Exhibit 129: Bausch Health Co. Inc. – Key offerings
- Exhibit 130: Bausch Health Co. Inc. – Segment focus
- 12.6 Bristol Myers Squibb Co.
- Exhibit 131: Bristol Myers Squibb Co. – Overview
- Exhibit 132: Bristol Myers Squibb Co. – Product / Service
- Exhibit 133: Bristol Myers Squibb Co. – Key news
- Exhibit 134: Bristol Myers Squibb Co. – Key offerings
- 12.7 Eli Lilly and Co.
- Exhibit 135: Eli Lilly and Co. – Overview
- Exhibit 136: Eli Lilly and Co. – Product / Service
- Exhibit 137: Eli Lilly and Co. – Key offerings
- 12.8 Evelo Biosciences Inc.
- Exhibit 138: Evelo Biosciences Inc. – Overview
- Exhibit 139: Evelo Biosciences Inc. – Product / Service
- Exhibit 140: Evelo Biosciences Inc. – Key offerings
- 12.9 Galderma SA
- Exhibit 141: Galderma SA – Overview
- Exhibit 142: Galderma SA – Product / Service
- Exhibit 143: Galderma SA – Key news
- Exhibit 144: Galderma SA – Key offerings
- 12.10 Incyte Corp.
- Exhibit 145: Incyte Corp. – Overview
- Exhibit 146: Incyte Corp. – Product / Service
- Exhibit 147: Incyte Corp. – Key offerings
- 12.11 LEO Pharma AS
- Exhibit 148: LEO Pharma AS – Overview
- Exhibit 149: LEO Pharma AS – Business segments
- Exhibit 150: LEO Pharma AS – Key offerings
- Exhibit 151: LEO Pharma AS – Segment focus
- 12.12 Maruho Co. Ltd.
- Exhibit 152: Maruho Co. Ltd. – Overview
- Exhibit 153: Maruho Co. Ltd. – Product / Service
- Exhibit 154: Maruho Co. Ltd. – Key offerings
- 12.13 Novartis AG
- Exhibit 155: Novartis AG – Overview
- Exhibit 156: Novartis AG – Business segments
- Exhibit 157: Novartis AG – Key offerings
- Exhibit 158: Novartis AG – Segment focus
- 12.14 Otsuka Holdings Co. Ltd.
- Exhibit 159: Otsuka Holdings Co. Ltd. – Overview
- Exhibit 160: Otsuka Holdings Co. Ltd. – Business segments
- Exhibit 161: Otsuka Holdings Co. Ltd. – Key offerings
- Exhibit 162: Otsuka Holdings Co. Ltd. – Segment focus
- 12.15 Pfizer Inc.
- Exhibit 163: Pfizer Inc. – Overview
- Exhibit 164: Pfizer Inc. – Product / Service
- Exhibit 165: Pfizer Inc. – Key news
- Exhibit 166: Pfizer Inc. – Key offerings
- 12.16 Sanofi SA
- Exhibit 167: Sanofi SA – Overview
- Exhibit 168: Sanofi SA – Business segments
- Exhibit 169: Sanofi SA – Key news
- Exhibit 170: Sanofi SA – Key offerings
- Exhibit 171: Sanofi SA – Segment focus
- 12.17 Viatris Inc.
- Exhibit 172: Viatris Inc. – Overview
- Exhibit 173: Viatris Inc. – Business segments
- Exhibit 174: Viatris Inc. – Key offerings
- Exhibit 175: Viatris Inc. – Segment focus
13 Appendix
- 13.2 Inclusions and exclusions checklist
- Exhibit 176: Inclusions checklist
- Exhibit 177: Exclusions checklist
- 13.3 Currency conversion rates for US$
- Exhibit 178: Currency conversion rates for US$
- 13.4 Research methodology
- Exhibit 179: Research methodology
- Exhibit 180: Validation techniques employed for market sizing
- Exhibit 181: Information sources
- 13.5 List of abbreviations
- Exhibit 182: List of abbreviations
About Us
Technavio is a leading global technology research and advisory company. Their research and analysis focus on emerging market trends and provide actionable insights to help businesses identify market opportunities and develop effective strategies to optimize their market positions. With over 500 specialized analysts, Technavio’s report library consists of more than 17,000 reports and counting, covering 800 technologies, spanning across 50 countries. Their client base consists of enterprises of all sizes, including more than 100 Fortune 500 companies. This growing client base relies on Technavio’s comprehensive coverage, extensive research, and actionable market insights to identify opportunities in existing and potential markets and assess their competitive positions within changing market scenarios.
Contact
Technavio Research
Jesse Maida
Media & Marketing Executive
US: +1 844 364 1100
UK: +44 203 893 3200
Email: [email protected]
Website: www.technavio.com/
SOURCE Technavio
