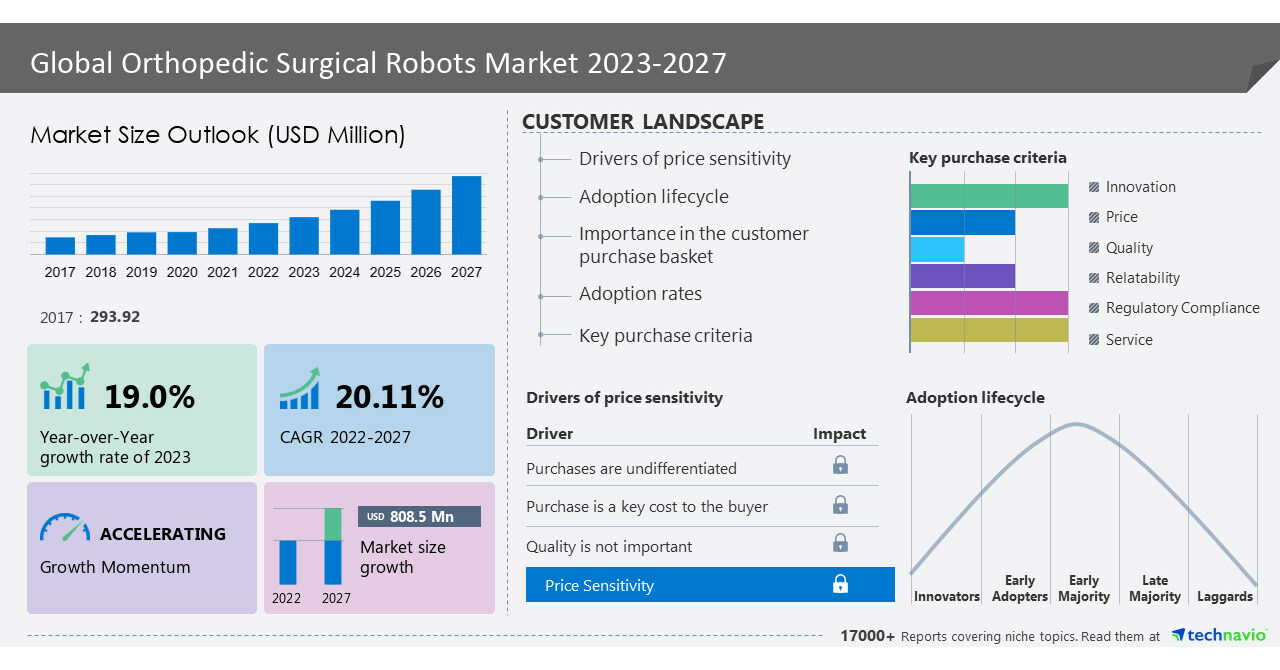
NEW YORK, June 13, 2023 /PRNewswire/ — The orthopedic surgical robots market is set to grow by USD 808.5 million from 2022 to 2027. The market is estimated to be progressing at a CAGR of 20.11% during the forecast period. The report offers an up-to-date analysis regarding the current global market scenario, the latest trends and drivers, and the overall market environment. Technological developments are the major factors that drive the growth of the global orthopedic surgical robot market. The miniaturization of sensors, which has happened over the years and is expected in the forecast period. Such miniaturization has reduced the cost of sensors and, in turn, that of robots. Also, there have been innovations in mechatronic components, which is in tandem with the increased prevalence of information and communications technology (ICT). Furthermore, the software that enhances the capabilities of robotic systems has also become more affordable for vendors. Since the price of sensors continues to fall, it is expected to lead to the development of more robots that can be used for orthopedic surgeries. Hence, such factors drive market growth during the forecast period. Here is an Exclusive report talking about Market scenarios with a historical period (2017-2021) and a forecast period (2023-2027). Download Sample Report in minutes!
The orthopedic surgical robots market covers the following areas:
The report on the orthopedic surgical robots market provides a holistic update, market size and forecast, trends, growth drivers, and challenges, as well as vendor analysis.
Orthopedic Surgical Robots Market 2023-2027 – Market Dynamics
An increase in minimally invasive surgical (MIS) procedures in orthopedics is an emerging trend in the global orthopedic surgical robot market growth. Minimal-invasive surgeries are a preferred procedure in the field of orthopedics, as this technique proves to be advantageous for the reconstruction of fractured bones, joint replacement, and realignment of bone extremities. They also result in less postoperative swelling than open techniques and reduce the risk of complications, pain, and recovery times, there is an increase in preference for such surgeries. Hence, such trends drive the market growth during the forecast period.
The presence of alternative treatment methods are challenges that may impede the global orthopedic surgical robots market. Some alternative therapies include high-intensity focused ultrasound (HIFU), laparoscopy, cryotherapy, and open surgeries. There are complexities involved in the use of robotic surgical systems. Such complexities coupled with the lack of skilled surgeons, force the existing healthcare fraternity to shift toward other popular alternative therapies to treat a wide variety of disorders and diseases. Hence, such challenges hinder market growth during the forecast period.
What’s New? –
- Special coverage on the Russia–Ukraine war; global inflation; recovery analysis from COVID-19; supply chain disruptions, global trade tensions; and risk of recession
- Global competitiveness and key competitor positions
- Market presence across multiple geographical footprints – Strong/Active/Niche/Trivial – Buy the report!
Orthopedic Surgical Robots Market 2023-2027: Market Segmentation
This orthopedic surgical robots market report extensively covers market segmentation by application (knee surgery and hip surgery), end-user (hospitals and ambulatory service centers), and geography (North America, Europe, Asia, and Rest of World (ROW)).
- The market share growth by the knee surgery segment will be significant for overall market growth during the forecast period. Partial knee replacement is a treatment option for adults who suffer from mid-stage osteoarthritis in the inner, top, or outer compartments of the knee. Thus, robotic surgery ensures that precision is consistently reproduced while performing partial knee resurfacing. Since they restrict any unnecessary motion of the knee by tracking motion through fiducial markers and infrared camera systems, which immediately stop the robot in case of any unnecessary motion, the knee orthopedic surgical robots offer the advantage of more precise surgeries. Hence, the growth of the knee segment is expected to contribute to the growth of the global orthopedic surgical robot market during the forecast period.
This report presents a detailed picture of the market by way of study, synthesis, and summation of data from multiple sources through an analysis of key parameters- View Sample Report
Companies Mentioned
- Asensus Surgical US Inc.
- Brainlab AG
- Corin Group PLC
- Curexo Inc.
- Galen Robotics Inc.
- GANYMED ROBOTICS SAS
- Intuitive Surgical Inc.
- Johnson and Johnson Services Inc.
- KUKA AG
- Medtronic Plc
- Nuvasive Inc.
- OrthAlign Corp.
- Renishaw Plc
- Shanghai MicroPort MedBot Group Co. Ltd.
- Siemens AG
- Smith and Nephew plc
- Stryker Corp.
- THINK Surgical Inc.
- Zimmer Biomet Holdings Inc.
- Globus Medical Inc.
Vendor Offerings
- Asensus Surgical US Inc. – The company offers an orthopedic surgical robot namely Senhance Surgical System.
- Brainlab AG – The company offers orthopedic surgical robot namely Criq Robotics.
- Corin Group PLC – The company offers an orthopedic surgical robot namely OMNIBotics robotic-assisted total knee replacement system.
Gain instant access to 17,000+ market research reports.
Technavio’s SUBSCRIPTION platform
Related Reports:
The orthopedic soft tissue repair devices market is estimated to grow at a CAGR of 11.05% between 2022 and 2027. The size of the market is forecast to increase by USD 5,633.11 million. This report extensively covers market segmentation by product type (fixation devices, tissue scaffold, and cell therapy-based), end-user (hospitals and clinics, ambulatory surgical centers, and physician’s offices), and geography (North America, Europe, Asia, and Rest of World). The rising geriatric population across the globe is notably driving market growth.
The orthopedic prosthetics market is estimated to grow at a CAGR of 5.55% between 2022 and 2027 and the size of the market is forecast to increase by USD 756.75 million. This report extensively covers market segmentation by product (lower extremity orthopedic prosthetics and upper extremity orthopedic prosthetics), technology (conventional, electric-powered, and hybrid) and geography (North America, Europe, Asia, and Rest of World (ROW)). Orthopedic prosthetics with technically advanced features are driving market growth, along with a wide range of conventional lower-extremity and upper-extremity prosthetics.
|
Orthopedic Surgical Robots Market Scope |
|
|
Report Coverage |
Details |
|
Base year |
2022 |
|
Historic period |
2017-2021 |
|
Forecast period |
2023-2027 |
|
Growth momentum & CAGR |
Accelerate at a CAGR of 20.11% |
|
Market growth 2023-2027 |
USD 808.5 million |
|
Market structure |
Fragmented |
|
YoY growth 2022-2023(%) |
19.0 |
|
Regional analysis |
North America, Europe, Asia, and Rest of World (ROW) |
|
Performing market contribution |
North America at 37% |
|
Key countries |
US, UK, Germany, China, and Japan |
|
Competitive landscape |
Leading Vendors, Market Positioning of Vendors, Competitive Strategies, and Industry Risks |
|
Key companies profiled |
Asensus Surgical US Inc., Brainlab AG, Corin Group PLC, Curexo Inc., Galen Robotics Inc., GANYMED ROBOTICS SAS, Intuitive Surgical Inc., Johnson and Johnson Services Inc., KUKA AG, Medtronic Plc, Nuvasive Inc., OrthAlign Corp., Renishaw Plc, Shanghai MicroPort MedBot Group Co. Ltd., Siemens AG, Smith and Nephew plc, Stryker Corp., THINK Surgical Inc., Zimmer Biomet Holdings Inc., and Globus Medical Inc. |
|
Market dynamics |
Parent market analysis, Market growth inducers and obstacles, Fast-growing and slow-growing segment analysis, COVID-19 impact and recovery analysis and future consumer dynamics, and Market condition analysis for the forecast period. |
|
Customization purview |
If our report has not included the data that you are looking for, you can reach out to our analysts and get segments customized. |
Key Topics Covered:
1 Executive Summary
- 1.1 Market overview
- Exhibit 01: Executive Summary – Chart on Market Overview
- Exhibit 02: Executive Summary – Data Table on Market Overview
- Exhibit 03: Executive Summary – Chart on Global Market Characteristics
- Exhibit 04: Executive Summary – Chart on Market by Geography
- Exhibit 05: Executive Summary – Chart on Market Segmentation by Application
- Exhibit 06: Executive Summary – Chart on Market Segmentation by End-user
- Exhibit 07: Executive Summary – Chart on Incremental Growth
- Exhibit 08: Executive Summary – Data Table on Incremental Growth
- Exhibit 09: Executive Summary – Chart on Vendor Market Positioning
2 Market Landscape
- 2.1 Market ecosystem
- Exhibit 10: Parent market
- Exhibit 11: Market Characteristics
3 Market Sizing
- 3.1 Market definition
- Exhibit 12: Offerings of vendors included in the market definition
- 3.2 Market segment analysis
- Exhibit 13: Market segments
- 3.4 Market outlook: Forecast for 2022-2027
- Exhibit 14: Chart on Global – Market size and forecast 2022-2027 ($ million)
- Exhibit 15: Data Table on Global – Market size and forecast 2022-2027 ($ million)
- Exhibit 16: Chart on Global Market: Year-over-year growth 2022-2027 (%)
- Exhibit 17: Data Table on Global Market: Year-over-year growth 2022-2027 (%)
4 Historic Market Size
- 4.1 Global orthopedic surgical robots market 2017 – 2021
- Exhibit 18: Historic Market Size – Data Table on global orthopedic surgical robots market 2017 – 2021 ($ million)
- 4.2 Application Segment Analysis 2017 – 2021
- Exhibit 19: Historic Market Size – Application Segment 2017 – 2021 ($ million)
- 4.3 End-user Segment Analysis 2017 – 2021
- Exhibit 20: Historic Market Size – End-user Segment 2017 – 2021 ($ million)
- 4.4 Geography Segment Analysis 2017 – 2021
- Exhibit 21: Historic Market Size – Geography Segment 2017 – 2021 ($ million)
- 4.5 Country Segment Analysis 2017 – 2021
- Exhibit 22: Historic Market Size – Country Segment 2017 – 2021 ($ million)
5 Five Forces Analysis
- 5.1 Five forces summary
- Exhibit 23: Five forces analysis – Comparison between 2022 and 2027
- 5.2 Bargaining power of buyers
- Exhibit 24: Chart on Bargaining power of buyers – Impact of key factors 2022 and 2027
- 5.3 Bargaining power of suppliers
- Exhibit 25: Bargaining power of suppliers – Impact of key factors in 2022 and 2027
- 5.4 Threat of new entrants
- Exhibit 26: Threat of new entrants – Impact of key factors in 2022 and 2027
- 5.5 Threat of substitutes
- Exhibit 27: Threat of substitutes – Impact of key factors in 2022 and 2027
- 5.6 Threat of rivalry
- Exhibit 28: Threat of rivalry – Impact of key factors in 2022 and 2027
- 5.7 Market condition
- Exhibit 29: Chart on Market condition – Five forces 2022 and 2027
6 Market Segmentation by Application
- 6.1 Market segments
- Exhibit 30: Chart on Application – Market share 2022-2027 (%)
- Exhibit 31: Data Table on Application – Market share 2022-2027 (%)
- 6.2 Comparison by Application
- Exhibit 32: Chart on Comparison by Application
- Exhibit 33: Data Table on Comparison by Application
- 6.3 Knee surgery – Market size and forecast 2022-2027
- Exhibit 34: Chart on Knee surgery – Market size and forecast 2022-2027 ($ million)
- Exhibit 35: Data Table on Knee surgery – Market size and forecast 2022-2027 ($ million)
- Exhibit 36: Chart on Knee surgery – Year-over-year growth 2022-2027 (%)
- Exhibit 37: Data Table on Knee surgery – Year-over-year growth 2022-2027 (%)
- 6.4 Hip surgery – Market size and forecast 2022-2027
- Exhibit 38: Chart on Hip surgery – Market size and forecast 2022-2027 ($ million)
- Exhibit 39: Data Table on Hip surgery – Market size and forecast 2022-2027 ($ million)
- Exhibit 40: Chart on Hip surgery – Year-over-year growth 2022-2027 (%)
- Exhibit 41: Data Table on Hip surgery – Year-over-year growth 2022-2027 (%)
- 6.5 Market opportunity by Application
- Exhibit 42: Market opportunity by Application ($ million)
- Exhibit 43: Data Table on Market opportunity by Application ($ million)
7 Market Segmentation by End-user
- 7.1 Market segments
- Exhibit 44: Chart on End-user – Market share 2022-2027 (%)
- Exhibit 45: Data Table on End-user – Market share 2022-2027 (%)
- 7.2 Comparison by End-user
- Exhibit 46: Chart on Comparison by End-user
- Exhibit 47: Data Table on Comparison by End-user
- 7.3 Hospitals – Market size and forecast 2022-2027
- Exhibit 48: Chart on Hospitals – Market size and forecast 2022-2027 ($ million)
- Exhibit 49: Data Table on Hospitals – Market size and forecast 2022-2027 ($ million)
- Exhibit 50: Chart on Hospitals – Year-over-year growth 2022-2027 (%)
- Exhibit 51: Data Table on Hospitals – Year-over-year growth 2022-2027 (%)
- 7.4 Ambulatory service centers – Market size and forecast 2022-2027
- Exhibit 52: Chart on Ambulatory service centers – Market size and forecast 2022-2027 ($ million)
- Exhibit 53: Data Table on Ambulatory service centers – Market size and forecast 2022-2027 ($ million)
- Exhibit 54: Chart on Ambulatory service centers – Year-over-year growth 2022-2027 (%)
- Exhibit 55: Data Table on Ambulatory service centers – Year-over-year growth 2022-2027 (%)
- 7.5 Market opportunity by End-user
- Exhibit 56: Market opportunity by End-user ($ million)
- Exhibit 57: Data Table on Market opportunity by End-user ($ million)
8 Customer Landscape
- 8.1 Customer landscape overview
- Exhibit 58: Analysis of price sensitivity, lifecycle, customer purchase basket, adoption rates, and purchase criteria
9 Geographic Landscape
- 9.1 Geographic segmentation
- Exhibit 59: Chart on Market share by geography 2022-2027 (%)
- Exhibit 60: Data Table on Market share by geography 2022-2027 (%)
- 9.2 Geographic comparison
- Exhibit 61: Chart on Geographic comparison
- Exhibit 62: Data Table on Geographic comparison
- 9.3 North America – Market size and forecast 2022-2027
- Exhibit 63: Chart on North America – Market size and forecast 2022-2027 ($ million)
- Exhibit 64: Data Table on North America – Market size and forecast 2022-2027 ($ million)
- Exhibit 65: Chart on North America – Year-over-year growth 2022-2027 (%)
- Exhibit 66: Data Table on North America – Year-over-year growth 2022-2027 (%)
- 9.4 Europe – Market size and forecast 2022-2027
- Exhibit 67: Chart on Europe – Market size and forecast 2022-2027 ($ million)
- Exhibit 68: Data Table on Europe – Market size and forecast 2022-2027 ($ million)
- Exhibit 69: Chart on Europe – Year-over-year growth 2022-2027 (%)
- Exhibit 70: Data Table on Europe – Year-over-year growth 2022-2027 (%)
- 9.5 Asia – Market size and forecast 2022-2027
- Exhibit 71: Chart on Asia – Market size and forecast 2022-2027 ($ million)
- Exhibit 72: Data Table on Asia – Market size and forecast 2022-2027 ($ million)
- Exhibit 73: Chart on Asia – Year-over-year growth 2022-2027 (%)
- Exhibit 74: Data Table on Asia – Year-over-year growth 2022-2027 (%)
- 9.6 Rest of World (ROW) – Market size and forecast 2022-2027
- Exhibit 75: Chart on Rest of World (ROW) – Market size and forecast 2022-2027 ($ million)
- Exhibit 76: Data Table on Rest of World (ROW) – Market size and forecast 2022-2027 ($ million)
- Exhibit 77: Chart on Rest of World (ROW) – Year-over-year growth 2022-2027 (%)
- Exhibit 78: Data Table on Rest of World (ROW) – Year-over-year growth 2022-2027 (%)
- 9.7 US – Market size and forecast 2022-2027
- Exhibit 79: Chart on US – Market size and forecast 2022-2027 ($ million)
- Exhibit 80: Data Table on US – Market size and forecast 2022-2027 ($ million)
- Exhibit 81: Chart on US – Year-over-year growth 2022-2027 (%)
- Exhibit 82: Data Table on US – Year-over-year growth 2022-2027 (%)
- 9.8 UK – Market size and forecast 2022-2027
- Exhibit 83: Chart on UK – Market size and forecast 2022-2027 ($ million)
- Exhibit 84: Data Table on UK – Market size and forecast 2022-2027 ($ million)
- Exhibit 85: Chart on UK – Year-over-year growth 2022-2027 (%)
- Exhibit 86: Data Table on UK – Year-over-year growth 2022-2027 (%)
- 9.9 Germany – Market size and forecast 2022-2027
- Exhibit 87: Chart on Germany – Market size and forecast 2022-2027 ($ million)
- Exhibit 88: Data Table on Germany – Market size and forecast 2022-2027 ($ million)
- Exhibit 89: Chart on Germany – Year-over-year growth 2022-2027 (%)
- Exhibit 90: Data Table on Germany – Year-over-year growth 2022-2027 (%)
- 9.10 China – Market size and forecast 2022-2027
- Exhibit 91: Chart on China – Market size and forecast 2022-2027 ($ million)
- Exhibit 92: Data Table on China – Market size and forecast 2022-2027 ($ million)
- Exhibit 93: Chart on China – Year-over-year growth 2022-2027 (%)
- Exhibit 94: Data Table on China – Year-over-year growth 2022-2027 (%)
- 9.11 Japan – Market size and forecast 2022-2027
- Exhibit 95: Chart on Japan – Market size and forecast 2022-2027 ($ million)
- Exhibit 96: Data Table on Japan – Market size and forecast 2022-2027 ($ million)
- Exhibit 97: Chart on Japan – Year-over-year growth 2022-2027 (%)
- Exhibit 98: Data Table on Japan – Year-over-year growth 2022-2027 (%)
- 9.12 Market opportunity by geography
- Exhibit 99: Market opportunity by geography ($ million)
- Exhibit 100: Data Tables on Market opportunity by geography ($ million)
10 Drivers, Challenges, and Trends
- 10.3 Impact of drivers and challenges
- Exhibit 101: Impact of drivers and challenges in 2022 and 2027
11 Vendor Landscape
- 11.2 Vendor landscape
- Exhibit 102: Overview on Criticality of inputs and Factors of differentiation
- 11.3 Landscape disruption
- Exhibit 103: Overview on factors of disruption
- 11.4 Industry risks
- Exhibit 104: Impact of key risks on business
12 Vendor Analysis
- 12.1 Vendors covered
- Exhibit 105: Vendors covered
- 12.2 Market positioning of vendors
- Exhibit 106: Matrix on vendor position and classification
- 12.3 Asensus Surgical US Inc.
- Exhibit 107: Asensus Surgical US Inc. – Overview
- Exhibit 108: Asensus Surgical US Inc. – Product / Service
- Exhibit 109: Asensus Surgical US Inc. – Key offerings
- 12.4 Brainlab AG
- Exhibit 110: Brainlab AG – Overview
- Exhibit 111: Brainlab AG – Product / Service
- Exhibit 112: Brainlab AG – Key offerings
- 12.5 Corin Group PLC
- Exhibit 113: Corin Group PLC – Overview
- Exhibit 114: Corin Group PLC – Product / Service
- Exhibit 115: Corin Group PLC – Key offerings
- 12.6 Curexo Inc.
- Exhibit 116: Curexo Inc. – Overview
- Exhibit 117: Curexo Inc. – Product / Service
- Exhibit 118: Curexo Inc. – Key offerings
- 12.7 Galen Robotics Inc.
- Exhibit 119: Galen Robotics Inc. – Overview
- Exhibit 120: Galen Robotics Inc. – Product / Service
- Exhibit 121: Galen Robotics Inc. – Key offerings
- 12.8 Globus Medical Inc.
- Exhibit 122: Globus Medical Inc. – Overview
- Exhibit 123: Globus Medical Inc. – Product / Service
- Exhibit 124: Globus Medical Inc. – Key offerings
- 12.9 Intuitive Surgical Inc.
- Exhibit 125: Intuitive Surgical Inc. – Overview
- Exhibit 126: Intuitive Surgical Inc. – Product / Service
- Exhibit 127: Intuitive Surgical Inc. – Key offerings
- 12.10 Johnson and Johnson Services Inc.
- Exhibit 128: Johnson and Johnson Services Inc. – Overview
- Exhibit 129: Johnson and Johnson Services Inc. – Business segments
- Exhibit 130: Johnson and Johnson Services Inc. – Key news
- Exhibit 131: Johnson and Johnson Services Inc. – Key offerings
- Exhibit 132: Johnson and Johnson Services Inc. – Segment focus
- 12.11 Medtronic Plc
- Exhibit 133: Medtronic Plc – Overview
- Exhibit 134: Medtronic Plc – Business segments
- Exhibit 135: Medtronic Plc – Key news
- Exhibit 136: Medtronic Plc – Key offerings
- Exhibit 137: Medtronic Plc – Segment focus
- 12.12 Nuvasive Inc.
- Exhibit 138: Nuvasive Inc. – Overview
- Exhibit 139: Nuvasive Inc. – Business segments
- Exhibit 140: Nuvasive Inc. – Key news
- Exhibit 141: Nuvasive Inc. – Key offerings
- Exhibit 142: Nuvasive Inc. – Segment focus
- 12.13 Renishaw Plc
- Exhibit 143: Renishaw Plc – Overview
- Exhibit 144: Renishaw Plc – Business segments
- Exhibit 145: Renishaw Plc – Key offerings
- Exhibit 146: Renishaw Plc – Segment focus
- 12.14 Smith and Nephew plc
- Exhibit 147: Smith and Nephew plc – Overview
- Exhibit 148: Smith and Nephew plc – Business segments
- Exhibit 149: Smith and Nephew plc – Key news
- Exhibit 150: Smith and Nephew plc – Key offerings
- Exhibit 151: Smith and Nephew plc – Segment focus
- 12.15 Stryker Corp.
- Exhibit 152: Stryker Corp. – Overview
- Exhibit 153: Stryker Corp. – Business segments
- Exhibit 154: Stryker Corp. – Key news
- Exhibit 155: Stryker Corp. – Key offerings
- Exhibit 156: Stryker Corp. – Segment focus
- 12.16 THINK Surgical Inc.
- Exhibit 157: THINK Surgical Inc. – Overview
- Exhibit 158: THINK Surgical Inc. – Product / Service
- Exhibit 159: THINK Surgical Inc. – Key offerings
- 12.17 Zimmer Biomet Holdings Inc.
- Exhibit 160: Zimmer Biomet Holdings Inc. – Overview
- Exhibit 161: Zimmer Biomet Holdings Inc. – Business segments
- Exhibit 162: Zimmer Biomet Holdings Inc. – Key news
- Exhibit 163: Zimmer Biomet Holdings Inc. – Key offerings
- Exhibit 164: Zimmer Biomet Holdings Inc. – Segment focus
13 Appendix
- 13.1 Scope of the report
- 13.2 Inclusions and exclusions checklist
- Exhibit 165: Inclusions checklist
- Exhibit 166: Exclusions checklist
- 13.3 Currency conversion rates for US$
- Exhibit 167: Currency conversion rates for US$
- 13.4 Research methodology
- Exhibit 168: Research methodology
- Exhibit 169: Validation techniques employed for market sizing
- Exhibit 170: Information sources
- 13.5 List of abbreviations
- Exhibit 171: List of abbreviations
About Us
Technavio is a leading global technology research and advisory company. Their research and analysis focus on emerging market trends and provide actionable insights to help businesses identify market opportunities and develop effective strategies to optimize their market positions. With over 500 specialized analysts, Technavio’s report library consists of more than 17,000 reports and counting, covering 800 technologies, spanning 50 countries. Their client base consists of enterprises of all sizes, including more than 100 Fortune 500 companies. This growing client base relies on Technavio’s comprehensive coverage, extensive research, and actionable market insights to identify opportunities in existing and potential markets and assess their competitive positions within changing market scenarios.
Contact
Technavio Research
Jesse Maida
Media & Marketing Executive
US: +1 844 364 1100
UK: +44 203 893 3200
Email: [email protected]
Website: www.technavio.com/
SOURCE Technavio
