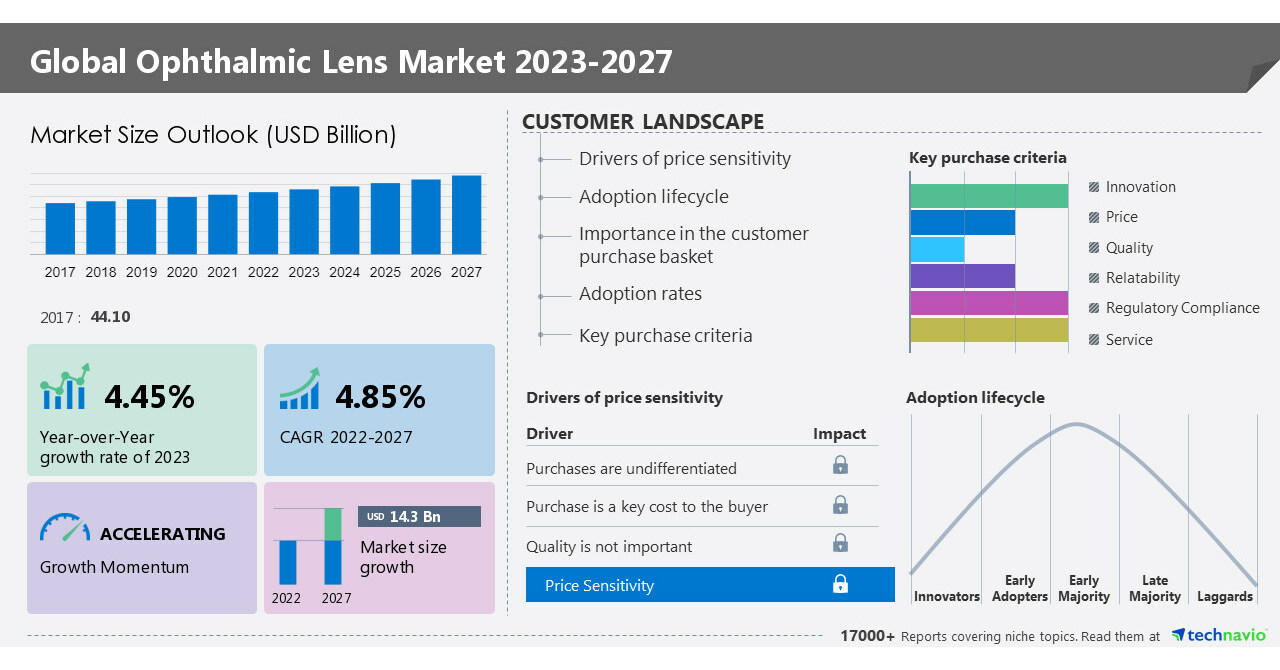
NEW YORK, June 8, 2023 /PRNewswire/ — The ophthalmic lens market is set to grow by USD 14.3 billion from 2022 to 2027. The market is expected to be progressing at a CAGR of 4.85% during the forecast period. The report offers an up-to-date analysis regarding the current global market scenario, the latest trends and drivers, and the overall market environment. The market is driven by the increasing prevalence of refractive errors. The most common refractive error is myopia, which first manifests in children of school-going age and typically progresses until about age 20 as the eyes continue to grow during childhood. Also, hyperopia, commonly known as hypermetropia, can affect both children and adults, it is one of the leading causes of visual impairment. Thus, there is an increasing demand for ophthalmic lenses for vision correction with the growing prevalence of refractive errors and cataracts. –Here is an Exclusive report talking about Market scenarios with a historical period (2017-2021) and a forecast period (2023-2027). Download Sample Report in minutes!
The ophthalmic lens market covers the following areas:
The report on the ophthalmic lens market provides a holistic update, market size and forecast, trends, growth drivers, and challenges, as well as vendor analysis.
Ophthalmic Lens Market 2023-2027 – Market Dynamics
An increase in acquisitions and partnerships is an emerging trend influencing the market. There is intense competition between global vendors and thus, they are opting for strategic partnerships and acquisitions with market participants such as product providers, technology providers, and platform providers. With acquisitions and strategic partnerships, vendors have strengthened their technological competence, product portfolio, and geographic reach. Hence, such trends boost market growth during the forecast period.
A major challenge affecting the market growth is the high cost of ophthalmic lenses. With advances in technology, the cost of ophthalmic lenses has significantly increased. Depending on the type of lens, the cost varies. For instance, the cost of HD spectacle glass lenses is 25%-30% more than traditional spectacle glass lenses. Moreover, the cost burden further increases with the cost of contact lens solutions. Hence, such challenges impede market growth during the forecast period.
What’s New? –
- Special coverage on the Russia–Ukraine war; global inflation; recovery analysis from COVID-19; supply chain disruptions, global trade tensions; and risk of recession
- Global competitiveness and key competitor positions
- Market presence across multiple geographical footprints – Strong/Active/Niche/Trivial – Buy the report!
Ophthalmic Lens Market 2023-2027: Market Segmentation
This market report extensively covers market segmentation by end-user (consumers, hospitals and clinics, and ambulatory surgery centers), product (spectacle lens, contact lens, and IOLs), and geography (North America, Europe, Asia, and Rest of World (ROW))
- The market share growth by the consumers segment will be significant for overall market growth during the forecast period. The demand for ophthalmic lenses increases, stimulating market growth as the awareness of vision-impairing conditions and the available corrective solutions will increase. Furthermore, the adoption of digital technologies such as smartphones, laptops, and computers is constantly expanding as they have become part of the world. Hence, such factors drive segment growth during the forecast period.
This report presents a detailed picture of the market by the way of study, synthesis, and
summation of data from multiple sources through an analysis of key parameters- View
Sample Report
Companies Mentioned
- Aksh Optifibre
- Alcon Inc.
- Alpine Research Optics
- Bausch Health Co. Inc.
- Bod Lenses
- Camax Optical Corp.
- Carl Zeiss AG
- Corning Inc.
- EssilorLuxottica
- EssilorLuxottica SA
- Halma Plc
- HOYA Corp.
- Jiangsu Hongchen Group Co. Ltd.
- Johnson and Johnson
- Mitsui Chemicals Inc
- Nikon Corp.
- Privo
- Rodenstock GmBH
- Shamir Ltd.
- SynergEyes Inc.
- The Cooper Companies Inc.
- The Walman Optical Co.
- VISION EASE
Vendor Offerings
- Bausch Health Co. Inc. – The company offers Ophthalmic lenses such as Plano-Convex Lenses, Double-Convex Lenses, Plano-Concave Lenses, Laser Lenses, and others.
- Camax Optical Corp. – The company offers Ophthalmic lenses such as Blue Tint Contact Lens, Color Contact Lens.
- Carl Zeiss AG – The company offers Ophthalmic lenses such as ZEISS PhotoFusion X Lenses.
Gain instant access to 17,000+ market research reports.
Technavio’s SUBSCRIPTION platform
Related Reports:
The optical lens market size is expected to increase by USD 6.12 billion from 2021 to 2026, and the market’s growth momentum will accelerate at a CAGR of 6.96%. Furthermore, this report extensively covers the market segmentation by end-user (consumer electronics, healthcare, life science, and others) and geography (North America, Europe, APAC, South America, and the Middle East and Africa). The growing popularity of dual-lens cameras in smartphones is one of the key drivers fueling the market growth.
The intraocular lens market in India is estimated to grow at a CAGR of 9.2% between 2022 and 2027. The size of the market is forecast to increase by USD 99.17 million. This report extensively covers market segmentation by product (monofocal intraocular lens, multifocal intraocular lens, toric intraocular lens, and accommodative intraocular lens), and end-user (hospitals, ophthalmic clinics, and ambulatory surgery centers). The increasing prevalence of ophthalmic diseases is notably driving the market growth.
|
Ophthalmic Lens Market Scope |
|
|
Report Coverage |
Details |
|
Base year |
2022 |
|
Historic period |
2017-2021 |
|
Forecast period |
2023-2027 |
|
Growth momentum & CAGR |
Accelerate at a CAGR of 4.85% |
|
Market growth 2023-2027 |
USD 14.3 billion |
|
Market structure |
Fragmented |
|
YoY growth 2022-2023(%) |
4.45 |
|
Regional analysis |
North America, Europe, Asia, and Rest of World (ROW) |
|
Performing market contribution |
North America at 45% |
|
Key countries |
US, Germany, France, China, and Japan |
|
Competitive landscape |
Leading Vendors, Market Positioning of Vendors, Competitive Strategies, and Industry Risks |
|
Key companies profiled |
Aksh Optifibre, Alcon Inc., Alpine Research Optics, Bausch Health Co. Inc., Bod Lenses, Camax Optical Corp., Carl Zeiss AG, Corning Inc., EssilorLuxottica, EssilorLuxottica SA, Halma Plc, HOYA Corp., Jiangsu Hongchen Group Co. Ltd., Johnson and Johnson, Mitsui Chemicals Inc, Nikon Corp., Privo, Rodenstock GmBH, Shamir Ltd., SynergEyes Inc., The Cooper Companies Inc., The Walman Optical Co., and VISION EASE |
|
Market dynamics |
Parent market analysis, Market growth inducers and obstacles, Fast-growing and slow-growing segment analysis, COVID-19 impact and recovery analysis and future consumer dynamics, Market condition analysis for forecast period. |
|
Customization purview |
If our report has not included the data that you are looking for, you can reach out to our analysts and get segments customized. |
Key Topics Covered:
1 Executive Summary
- 1.1 Market overview
- Exhibit 01: Executive Summary – Chart on Market Overview
- Exhibit 02: Executive Summary – Data Table on Market Overview
- Exhibit 03: Executive Summary – Chart on Global Market Characteristics
- Exhibit 04: Executive Summary – Chart on Market by Geography
- Exhibit 05: Executive Summary – Chart on Market Segmentation by End-user
- Exhibit 06: Executive Summary – Chart on Market Segmentation by Product
- Exhibit 07: Executive Summary – Chart on Incremental Growth
- Exhibit 08: Executive Summary – Data Table on Incremental Growth
- Exhibit 09: Executive Summary – Chart on Vendor Market Positioning
2 Market Landscape
- 2.1 Market ecosystem
- Exhibit 10: Parent market
- Exhibit 11: Market Characteristics
3 Market Sizing
- 3.1 Market definition
- Exhibit 12: Offerings of vendors included in the market definition
- 3.2 Market segment analysis
- Exhibit 13: Market segments
- 3.4 Market outlook: Forecast for 2022-2027
- Exhibit 14: Chart on Global – Market size and forecast 2022-2027 ($ billion)
- Exhibit 15: Data Table on Global – Market size and forecast 2022-2027 ($ billion)
- Exhibit 16: Chart on Global Market: Year-over-year growth 2022-2027 (%)
- Exhibit 17: Data Table on Global Market: Year-over-year growth 2022-2027 (%)
4 Historic Market Size
- 4.1 Global ophthalmic lens market 2017 – 2021
- Exhibit 18: Historic Market Size – Data Table on Global ophthalmic lens market 2017 – 2021 ($ billion)
- 4.2 End users Segment Analysis 2017 – 2021
- Exhibit 19: Historic Market Size – End users Segment 2017 – 2021 ($ billion)
- 4.3 Product Segment Analysis 2017 – 2021
- Exhibit 20: Historic Market Size – Product Segment 2017 – 2021 ($ billion)
- 4.4 Geography Segment Analysis 2017 – 2021
- Exhibit 21: Historic Market Size – Geography Segment 2017 – 2021 ($ billion)
- 4.5 Country Segment Analysis 2017 – 2021
- Exhibit 22: Historic Market Size – Country Segment 2017 – 2021 ($ billion)
5 Five Forces Analysis
- 5.1 Five forces summary
- Exhibit 23: Five forces analysis – Comparison between 2022 and 2027
- 5.2 Bargaining power of buyers
- Exhibit 24: Chart on Bargaining power of buyers – Impact of key factors 2022 and 2027
- 5.3 Bargaining power of suppliers
- Exhibit 25: Bargaining power of suppliers – Impact of key factors in 2022 and 2027
- 5.4 Threat of new entrants
- Exhibit 26: Threat of new entrants – Impact of key factors in 2022 and 2027
- 5.5 Threat of substitutes
- Exhibit 27: Threat of substitutes – Impact of key factors in 2022 and 2027
- 5.6 Threat of rivalry
- Exhibit 28: Threat of rivalry – Impact of key factors in 2022 and 2027
- 5.7 Market condition
- Exhibit 29: Chart on Market condition – Five forces 2022 and 2027
6 Market Segmentation by End-user
- 6.1 Market segments
- Exhibit 30: Chart on End-user – Market share 2022-2027 (%)
- Exhibit 31: Data Table on End-user – Market share 2022-2027 (%)
- 6.2 Comparison by End-user
- Exhibit 32: Chart on Comparison by End-user
- Exhibit 33: Data Table on Comparison by End-user
- 6.3 Consumers – Market size and forecast 2022-2027
- Exhibit 34: Chart on Consumers – Market size and forecast 2022-2027 ($ billion)
- Exhibit 35: Data Table on Consumers – Market size and forecast 2022-2027 ($ billion)
- Exhibit 36: Chart on Consumers – Year-over-year growth 2022-2027 (%)
- Exhibit 37: Data Table on Consumers – Year-over-year growth 2022-2027 (%)
- 6.4 Hospitals and clinics – Market size and forecast 2022-2027
- Exhibit 38: Chart on Hospitals and clinics – Market size and forecast 2022-2027 ($ billion)
- Exhibit 39: Data Table on Hospitals and clinics – Market size and forecast 2022-2027 ($ billion)
- Exhibit 40: Chart on Hospitals and clinics – Year-over-year growth 2022-2027 (%)
- Exhibit 41: Data Table on Hospitals and clinics – Year-over-year growth 2022-2027 (%)
- 6.5 Ambulatory surgery centers – Market size and forecast 2022-2027
- Exhibit 42: Chart on Ambulatory surgery centers – Market size and forecast 2022-2027 ($ billion)
- Exhibit 43: Data Table on Ambulatory surgery centers – Market size and forecast 2022-2027 ($ billion)
- Exhibit 44: Chart on Ambulatory surgery centers – Year-over-year growth 2022-2027 (%)
- Exhibit 45: Data Table on Ambulatory surgery centers – Year-over-year growth 2022-2027 (%)
- 6.6 Market opportunity by End-user
- Exhibit 46: Market opportunity by End-user ($ billion)
7 Market Segmentation by Product
- 7.1 Market segments
- Exhibit 47: Chart on Product – Market share 2022-2027 (%)
- Exhibit 48: Data Table on Product – Market share 2022-2027 (%)
- 7.2 Comparison by Product
- Exhibit 49: Chart on Comparison by Product
- Exhibit 50: Data Table on Comparison by Product
- 7.3 Spectacle lens – Market size and forecast 2022-2027
- Exhibit 51: Chart on Spectacle lens – Market size and forecast 2022-2027 ($ billion)
- Exhibit 52: Data Table on Spectacle lens – Market size and forecast 2022-2027 ($ billion)
- Exhibit 53: Chart on Spectacle lens – Year-over-year growth 2022-2027 (%)
- Exhibit 54: Data Table on Spectacle lens – Year-over-year growth 2022-2027 (%)
- 7.4 Contact lens – Market size and forecast 2022-2027
- Exhibit 55: Chart on Contact lens – Market size and forecast 2022-2027 ($ billion)
- Exhibit 56: Data Table on Contact lens – Market size and forecast 2022-2027 ($ billion)
- Exhibit 57: Chart on Contact lens – Year-over-year growth 2022-2027 (%)
- Exhibit 58: Data Table on Contact lens – Year-over-year growth 2022-2027 (%)
- 7.5 IOLs – Market size and forecast 2022-2027
- Exhibit 59: Chart on IOLs – Market size and forecast 2022-2027 ($ billion)
- Exhibit 60: Data Table on IOLs – Market size and forecast 2022-2027 ($ billion)
- Exhibit 61: Chart on IOLs – Year-over-year growth 2022-2027 (%)
- Exhibit 62: Data Table on IOLs – Year-over-year growth 2022-2027 (%)
- 7.6 Market opportunity by Product
- Exhibit 63: Market opportunity by Product ($ billion)
8 Customer Landscape
- 8.1 Customer landscape overview
- Exhibit 64: Analysis of price sensitivity, lifecycle, customer purchase basket, adoption rates, and purchase criteria
9 Geographic Landscape
- 9.1 Geographic segmentation
- Exhibit 65: Chart on Market share by geography 2022-2027 (%)
- Exhibit 66: Data Table on Market share by geography 2022-2027 (%)
- 9.2 Geographic comparison
- Exhibit 67: Chart on Geographic comparison
- Exhibit 68: Data Table on Geographic comparison
- 9.3 North America – Market size and forecast 2022-2027
- Exhibit 69: Chart on North America – Market size and forecast 2022-2027 ($ billion)
- Exhibit 70: Data Table on North America – Market size and forecast 2022-2027 ($ billion)
- Exhibit 71: Chart on North America – Year-over-year growth 2022-2027 (%)
- Exhibit 72: Data Table on North America – Year-over-year growth 2022-2027 (%)
- 9.4 Europe – Market size and forecast 2022-2027
- Exhibit 73: Chart on Europe – Market size and forecast 2022-2027 ($ billion)
- Exhibit 74: Data Table on Europe – Market size and forecast 2022-2027 ($ billion)
- Exhibit 75: Chart on Europe – Year-over-year growth 2022-2027 (%)
- Exhibit 76: Data Table on Europe – Year-over-year growth 2022-2027 (%)
- 9.5 Asia – Market size and forecast 2022-2027
- Exhibit 77: Chart on Asia – Market size and forecast 2022-2027 ($ billion)
- Exhibit 78: Data Table on Asia – Market size and forecast 2022-2027 ($ billion)
- Exhibit 79: Chart on Asia – Year-over-year growth 2022-2027 (%)
- Exhibit 80: Data Table on Asia – Year-over-year growth 2022-2027 (%)
- 9.6 Rest of World (ROW) – Market size and forecast 2022-2027
- Exhibit 81: Chart on Rest of World (ROW) – Market size and forecast 2022-2027 ($ billion)
- Exhibit 82: Data Table on Rest of World (ROW) – Market size and forecast 2022-2027 ($ billion)
- Exhibit 83: Chart on Rest of World (ROW) – Year-over-year growth 2022-2027 (%)
- Exhibit 84: Data Table on Rest of World (ROW) – Year-over-year growth 2022-2027 (%)
- 9.7 US – Market size and forecast 2022-2027
- Exhibit 85: Chart on US – Market size and forecast 2022-2027 ($ billion)
- Exhibit 86: Data Table on US – Market size and forecast 2022-2027 ($ billion)
- Exhibit 87: Chart on US – Year-over-year growth 2022-2027 (%)
- Exhibit 88: Data Table on US – Year-over-year growth 2022-2027 (%)
- 9.8 China – Market size and forecast 2022-2027
- Exhibit 89: Chart on China – Market size and forecast 2022-2027 ($ billion)
- Exhibit 90: Data Table on China – Market size and forecast 2022-2027 ($ billion)
- Exhibit 91: Chart on China – Year-over-year growth 2022-2027 (%)
- Exhibit 92: Data Table on China – Year-over-year growth 2022-2027 (%)
- 9.9 Germany – Market size and forecast 2022-2027
- Exhibit 93: Chart on Germany – Market size and forecast 2022-2027 ($ billion)
- Exhibit 94: Data Table on Germany – Market size and forecast 2022-2027 ($ billion)
- Exhibit 95: Chart on Germany – Year-over-year growth 2022-2027 (%)
- Exhibit 96: Data Table on Germany – Year-over-year growth 2022-2027 (%)
- 9.10 Japan – Market size and forecast 2022-2027
- Exhibit 97: Chart on Japan – Market size and forecast 2022-2027 ($ billion)
- Exhibit 98: Data Table on Japan – Market size and forecast 2022-2027 ($ billion)
- Exhibit 99: Chart on Japan – Year-over-year growth 2022-2027 (%)
- Exhibit 100: Data Table on Japan – Year-over-year growth 2022-2027 (%)
- 9.11 France – Market size and forecast 2022-2027
- Exhibit 101: Chart on France – Market size and forecast 2022-2027 ($ billion)
- Exhibit 102: Data Table on France – Market size and forecast 2022-2027 ($ billion)
- Exhibit 103: Chart on France – Year-over-year growth 2022-2027 (%)
- Exhibit 104: Data Table on France – Year-over-year growth 2022-2027 (%)
- 9.12 Market opportunity by geography
- Exhibit 105: Market opportunity by geography ($ billion)
10 Drivers, Challenges, and Trends
- 10.3 Impact of drivers and challenges
- Exhibit 106: Impact of drivers and challenges in 2022 and 2027
11 Vendor Landscape
- 11.2 Vendor landscape
- Exhibit 107: Overview on Criticality of inputs and Factors of differentiation
- 11.3 Landscape disruption
- Exhibit 108: Overview on factors of disruption
- 11.4 Industry risks
- Exhibit 109: Impact of key risks on business
12 Vendor Analysis
- 12.1 Vendors covered
- Exhibit 110: Vendors covered
- 12.2 Market positioning of vendors
- Exhibit 111: Matrix on vendor position and classification
- 12.3 Alpine Research Optics
- Exhibit 112: Alpine Research Optics – Overview
- Exhibit 113: Alpine Research Optics – Product / Service
- Exhibit 114: Alpine Research Optics – Key offerings
- 12.4 Bausch Health Co. Inc.
- Exhibit 115: Bausch Health Co. Inc. – Overview
- Exhibit 116: Bausch Health Co. Inc. – Business segments
- Exhibit 117: Bausch Health Co. Inc. – Key news
- Exhibit 118: Bausch Health Co. Inc. – Key offerings
- Exhibit 119: Bausch Health Co. Inc. – Segment focus
- 12.5 Camax Optical Corp.
- Exhibit 120: Camax Optical Corp. – Overview
- Exhibit 121: Camax Optical Corp. – Product / Service
- Exhibit 122: Camax Optical Corp. – Key offerings
- 12.6 Carl Zeiss AG
- Exhibit 123: Carl Zeiss AG – Overview
- Exhibit 124: Carl Zeiss AG – Business segments
- Exhibit 125: Carl Zeiss AG – Key offerings
- Exhibit 126: Carl Zeiss AG – Segment focus
- 12.7 Corning Inc.
- Exhibit 127: Corning Inc. – Overview
- Exhibit 128: Corning Inc. – Business segments
- Exhibit 129: Corning Inc. – Key news
- Exhibit 130: Corning Inc. – Key offerings
- Exhibit 131: Corning Inc. – Segment focus
- 12.8 EssilorLuxottica
- Exhibit 132: EssilorLuxottica – Overview
- Exhibit 133: EssilorLuxottica – Business segments
- Exhibit 134: EssilorLuxottica – Key news
- Exhibit 135: EssilorLuxottica – Key offerings
- Exhibit 136: EssilorLuxottica – Segment focus
- 12.9 EssilorLuxottica SA
- Exhibit 137: EssilorLuxottica SA – Overview
- Exhibit 138: EssilorLuxottica SA – Business segments
- Exhibit 139: EssilorLuxottica SA – Key offerings
- Exhibit 140: EssilorLuxottica SA – Segment focus
- 12.10 Halma Plc
- Exhibit 141: Halma Plc – Overview
- Exhibit 142: Halma Plc – Business segments
- Exhibit 143: Halma Plc – Key news
- Exhibit 144: Halma Plc – Key offerings
- Exhibit 145: Halma Plc – Segment focus
- 12.11 HOYA Corp.
- Exhibit 146: HOYA Corp. – Overview
- Exhibit 147: HOYA Corp. – Business segments
- Exhibit 148: HOYA Corp. – Key offerings
- Exhibit 149: HOYA Corp. – Segment focus
- 12.12 Jiangsu Hongchen Group Co. Ltd.
- Exhibit 150: Jiangsu Hongchen Group Co. Ltd. – Overview
- Exhibit 151: Jiangsu Hongchen Group Co. Ltd. – Product / Service
- Exhibit 152: Jiangsu Hongchen Group Co. Ltd. – Key offerings
- 12.13 Johnson and Johnson
- Exhibit 153: Johnson and Johnson – Overview
- Exhibit 154: Johnson and Johnson – Business segments
- Exhibit 155: Johnson and Johnson – Key news
- Exhibit 156: Johnson and Johnson – Key offerings
- Exhibit 157: Johnson and Johnson – Segment focus
- 12.14 Mitsui Chemicals Inc
- Exhibit 158: Mitsui Chemicals Inc – Overview
- Exhibit 159: Mitsui Chemicals Inc – Business segments
- Exhibit 160: Mitsui Chemicals Inc – Key offerings
- Exhibit 161: Mitsui Chemicals Inc – Segment focus
- 12.15 Nikon Corp.
- Exhibit 162: Nikon Corp. – Overview
- Exhibit 163: Nikon Corp. – Business segments
- Exhibit 164: Nikon Corp. – Key news
- Exhibit 165: Nikon Corp. – Key offerings
- Exhibit 166: Nikon Corp. – Segment focus
- 12.16 Privo
- Exhibit 167: Privo – Overview
- Exhibit 168: Privo – Product / Service
- Exhibit 169: Privo – Key offerings
- 12.17 VISION EASE
- Exhibit 170: VISION EASE – Overview
- Exhibit 171: VISION EASE – Product / Service
- Exhibit 172: VISION EASE – Key offerings
13 Appendix
- 13.2 Inclusions and exclusions checklist
- Exhibit 173: Inclusions checklist
- Exhibit 174: Exclusions checklist
- 13.3 Currency conversion rates for US$
- Exhibit 175: Currency conversion rates for US$
- 13.4 Research methodology
- Exhibit 176: Research methodology
- Exhibit 177: Validation techniques employed for market sizing
- Exhibit 178: Information sources
- 13.5 List of abbreviations
- Exhibit 179: List of abbreviations
About Us
Technavio is a leading global technology research and advisory company. Their research and analysis focuses on emerging market trends and provides actionable insights to help businesses identify market opportunities and develop effective strategies to optimize their market positions. With over 500 specialized analysts, Technavio’s report library consists of more than 17,000 reports and counting, covering 800 technologies, spanning across 50 countries. Their client base consists of enterprises of all sizes, including more than 100 Fortune 500 companies. This growing client base relies on Technavio’s comprehensive coverage, extensive research, and actionable market insights to identify opportunities in existing and potential markets and assess their competitive positions within changing market scenarios.
Contact
Technavio Research
Jesse Maida
Media & Marketing Executive
US: +1 844 364 1100
UK: +44 203 893 3200
Email: [email protected]
Website: www.technavio.com
SOURCE Technavio
