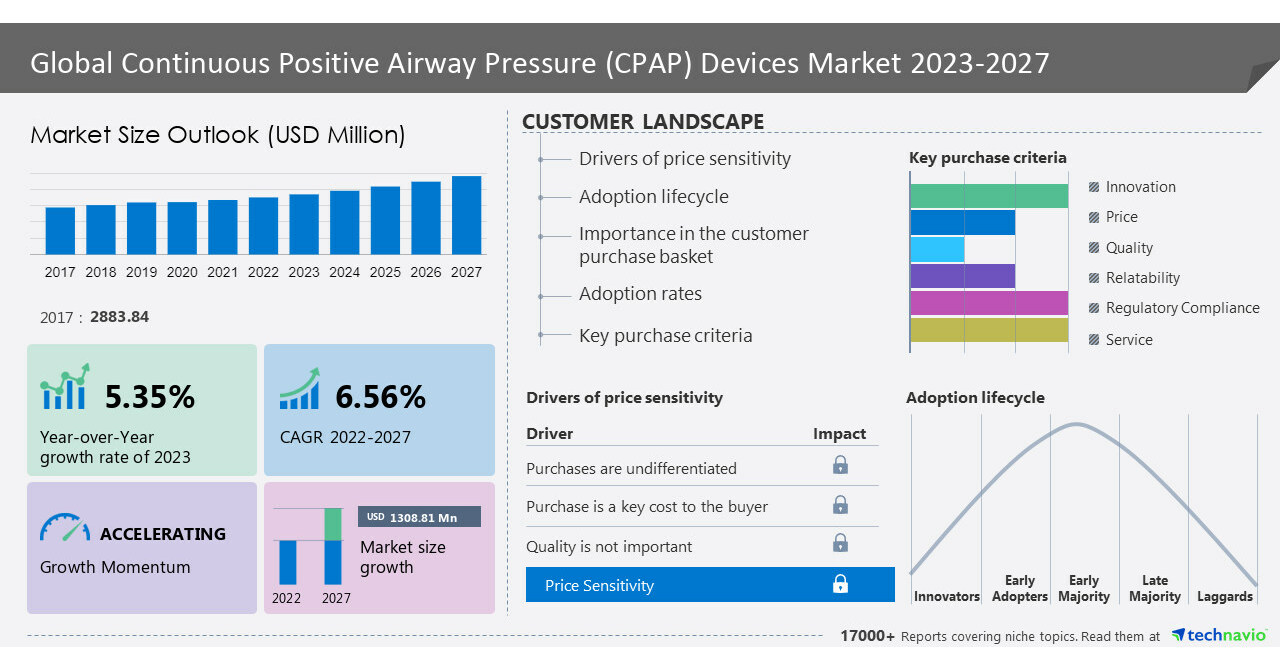
NEW YORK, June 13, 2023 /PRNewswire/ — The continuous positive airway pressure (CPAP) devices market is set to grow by USD 1,308.81 million from 2022 to 2027. The market is estimated to be progressing at a CAGR of 6.56% during the forecast period. The report offers an up-to-date analysis regarding the current global market scenario, the latest trends and drivers, and the overall market environment. The increasing prevalence of sleep apnea and respiratory disorders notably driving the CPAP devices market growth. The increased prevalence of sleep apnea along with the rising number of preterm infants has resulted in high demand for CPAP devices. Also, according to the Sleep Foundation data, the number of preterm infants was the highest in developing countries. The countries include India, China, Pakistan, Indonesia, Bangladesh, and the Philippines. Furthermore, the increased prevalence of sleep apnea and the rising number of preterm infants have resulted in high demand for CPAP devices. Hence, the increased prevalence of sleep apnea and the rising number of preterm infants have resulted in high demand for CPAP devices. –Here is an Exclusive report talking about Market scenarios with a historical period (2017-2021) and the forecast period (2023-2027). Download Sample Report in minutes!
The continuous positive airway pressure (CPAP) devices market covers the following areas:
The report on the continuous positive airway pressure (CPAP) devices market provides a holistic update, market size and forecast, trends, growth drivers, and challenges, as well as vendor analysis.
Continuous Positive Airway Pressure (CPAP) Devices Market 2023-2027 – Market Dynamics
Driver
The increasing number of partnerships and collaborations is an emerging trend driving the CPAP devices market growth. Market vendors opt for business strategies, such as partnerships and collaborations, with end-users and medical technology companies, to improve their distribution channels and upgrade their product portfolios by integrating software tools into their devices, which can drive the growth of the global CPAP devices market. Furthermore, Philips Respironics has collaborated with Inspire Medical Systems to develop an implantable device for sleep apnea. Companies can develop innovative solutions that improve patient outcomes and reduce the burden of respiratory disorders on healthcare systems by working together. Hence, such trends fuel the growth of the market during the forecast period.
Challenge
The major challenge impeding the continuous positive airway pressure market growth is the regulatory challenges. The market is highly regulated, and manufacturers must adhere to various guidelines and standards set by regulatory bodies, such as the US Food and Drug Administration (FDA) and the European Medicines Agency (EMA). Such regulations are put in place to ensure the safety and efficacy of CPAP devices. Also, they cover aspects such as their design, manufacturing, labeling, and marketing. Furthermore, regulatory agencies often update and modify their guidelines in response to new developments and emerging technologies, and manufacturers must stay up to date with these changes to avoid non-compliance issues. Hence, such factors impede market growth during the forecast period.
Continuous Positive Airway Pressure (CPAP) Devices Market 2023-2027: Market Segmentation
This continuous positive airway pressure devices market report extensively covers market segmentation by product (devices and accessories), distribution channel (offline and online), and geography (North America, Europe, Asia, and the Rest of the World (ROW)).
- The market share growth by the devices segment will be significant for overall market growth during the forecast period. The growth of the segment can be attributed to factors such as the increasing number of product launches, the rising prevalence of sleep apnea, business strategies adopted by key vendors, and favorable reimbursement policies for CPAP devices. Furthermore, mobile health (mHealth) is a promising way of providing remote and easy clinical control for follow-ups and support to CPAP devices. Hence, such factors drive segment growth during the forecast period.
This report presents a detailed picture of the market by way of study, synthesis, and summation of data from multiple sources through an analysis of key parameters- View Sample Report
What’s New? –
- Special coverage on the Russia–Ukraine war; global inflation; recovery analysis from COVID-19; supply chain disruptions, global trade tensions; and risk of recession
- Global competitiveness and key competitor positions
- Market presence across multiple geographical footprints – Strong/Active/Niche/Trivial – Buy the report!
Companies Mentioned
- BMC MEDICAL CO. LTD.
- CASCO BAY MOLDING
- Compumedics Ltd.
- DeVilbiss Healthcare GmbH
- Dragerwerk AG and Co. KGaA
- Ess Pee Enterprises
- Fisher and Paykel Healthcare Corp. Ltd.
- Hamilton Bonaduz AG
- Koninklijke Philips NV
- Lowenstein Medical Technology GmbH and Co. KG
- Manish Enterprises
- Medtronic Plc
- Narang Medical Ltd.
- NXP Semiconductors NV
- ResMed Inc.
- Sleepnet Corp.
- Smiths Group Plc
- TG Eakin Ltd.
- The Cleveland Clinic Foundation
- Vyaire Medical Inc.
Vendor Offerings
- CASCO BAY MOLDING – The company offers various types of Continuous Positive Airway Pressure Devices masks such as Full face Continuous Positive Airway Pressure Devices masks and Nasal masks.
- Compumedics Ltd. – The company offers Continuous Positive Airway Pressure Devices machines such as the Somnilink Positive Airway Pressure SPAP system for the treatment of Obstructive Sleep Apnea OSA in adults.
- DeVilbiss Healthcare GmbH – The company offers Continuous Positive Airway Pressure Devices therapy such as the SleepCubes series and DV6 series.
Gain instant access to 17,000+ market research reports.
Technavio’s SUBSCRIPTION platform
Related Reports:
The Global Sleeping Aids Market size is estimated to grow by USD 36,416.19 million between 2022 and 2027 accelerating at a CAGR of 6.79%. This market report extensively covers market segmentation by type (insomnia, sleep apnea, restless legs syndrome, and others), product (mattress and pillows, sleep apnea devices, and others), and geography (North America, Europe, APAC, South America, and Middle East and Africa). The growing patient-care services are a key factor driving the growth of the global sleep aids market.
The continuous positive airway pressure (CPAP) market in the US is estimated to grow by USD 305.3 million accelerating at a CAGR of 6.32% between 2021 to 2026. This continuous positive airway pressure (CPAP) market in the US report extensively covers market segmentation by Product (devices, accessories, and masks) Distribution Channel (offline and online), and geography US. A growing elderly population is increasing the number of people with insomnia and other sleep-related disorders.
|
Continuous Positive Airway Pressure (CPAP) Devices Market Scope |
|
|
Report Coverage |
Details |
|
Base year |
2022 |
|
Historic period |
2017-2021 |
|
Forecast period |
2023-2027 |
|
Growth momentum & CAGR |
Accelerate at a CAGR of 6.56% |
|
Market growth 2023-2027 |
USD 1,308.81 million |
|
Market structure |
Fragmented |
|
YoY growth 2022-2023(%) |
5.35 |
|
Regional analysis |
North America, Europe, Asia, and Rest of World (ROW) |
|
Performing market contribution |
North America at 42% |
|
Key countries |
US, Germany, UK, China, and Japan |
|
Competitive landscape |
Leading Vendors, Market Positioning of Vendors, Competitive Strategies, and Industry Risks |
|
Key companies profiled |
BMC MEDICAL CO. LTD., CASCO BAY MOLDING, Compumedics Ltd., DeVilbiss Healthcare GmbH, Dragerwerk AG and Co. KGaA, Ess Pee Enterprises, Fisher and Paykel Healthcare Corp. Ltd., Hamilton Bonaduz AG, Koninklijke Philips NV, Lowenstein Medical Technology GmbH and Co. KG, Manish Enterprises, Medtronic Plc, Narang Medical Ltd., NXP Semiconductors NV, ResMed Inc., Sleepnet Corp., Smiths Group Plc, TG Eakin Ltd., The Cleveland Clinic Foundation, and Vyaire Medical Inc. |
|
Market dynamics |
Parent market analysis, Market growth inducers and obstacles, Fast-growing and slow-growing segment analysis, COVID-19 impact and recovery analysis and future consumer dynamics, and Market condition analysis for the forecast period. |
|
Customization purview |
If our report has not included the data that you are looking for, you can reach out to our analysts and get segments customized. |
Key Topics Covered:
1 Executive Summary
- 1.1 Market overview
- Exhibit 01: Executive Summary – Chart on Market Overview
- Exhibit 02: Executive Summary – Data Table on Market Overview
- Exhibit 03: Executive Summary – Chart on Global Market Characteristics
- Exhibit 04: Executive Summary – Chart on Market by Geography
- Exhibit 05: Executive Summary – Chart on Market Segmentation by Product
- Exhibit 06: Executive Summary – Chart on Market Segmentation by Distribution Channel
- Exhibit 07: Executive Summary – Chart on Incremental Growth
- Exhibit 08: Executive Summary – Data Table on Incremental Growth
- Exhibit 09: Executive Summary – Chart on Vendor Market Positioning
2 Market Landscape
- 2.1 Market ecosystem
- Exhibit 10: Parent market
- Exhibit 11: Market Characteristics
3 Market Sizing
- 3.1 Market definition
- Exhibit 12: Offerings of vendors included in the market definition
- 3.2 Market segment analysis
- Exhibit 13: Market segments
- 3.4 Market outlook: Forecast for 2022-2027
- Exhibit 14: Chart on Global – Market size and forecast 2022-2027 ($ million)
- Exhibit 15: Data Table on Global – Market size and forecast 2022-2027 ($ million)
- Exhibit 16: Chart on Global Market: Year-over-year growth 2022-2027 (%)
- Exhibit 17: Data Table on Global Market: Year-over-year growth 2022-2027 (%)
4 Historic Market Size
- 4.1 Global continuous positive airway pressure (CPAP) devices market 2017 – 2021
- Exhibit 18: Historic Market Size – Data Table on global continuous positive airway pressure (cpap) devices market 2017 – 2021 ($ million)
- 4.2 Product Segment Analysis 2017 – 2021
- Exhibit 19: Historic Market Size – Product Segment 2017 – 2021 ($ million)
- 4.3 Distribution Channel Segment Analysis 2017 – 2021
- Exhibit 20: Historic Market Size – Distribution Channel Segment 2017 – 2021 ($ million)
- 4.4 Geography Segment Analysis 2017 – 2021
- Exhibit 21: Historic Market Size – Geography Segment 2017 – 2021 ($ million)
- 4.5 Country Segment Analysis 2017 – 2021
- Exhibit 22: Historic Market Size – Country Segment 2017 – 2021 ($ million)
5 Five Forces Analysis
- 5.1 Five forces summary
- Exhibit 23: Five forces analysis – Comparison between 2022 and 2027
- 5.2 Bargaining power of buyers
- Exhibit 24: Chart on Bargaining power of buyers – Impact of key factors 2022 and 2027
- 5.3 Bargaining power of suppliers
- Exhibit 25: Bargaining power of suppliers – Impact of key factors in 2022 and 2027
- 5.4 Threat of new entrants
- Exhibit 26: Threat of new entrants – Impact of key factors in 2022 and 2027
- 5.5 Threat of substitutes
- Exhibit 27: Threat of substitutes – Impact of key factors in 2022 and 2027
- 5.6 Threat of rivalry
- Exhibit 28: Threat of rivalry – Impact of key factors in 2022 and 2027
- 5.7 Market condition
- Exhibit 29: Chart on Market condition – Five forces 2022 and 2027
6 Market Segmentation by Product
- 6.1 Market segments
- Exhibit 30: Chart on Product – Market share 2022-2027 (%)
- Exhibit 31: Data Table on Product – Market share 2022-2027 (%)
- 6.2 Comparison by Product
- Exhibit 32: Chart on Comparison by Product
- Exhibit 33: Data Table on Comparison by Product
- 6.3 Devices – Market size and forecast 2022-2027
- Exhibit 34: Chart on Devices – Market size and forecast 2022-2027 ($ million)
- Exhibit 35: Data Table on Devices – Market size and forecast 2022-2027 ($ million)
- Exhibit 36: Chart on Devices – Year-over-year growth 2022-2027 (%)
- Exhibit 37: Data Table on Devices – Year-over-year growth 2022-2027 (%)
- 6.4 Accessories – Market size and forecast 2022-2027
- Exhibit 38: Chart on Accessories – Market size and forecast 2022-2027 ($ million)
- Exhibit 39: Data Table on Accessories – Market size and forecast 2022-2027 ($ million)
- Exhibit 40: Chart on Accessories – Year-over-year growth 2022-2027 (%)
- Exhibit 41: Data Table on Accessories – Year-over-year growth 2022-2027 (%)
- 6.5 Market opportunity by Product
- Exhibit 42: Market opportunity by Product ($ million)
- Exhibit 43: Data Table on Market opportunity by Product ($ million)
7 Market Segmentation by Distribution Channel
- 7.1 Market segments
- Exhibit 44: Chart on Distribution Channel – Market share 2022-2027 (%)
- Exhibit 45: Data Table on Distribution Channel – Market share 2022-2027 (%)
- 7.2 Comparison by Distribution Channel
- Exhibit 46: Chart on Comparison by Distribution Channel
- Exhibit 47: Data Table on Comparison by Distribution Channel
- 7.3 Offline – Market size and forecast 2022-2027
- Exhibit 48: Chart on Offline – Market size and forecast 2022-2027 ($ million)
- Exhibit 49: Data Table on Offline – Market size and forecast 2022-2027 ($ million)
- Exhibit 50: Chart on Offline – Year-over-year growth 2022-2027 (%)
- Exhibit 51: Data Table on Offline – Year-over-year growth 2022-2027 (%)
- 7.4 Online – Market size and forecast 2022-2027
- Exhibit 52: Chart on Online – Market size and forecast 2022-2027 ($ million)
- Exhibit 53: Data Table on Online – Market size and forecast 2022-2027 ($ million)
- Exhibit 54: Chart on Online – Year-over-year growth 2022-2027 (%)
- Exhibit 55: Data Table on Online – Year-over-year growth 2022-2027 (%)
- 7.5 Market opportunity by Distribution Channel
- Exhibit 56: Market opportunity by Distribution Channel ($ million)
- Exhibit 57: Data Table on Market opportunity by Distribution Channel ($ million)
8 Customer Landscape
- 8.1 Customer landscape overview
- Exhibit 58: Analysis of price sensitivity, lifecycle, customer purchase basket, adoption rates, and purchase criteria
9 Geographic Landscape
- 9.1 Geographic segmentation
- Exhibit 59: Chart on Market share by geography 2022-2027 (%)
- Exhibit 60: Data Table on Market share by geography 2022-2027 (%)
- 9.2 Geographic comparison
- Exhibit 61: Chart on Geographic comparison
- Exhibit 62: Data Table on Geographic comparison
- 9.3 North America – Market size and forecast 2022-2027
- Exhibit 63: Chart on North America – Market size and forecast 2022-2027 ($ million)
- Exhibit 64: Data Table on North America – Market size and forecast 2022-2027 ($ million)
- Exhibit 65: Chart on North America – Year-over-year growth 2022-2027 (%)
- Exhibit 66: Data Table on North America – Year-over-year growth 2022-2027 (%)
- 9.4 Europe – Market size and forecast 2022-2027
- Exhibit 67: Chart on Europe – Market size and forecast 2022-2027 ($ million)
- Exhibit 68: Data Table on Europe – Market size and forecast 2022-2027 ($ million)
- Exhibit 69: Chart on Europe – Year-over-year growth 2022-2027 (%)
- Exhibit 70: Data Table on Europe – Year-over-year growth 2022-2027 (%)
- 9.5 Asia – Market size and forecast 2022-2027
- Exhibit 71: Chart on Asia – Market size and forecast 2022-2027 ($ million)
- Exhibit 72: Data Table on Asia – Market size and forecast 2022-2027 ($ million)
- Exhibit 73: Chart on Asia – Year-over-year growth 2022-2027 (%)
- Exhibit 74: Data Table on Asia – Year-over-year growth 2022-2027 (%)
- 9.6 Rest of World (ROW) – Market size and forecast 2022-2027
- Exhibit 75: Chart on Rest of World (ROW) – Market size and forecast 2022-2027 ($ million)
- Exhibit 76: Data Table on Rest of World (ROW) – Market size and forecast 2022-2027 ($ million)
- Exhibit 77: Chart on Rest of World (ROW) – Year-over-year growth 2022-2027 (%)
- Exhibit 78: Data Table on Rest of World (ROW) – Year-over-year growth 2022-2027 (%)
- 9.7 US – Market size and forecast 2022-2027
- Exhibit 79: Chart on US – Market size and forecast 2022-2027 ($ million)
- Exhibit 80: Data Table on US – Market size and forecast 2022-2027 ($ million)
- Exhibit 81: Chart on US – Year-over-year growth 2022-2027 (%)
- Exhibit 82: Data Table on US – Year-over-year growth 2022-2027 (%)
- 9.8 Germany – Market size and forecast 2022-2027
- Exhibit 83: Chart on Germany – Market size and forecast 2022-2027 ($ million)
- Exhibit 84: Data Table on Germany – Market size and forecast 2022-2027 ($ million)
- Exhibit 85: Chart on Germany – Year-over-year growth 2022-2027 (%)
- Exhibit 86: Data Table on Germany – Year-over-year growth 2022-2027 (%)
- 9.9 China – Market size and forecast 2022-2027
- Exhibit 87: Chart on China – Market size and forecast 2022-2027 ($ million)
- Exhibit 88: Data Table on China – Market size and forecast 2022-2027 ($ million)
- Exhibit 89: Chart on China – Year-over-year growth 2022-2027 (%)
- Exhibit 90: Data Table on China – Year-over-year growth 2022-2027 (%)
- 9.10 UK – Market size and forecast 2022-2027
- Exhibit 91: Chart on UK – Market size and forecast 2022-2027 ($ million)
- Exhibit 92: Data Table on UK – Market size and forecast 2022-2027 ($ million)
- Exhibit 93: Chart on UK – Year-over-year growth 2022-2027 (%)
- Exhibit 94: Data Table on UK – Year-over-year growth 2022-2027 (%)
- 9.11 Japan – Market size and forecast 2022-2027
- Exhibit 95: Chart on Japan – Market size and forecast 2022-2027 ($ million)
- Exhibit 96: Data Table on Japan – Market size and forecast 2022-2027 ($ million)
- Exhibit 97: Chart on Japan – Year-over-year growth 2022-2027 (%)
- Exhibit 98: Data Table on Japan – Year-over-year growth 2022-2027 (%)
- 9.12 Market opportunity by geography
- Exhibit 99: Market opportunity by geography ($ million)
- Exhibit 100: Data Tables on Market opportunity by geography ($ million)
10 Drivers, Challenges, and Trends
- 10.3 Impact of drivers and challenges
- Exhibit 101: Impact of drivers and challenges in 2022 and 2027
11 Vendor Landscape
- 11.2 Vendor landscape
- Exhibit 102: Overview on Criticality of inputs and Factors of differentiation
- 11.3 Landscape disruption
- Exhibit 103: Overview on factors of disruption
- 11.4 Industry risks
- Exhibit 104: Impact of key risks on business
12 Vendor Analysis
- 12.1 Vendors covered
- Exhibit 105: Vendors covered
- 12.2 Market positioning of vendors
- Exhibit 106: Matrix on vendor position and classification
- 12.3 BMC MEDICAL CO. LTD.
- Exhibit 107: BMC MEDICAL CO. LTD. – Overview
- Exhibit 108: BMC MEDICAL CO. LTD. – Product / Service
- Exhibit 109: BMC MEDICAL CO. LTD. – Key offerings
- 12.4 CASCO BAY MOLDING
- Exhibit 110: CASCO BAY MOLDING – Overview
- Exhibit 111: CASCO BAY MOLDING – Product / Service
- Exhibit 112: CASCO BAY MOLDING – Key offerings
- 12.5 Compumedics Ltd.
- Exhibit 113: Compumedics Ltd. – Overview
- Exhibit 114: Compumedics Ltd. – Product / Service
- Exhibit 115: Compumedics Ltd. – Key offerings
- 12.6 DeVilbiss Healthcare GmbH
- Exhibit 116: DeVilbiss Healthcare GmbH – Overview
- Exhibit 117: DeVilbiss Healthcare GmbH – Product / Service
- Exhibit 118: DeVilbiss Healthcare GmbH – Key offerings
- 12.7 Dragerwerk AG and Co. KGaA
- Exhibit 119: Dragerwerk AG and Co. KGaA – Overview
- Exhibit 120: Dragerwerk AG and Co. KGaA – Business segments
- Exhibit 121: Dragerwerk AG and Co. KGaA – Key offerings
- Exhibit 122: Dragerwerk AG and Co. KGaA – Segment focus
- 12.8 Ess Pee Enterprises
- Exhibit 123: Ess Pee Enterprises – Overview
- Exhibit 124: Ess Pee Enterprises – Product / Service
- Exhibit 125: Ess Pee Enterprises – Key offerings
- 12.9 Fisher and Paykel Healthcare Corp. Ltd.
- Exhibit 126: Fisher and Paykel Healthcare Corp. Ltd. – Overview
- Exhibit 127: Fisher and Paykel Healthcare Corp. Ltd. – Product / Service
- Exhibit 128: Fisher and Paykel Healthcare Corp. Ltd. – Key news
- Exhibit 129: Fisher and Paykel Healthcare Corp. Ltd. – Key offerings
- 12.10 Hamilton Bonaduz AG
- Exhibit 130: Hamilton Bonaduz AG – Overview
- Exhibit 131: Hamilton Bonaduz AG – Product / Service
- Exhibit 132: Hamilton Bonaduz AG – Key offerings
- 12.11 Koninklijke Philips NV
- Exhibit 133: Koninklijke Philips NV – Overview
- Exhibit 134: Koninklijke Philips NV – Business segments
- Exhibit 135: Koninklijke Philips NV – Key news
- Exhibit 136: Koninklijke Philips NV – Key offerings
- Exhibit 137: Koninklijke Philips NV – Segment focus
- 12.12 Medtronic Plc
- Exhibit 138: Medtronic Plc – Overview
- Exhibit 139: Medtronic Plc – Business segments
- Exhibit 140: Medtronic Plc – Key news
- Exhibit 141: Medtronic Plc – Key offerings
- Exhibit 142: Medtronic Plc – Segment focus
- 12.13 NXP Semiconductors NV
- Exhibit 143: NXP Semiconductors NV – Overview
- Exhibit 144: NXP Semiconductors NV – Product / Service
- Exhibit 145: NXP Semiconductors NV – Key news
- Exhibit 146: NXP Semiconductors NV – Key offerings
- 12.14 ResMed Inc.
- Exhibit 147: ResMed Inc. – Overview
- Exhibit 148: ResMed Inc. – Business segments
- Exhibit 149: ResMed Inc. – Key news
- Exhibit 150: ResMed Inc. – Key offerings
- Exhibit 151: ResMed Inc. – Segment focus
- 12.15 Sleepnet Corp.
- Exhibit 152: Sleepnet Corp. – Overview
- Exhibit 153: Sleepnet Corp. – Product / Service
- Exhibit 154: Sleepnet Corp. – Key offerings
- 12.16 Smiths Group Plc
- Exhibit 155: Smiths Group Plc – Overview
- Exhibit 156: Smiths Group Plc – Business segments
- Exhibit 157: Smiths Group Plc – Key news
- Exhibit 158: Smiths Group Plc – Key offerings
- Exhibit 159: Smiths Group Plc – Segment focus
- 12.17 The Cleveland Clinic Foundation
- Exhibit 160: The Cleveland Clinic Foundation – Overview
- Exhibit 161: The Cleveland Clinic Foundation – Product / Service
- Exhibit 162: The Cleveland Clinic Foundation – Key offerings
13 Appendix
- 13.1 Scope of the report
- 13.2 Inclusions and exclusions checklist
- Exhibit 163: Inclusions checklist
- Exhibit 164: Exclusions checklist
- 13.3 Currency conversion rates for US$
- Exhibit 165: Currency conversion rates for US$
- 13.4 Research methodology
- Exhibit 166: Research methodology
- Exhibit 167: Validation techniques employed for market sizing
- Exhibit 168: Information sources
- 13.5 List of abbreviations
- Exhibit 169: List of abbreviations
About Us
Technavio is a leading global technology research and advisory company. Their research and analysis focuses on emerging market trends and provides actionable insights to help businesses identify market opportunities and develop effective strategies to optimize their market positions. With over 500 specialized analysts, Technavio’s report library consists of more than 17,000 reports and counting, covering 800 technologies, spanning across 50 countries. Their client base consists of enterprises of all sizes, including more than 100 Fortune 500 companies. This growing client base relies on Technavio’s comprehensive coverage, extensive research, and actionable market insights to identify opportunities in existing and potential markets and assess their competitive positions within changing market scenarios.
Contact
Technavio Research
Jesse Maida
Media & Marketing Executive
US: +1 844 364 1100
UK: +44 203 893 3200
Email: [email protected]
Website: www.technavio.com
SOURCE Technavio
