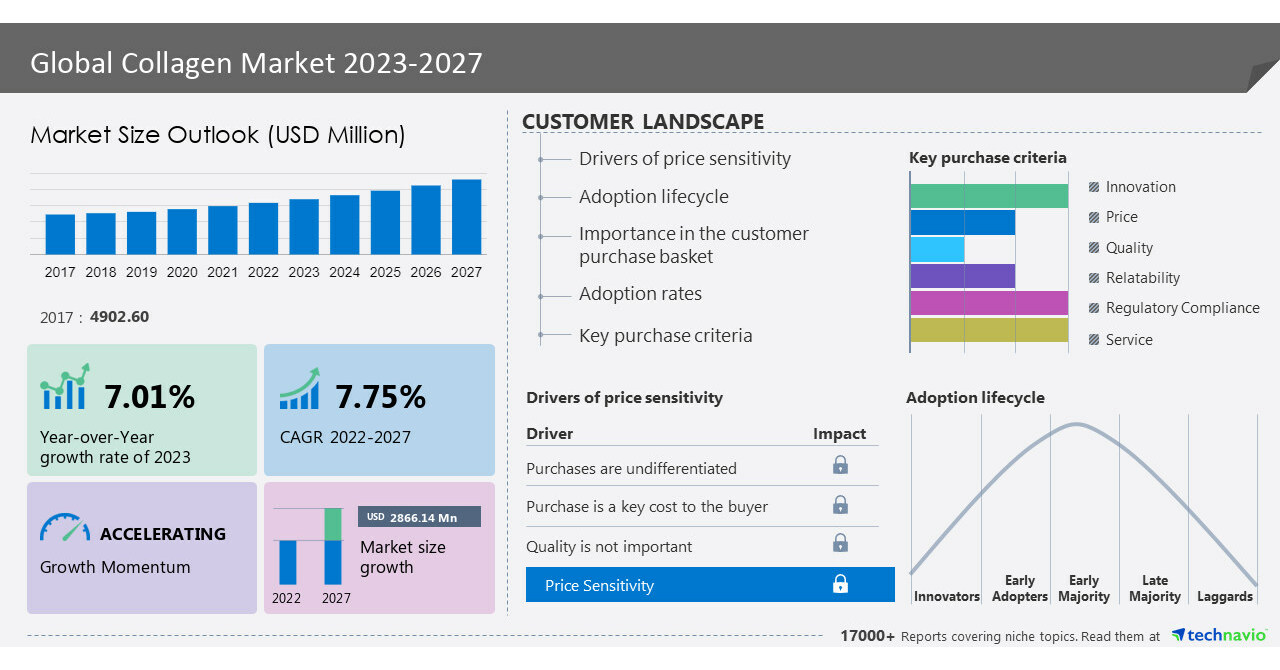
NEW YORK, June 12, 2023 /PRNewswire/ — The collagen market size is estimated to increase by USD 2,866.14 million from 2022 to 2027. The market’s growth momentum will progress at a CAGR of 7.75%. The rising demand for collagen from the healthcare industry is one of the major drivers of the global collagen market. Collagen is widely used in the medical industry, particularly in medical devices and wound dressings. The rising elderly population worldwide is expected to surge the demand for healthcare products and services and thus drive demand for collagen-based products. Collagen plays an important role as an ingredient in many regenerative medicine products. As a result, the growing demand for collagen from the healthcare industry is one of the major drivers, which is expected to boost the growth of the global collagen market during the forecast period. Discover some insights on the market size historic period (2017 to 2021) and Forecast 2023-2027 before buying the full report –Request a sample report
Collagen market – Vendor Analysis
Vendor Landscape – The global collagen market is fragmented, with the presence of several global as well as regional vendors. A few prominent vendors that offer collagen in the market are Advanced BioMatrix Inc., Ashland Inc., Athos Collagen Pvt. Ltd., Collagen Matrix Inc., Collagen Solutions Plc, ConnOils LLC, Gelita AG, Gelnex, Holista Colltech Ltd., Junca Gelatines SL, Koninklijke DSM NV, Lapi Gelatine Spa, Nippi Inc., Nitta Gelatin Inc., Rousselot SDN. BHD., Sandesara Group of Companies, SAS Gelatines Weishardt, Symatese, Tessenderlo Group NV, Titan Biotech Ltd., and others.
The global collagen market is highly competitive due to the presence of several international and domestic players. The established players have competitive advantages due to their popular brand names and large scale of operations. The focus of the vendors in the market is to develop strategies such as innovative solutions that address the demands of consumers. In addition, the companies are also focusing on collaborations and partnerships to expand their presence in the market.
What’s New? –
- Special coverage on the Russia–Ukraine war; global inflation; recovery analysis from COVID-19; supply chain disruptions, global trade tensions; and risk of recession
- Global competitiveness and key competitor positions
- Market presence across multiple geographical footprints – Strong/Active/Niche/Trivial – Buy the report!
Vendor Offerings –
- Advanced BioMatrix Inc. – The company offers collagen such as marine hydrolyzed collagen.
- Collagen Matrix Inc. – The company offers collagen products under its brand Matrixflex, MatrixMem, and MatrixDerm.
- Collagen Solutions Plc – The company offers collagen products such as Bovine collagen.
- For details on the vendor and their offerings – Request a sample report
Collagen Market – Segmentation Assessment
Segment Overview
Technavio has segmented the market based on Application (Food and beverage, Healthcare, Cosmetics, and Others), and Product (Gelatin, Hydrolyzed, and Native)
- The market share growth in the food and beverage segment will be significant during the forecast period. Fish collagen, an essential ingredient that offers significant nutritional benefits and numerous advantages for health, plays an important role in the food industry. People commonly add collagen to various raw materials, such as meat, to improve their technical attributes and sensory characteristics. As a result of the various benefits provided by collagen, the food and beverage industry are expected to see an increase in demand. This, in turn, is expected to drive the growth of the global collagen market’s food and beverage segment during the forecast period.
Geography Overview
By geography, the global collagen market is segmented into North America, Europe, APAC, South America, and Middle East and Africa. The report provides actionable insights and estimates the contribution of all regions to the growth of the global collagen market.
- North America is estimated to contribute 37% to the growth of the global market during the forecast period. The growth of the collagen market in North America is primarily driven by several key factors. These include increased collagen use in the food industry, growing interest in protein consumption and nutricosmetics, expanding applications in healthcare, and the rising adoption of collagen-based biomaterials. These factors collectively contribute to the growth of the collagen market in the North American region.
For insights on global, regional, and country-level parameters with growth opportunities from 2017 to 2027 – Download a Sample Report
Global Collagen Market – Market Dynamics
Key trend – Increasing demand for plant-based collagen is key trend in the global collagen market growth. With an increasing focus on health, wellness, and environmental consciousness, there has been a significant surge in consumer interest regarding plant-based substitutes for collagen derived from animals. Choosing plant-based collagen enables consumers to minimize their ecological impact and promote sustainable and ethical approaches. Hence, increasing demand for plant-based collagen is one of the growing trends which is expected to drive the growth of the global collagen market during the forecast period.
Major challenges – The limited adoption of collagen supplements in developing regions restricts the growth of the market. The demand for collagen supplements in developed countries is significant due to awareness of the health benefits of collagen supplements. However, in developing and underdeveloped regions like the rest of the world, the use of collagen supplements is relatively lower. This can be attributed to factors such as limited affordability and a lack of awareness regarding the potential benefits of collagen supplementation.
Drivers, Trends and challenges have an impact on market dynamics, which can impact businesses. Find more insights in a sample report!
What are the key data covered in this Collagen Market report?
- CAGR of the market during the forecast period
- Detailed information on factors that will drive the growth of the collagen market between 2023 and 2027
- Precise estimation of the size of the collagen market size and its contribution to the market in focus on the parent market
- Accurate predictions about upcoming trends and changes in consumer behavior
- Growth of the collagen market industry across North America, Europe, APAC, South America, and Middle East and Africa
- A thorough analysis of the market’s competitive landscape and detailed information about vendors
- Comprehensive analysis of factors that will challenge the growth of collagen market vendors
Gain instant access to 17,000+ market research reports.
Technavio’s SUBSCRIPTION platform
Related Reports:
The collagen supplement market size is estimated to grow at a CAGR of 6.84% between 2022 and 2027. The market size is forecast to increase by USD 873.92 million. Furthermore, this report extensively covers market segmentation by distribution channel (online and offline), source (bovine, porcine, and marine and poultry), and geography (North America, Europe, Asia, and Rest of World (ROW)). The health benefits of collagen supplement is one of the factors driving the collagen supplement market growth.
The hydrolyzed collagen market share is expected to increase by USD 541.45 million from 2021 to 2026, and the market’s growth momentum will accelerate at a CAGR of 8.02%. Furthermore, this report extensively covers the hydrolyzed collagen market segmentation by application (health and nutrition, food and beverage, pharmaceutical, cosmetics, and others) and geography (North America, Europe, APAC, South America, and the Middle East and Africa). The increasing adoption of hydrolyzed collagen-based supplements to improve joint conditions and support bone health is a key factor driving the global hydrolyzed collagen market growth.
|
Collagen Market Scope |
|
|
Report Coverage |
Details |
|
Historic period |
2017-2021 |
|
Forecast period |
2023-2027 |
|
Growth momentum & CAGR |
Accelerate at a CAGR of 7.75% |
|
Market growth 2023-2027 |
USD 2,866.14 million |
|
Market structure |
Fragmented |
|
YoY growth 2022-2023 (%) |
7.01 |
|
Regional analysis |
North America, Europe, APAC, South America, and Middle East and Africa |
|
Performing market contribution |
North America at 37% |
|
Key countries |
US, Japan, South Korea, Germany, and France |
|
Competitive landscape |
Leading Vendors, Market Positioning of Vendors, Competitive Strategies, and Industry Risks |
|
Key companies profiled |
Advanced BioMatrix Inc., Ashland Inc., Athos Collagen Pvt. Ltd., Collagen Matrix Inc., Collagen Solutions Plc, ConnOils LLC, Gelita AG, Gelnex, Holista Colltech Ltd., Junca Gelatines SL, Koninklijke DSM NV, Lapi Gelatine Spa, Nippi Inc., Nitta Gelatin Inc., Rousselot SDN. BHD., Sandesara Group of Companies, SAS Gelatines Weishardt, Symatese, Tessenderlo Group NV, and Titan Biotech Ltd. |
|
Market dynamics |
Parent market analysis, Market growth inducers and obstacles, Fast-growing and slow-growing segment analysis, COVID-19 impact and recovery analysis and future consumer dynamics, Market condition analysis for forecast period |
|
Customization purview |
If our report has not included the data that you are looking for, you can reach out to our analysts and get segments customized. |
Table of Contents
1 Executive Summary
- 1.1 Market overview
- Exhibit 01: Executive Summary – Chart on Market Overview
- Exhibit 02: Executive Summary – Data Table on Market Overview
- Exhibit 03: Executive Summary – Chart on Global Market Characteristics
- Exhibit 04: Executive Summary – Chart on Market by Geography
- Exhibit 05: Executive Summary – Chart on Market Segmentation by Application
- Exhibit 06: Executive Summary – Chart on Market Segmentation by Product
- Exhibit 07: Executive Summary – Chart on Incremental Growth
- Exhibit 08: Executive Summary – Data Table on Incremental Growth
- Exhibit 09: Executive Summary – Chart on Vendor Market Positioning
2 Market Landscape
- 2.1 Market ecosystem
- Exhibit 10: Parent market
- Exhibit 11: Market Characteristics
3 Market Sizing
- 3.1 Market definition
- Exhibit 12: Offerings of vendors included in the market definition
- 3.2 Market segment analysis
- Exhibit 13: Market segments
- 3.4 Market outlook: Forecast for 2022-2027
- Exhibit 14: Chart on Global – Market size and forecast 2022-2027 ($ million)
- Exhibit 15: Data Table on Global – Market size and forecast 2022-2027 ($ million)
- Exhibit 16: Chart on Global Market: Year-over-year growth 2022-2027 (%)
- Exhibit 17: Data Table on Global Market: Year-over-year growth 2022-2027 (%)
4 Historic Market Size
- 4.1 Global collagen market 2017 – 2021
- Exhibit 18: Historic Market Size – Data Table on global collagen market 2017 – 2021 ($ million)
- 4.2 Application Segment Analysis 2017 – 2021
- Exhibit 19: Historic Market Size – Application Segment 2017 – 2021 ($ million)
- 4.3 Product Segment Analysis 2017 – 2021
- Exhibit 20: Historic Market Size – Product Segment 2017 – 2021 ($ million)
- 4.4 Geography Segment Analysis 2017 – 2021
- Exhibit 21: Historic Market Size – Geography Segment 2017 – 2021 ($ million)
- 4.5 Country Segment Analysis 2017 – 2021
- Exhibit 22: Historic Market Size – Country Segment 2017 – 2021 ($ million)
5 Five Forces Analysis
- 5.1 Five forces summary
- Exhibit 23: Five forces analysis – Comparison between 2022 and 2027
- 5.2 Bargaining power of buyers
- Exhibit 24: Chart on Bargaining power of buyers – Impact of key factors 2022 and 2027
- 5.3 Bargaining power of suppliers
- Exhibit 25: Bargaining power of suppliers – Impact of key factors in 2022 and 2027
- 5.4 Threat of new entrants
- Exhibit 26: Threat of new entrants – Impact of key factors in 2022 and 2027
- 5.5 Threat of substitutes
- Exhibit 27: Threat of substitutes – Impact of key factors in 2022 and 2027
- 5.6 Threat of rivalry
- Exhibit 28: Threat of rivalry – Impact of key factors in 2022 and 2027
- 5.7 Market condition
- Exhibit 29: Chart on Market condition – Five forces 2022 and 2027
6 Market Segmentation by Application
- 6.1 Market segments
- Exhibit 30: Chart on Application – Market share 2022-2027 (%)
- Exhibit 31: Data Table on Application – Market share 2022-2027 (%)
- 6.2 Comparison by Application
- Exhibit 32: Chart on Comparison by Application
- Exhibit 33: Data Table on Comparison by Application
- 6.3 Food and beverage – Market size and forecast 2022-2027
- Exhibit 34: Chart on Food and beverage – Market size and forecast 2022-2027 ($ million)
- Exhibit 35: Data Table on Food and beverage – Market size and forecast 2022-2027 ($ million)
- Exhibit 36: Chart on Food and beverage – Year-over-year growth 2022-2027 (%)
- Exhibit 37: Data Table on Food and beverage – Year-over-year growth 2022-2027 (%)
- 6.4 Healthcare – Market size and forecast 2022-2027
- Exhibit 38: Chart on Healthcare – Market size and forecast 2022-2027 ($ million)
- Exhibit 39: Data Table on Healthcare – Market size and forecast 2022-2027 ($ million)
- Exhibit 40: Chart on Healthcare – Year-over-year growth 2022-2027 (%)
- Exhibit 41: Data Table on Healthcare – Year-over-year growth 2022-2027 (%)
- 6.5 Cosmetics – Market size and forecast 2022-2027
- Exhibit 42: Chart on Cosmetics – Market size and forecast 2022-2027 ($ million)
- Exhibit 43: Data Table on Cosmetics – Market size and forecast 2022-2027 ($ million)
- Exhibit 44: Chart on Cosmetics – Year-over-year growth 2022-2027 (%)
- Exhibit 45: Data Table on Cosmetics – Year-over-year growth 2022-2027 (%)
- 6.6 Others – Market size and forecast 2022-2027
- Exhibit 46: Chart on Others – Market size and forecast 2022-2027 ($ million)
- Exhibit 47: Data Table on Others – Market size and forecast 2022-2027 ($ million)
- Exhibit 48: Chart on Others – Year-over-year growth 2022-2027 (%)
- Exhibit 49: Data Table on Others – Year-over-year growth 2022-2027 (%)
- 6.7 Market opportunity by Application
- Exhibit 50: Market opportunity by Application ($ million)
- Exhibit 51: Data Table on Market opportunity by Application ($ million)
7 Market Segmentation by Product
- 7.1 Market segments
- Exhibit 52: Chart on Product – Market share 2022-2027 (%)
- Exhibit 53: Data Table on Product – Market share 2022-2027 (%)
- 7.2 Comparison by Product
- Exhibit 54: Chart on Comparison by Product
- Exhibit 55: Data Table on Comparison by Product
- 7.3 Gelatin – Market size and forecast 2022-2027
- Exhibit 56: Chart on Gelatin – Market size and forecast 2022-2027 ($ million)
- Exhibit 57: Data Table on Gelatin – Market size and forecast 2022-2027 ($ million)
- Exhibit 58: Chart on Gelatin – Year-over-year growth 2022-2027 (%)
- Exhibit 59: Data Table on Gelatin – Year-over-year growth 2022-2027 (%)
- 7.4 Hydrolyzed – Market size and forecast 2022-2027
- Exhibit 60: Chart on Hydrolyzed – Market size and forecast 2022-2027 ($ million)
- Exhibit 61: Data Table on Hydrolyzed – Market size and forecast 2022-2027 ($ million)
- Exhibit 62: Chart on Hydrolyzed – Year-over-year growth 2022-2027 (%)
- Exhibit 63: Data Table on Hydrolyzed – Year-over-year growth 2022-2027 (%)
- 7.5 Native – Market size and forecast 2022-2027
- Exhibit 64: Chart on Native – Market size and forecast 2022-2027 ($ million)
- Exhibit 65: Data Table on Native – Market size and forecast 2022-2027 ($ million)
- Exhibit 66: Chart on Native – Year-over-year growth 2022-2027 (%)
- Exhibit 67: Data Table on Native – Year-over-year growth 2022-2027 (%)
- 7.6 Market opportunity by Product
- Exhibit 68: Market opportunity by Product ($ million)
- Exhibit 69: Data Table on Market opportunity by Product ($ million)
8 Customer Landscape
- 8.1 Customer landscape overview
- Exhibit 70: Analysis of price sensitivity, lifecycle, customer purchase basket, adoption rates, and purchase criteria
9 Geographic Landscape
- 9.1 Geographic segmentation
- Exhibit 71: Chart on Market share by geography 2022-2027 (%)
- Exhibit 72: Data Table on Market share by geography 2022-2027 (%)
- 9.2 Geographic comparison
- Exhibit 73: Chart on Geographic comparison
- Exhibit 74: Data Table on Geographic comparison
- 9.3 North America – Market size and forecast 2022-2027
- Exhibit 75: Chart on North America – Market size and forecast 2022-2027 ($ million)
- Exhibit 76: Data Table on North America – Market size and forecast 2022-2027 ($ million)
- Exhibit 77: Chart on North America – Year-over-year growth 2022-2027 (%)
- Exhibit 78: Data Table on North America – Year-over-year growth 2022-2027 (%)
- 9.4 Europe – Market size and forecast 2022-2027
- Exhibit 79: Chart on Europe – Market size and forecast 2022-2027 ($ million)
- Exhibit 80: Data Table on Europe – Market size and forecast 2022-2027 ($ million)
- Exhibit 81: Chart on Europe – Year-over-year growth 2022-2027 (%)
- Exhibit 82: Data Table on Europe – Year-over-year growth 2022-2027 (%)
- 9.5 APAC – Market size and forecast 2022-2027
- Exhibit 83: Chart on APAC – Market size and forecast 2022-2027 ($ million)
- Exhibit 84: Data Table on APAC – Market size and forecast 2022-2027 ($ million)
- Exhibit 85: Chart on APAC – Year-over-year growth 2022-2027 (%)
- Exhibit 86: Data Table on APAC – Year-over-year growth 2022-2027 (%)
- 9.6 South America – Market size and forecast 2022-2027
- Exhibit 87: Chart on South America – Market size and forecast 2022-2027 ($ million)
- Exhibit 88: Data Table on South America – Market size and forecast 2022-2027 ($ million)
- Exhibit 89: Chart on South America – Year-over-year growth 2022-2027 (%)
- Exhibit 90: Data Table on South America – Year-over-year growth 2022-2027 (%)
- 9.7 Middle East and Africa – Market size and forecast 2022-2027
- Exhibit 91: Chart on Middle East and Africa – Market size and forecast 2022-2027 ($ million)
- Exhibit 92: Data Table on Middle East and Africa – Market size and forecast 2022-2027 ($ million)
- Exhibit 93: Chart on Middle East and Africa – Year-over-year growth 2022-2027 (%)
- Exhibit 94: Data Table on Middle East and Africa – Year-over-year growth 2022-2027 (%)
- 9.8 US – Market size and forecast 2022-2027
- Exhibit 95: Chart on US – Market size and forecast 2022-2027 ($ million)
- Exhibit 96: Data Table on US – Market size and forecast 2022-2027 ($ million)
- Exhibit 97: Chart on US – Year-over-year growth 2022-2027 (%)
- Exhibit 98: Data Table on US – Year-over-year growth 2022-2027 (%)
- 9.9 Germany – Market size and forecast 2022-2027
- Exhibit 99: Chart on Germany – Market size and forecast 2022-2027 ($ million)
- Exhibit 100: Data Table on Germany – Market size and forecast 2022-2027 ($ million)
- Exhibit 101: Chart on Germany – Year-over-year growth 2022-2027 (%)
- Exhibit 102: Data Table on Germany – Year-over-year growth 2022-2027 (%)
- 9.10 Japan – Market size and forecast 2022-2027
- Exhibit 103: Chart on Japan – Market size and forecast 2022-2027 ($ million)
- Exhibit 104: Data Table on Japan – Market size and forecast 2022-2027 ($ million)
- Exhibit 105: Chart on Japan – Year-over-year growth 2022-2027 (%)
- Exhibit 106: Data Table on Japan – Year-over-year growth 2022-2027 (%)
- 9.11 France – Market size and forecast 2022-2027
- Exhibit 107: Chart on France – Market size and forecast 2022-2027 ($ million)
- Exhibit 108: Data Table on France – Market size and forecast 2022-2027 ($ million)
- Exhibit 109: Chart on France – Year-over-year growth 2022-2027 (%)
- Exhibit 110: Data Table on France – Year-over-year growth 2022-2027 (%)
- 9.12 South Korea – Market size and forecast 2022-2027
- Exhibit 111: Chart on South Korea – Market size and forecast 2022-2027 ($ million)
- Exhibit 112: Data Table on South Korea – Market size and forecast 2022-2027 ($ million)
- Exhibit 113: Chart on South Korea – Year-over-year growth 2022-2027 (%)
- Exhibit 114: Data Table on South Korea – Year-over-year growth 2022-2027 (%)
- 9.13 Market opportunity by geography
- Exhibit 115: Market opportunity by geography ($ million)
- Exhibit 116: Data Tables on Market opportunity by geography ($ million)
10 Drivers, Challenges, and Trends
- 10.3 Impact of drivers and challenges
- Exhibit 117: Impact of drivers and challenges in 2022 and 2027
11 Vendor Landscape
- 11.2 Vendor landscape
- Exhibit 118: Overview on Criticality of inputs and Factors of differentiation
- 11.3 Landscape disruption
- Exhibit 119: Overview on factors of disruption
- 11.4 Industry risks
- Exhibit 120: Impact of key risks on business
12 Vendor Analysis
- 12.1 Vendors covered
- Exhibit 121: Vendors covered
- 12.2 Market positioning of vendors
- Exhibit 122: Matrix on vendor position and classification
- 12.3 Advanced BioMatrix Inc.
- Exhibit 123: Advanced BioMatrix Inc. – Overview
- Exhibit 124: Advanced BioMatrix Inc. – Product / Service
- Exhibit 125: Advanced BioMatrix Inc. – Key offerings
- 12.4 Ashland Inc.
- Exhibit 126: Ashland Inc. – Overview
- Exhibit 127: Ashland Inc. – Business segments
- Exhibit 128: Ashland Inc. – Key news
- Exhibit 129: Ashland Inc. – Key offerings
- Exhibit 130: Ashland Inc. – Segment focus
- 12.5 Collagen Matrix Inc.
- Exhibit 131: Collagen Matrix Inc. – Overview
- Exhibit 132: Collagen Matrix Inc. – Product / Service
- Exhibit 133: Collagen Matrix Inc. – Key offerings
- 12.6 Collagen Solutions Plc
- Exhibit 134: Collagen Solutions Plc – Overview
- Exhibit 135: Collagen Solutions Plc – Product / Service
- Exhibit 136: Collagen Solutions Plc – Key offerings
- 12.7 ConnOils LLC
- Exhibit 137: ConnOils LLC – Overview
- Exhibit 138: ConnOils LLC – Product / Service
- Exhibit 139: ConnOils LLC – Key offerings
- 12.8 Gelita AG
- Exhibit 140: Gelita AG – Overview
- Exhibit 141: Gelita AG – Product / Service
- Exhibit 142: Gelita AG – Key offerings
- 12.9 Junca Gelatines SL
- Exhibit 143: Junca Gelatines SL – Overview
- Exhibit 144: Junca Gelatines SL – Product / Service
- Exhibit 145: Junca Gelatines SL – Key offerings
- 12.10 Koninklijke DSM NV
- Exhibit 146: Koninklijke DSM NV – Overview
- Exhibit 147: Koninklijke DSM NV – Business segments
- Exhibit 148: Koninklijke DSM NV – Key news
- Exhibit 149: Koninklijke DSM NV – Key offerings
- Exhibit 150: Koninklijke DSM NV – Segment focus
- 12.11 Nippi Inc.
- Exhibit 151: Nippi Inc. – Overview
- Exhibit 152: Nippi Inc. – Product / Service
- Exhibit 153: Nippi Inc. – Key offerings
- 12.12 Nitta Gelatin Inc.
- Exhibit 154: Nitta Gelatin Inc. – Overview
- Exhibit 155: Nitta Gelatin Inc. – Product / Service
- Exhibit 156: Nitta Gelatin Inc. – Key offerings
- 12.13 Rousselot SDN. BHD.
- Exhibit 157: Rousselot SDN. BHD. – Overview
- Exhibit 158: Rousselot SDN. BHD. – Product / Service
- Exhibit 159: Rousselot SDN. BHD. – Key offerings
- 12.14 Sandesara Group of Companies
- Exhibit 160: Sandesara Group of Companies – Overview
- Exhibit 161: Sandesara Group of Companies – Product / Service
- Exhibit 162: Sandesara Group of Companies – Key offerings
- 12.15 SAS Gelatines Weishardt
- Exhibit 163: SAS Gelatines Weishardt – Overview
- Exhibit 164: SAS Gelatines Weishardt – Product / Service
- Exhibit 165: SAS Gelatines Weishardt – Key offerings
- 12.16 Symatese
- Exhibit 166: Symatese – Overview
- Exhibit 167: Symatese – Product / Service
- Exhibit 168: Symatese – Key offerings
- 12.17 Tessenderlo Group NV
- Exhibit 169: Tessenderlo Group NV – Overview
- Exhibit 170: Tessenderlo Group NV – Business segments
- Exhibit 171: Tessenderlo Group NV – Key offerings
- Exhibit 172: Tessenderlo Group NV – Segment focus
13 Appendix
- 13.2 Inclusions and exclusions checklist
- Exhibit 173: Inclusions checklist
- Exhibit 174: Exclusions checklist
- 13.3 Currency conversion rates for US$
- Exhibit 175: Currency conversion rates for US$
- 13.4 Research methodology
- Exhibit 176: Research methodology
- Exhibit 177: Validation techniques employed for market sizing
- Exhibit 178: Information sources
- 13.5 List of abbreviations
- Exhibit 179: List of abbreviations
About Us
Technavio is a leading global technology research and advisory company. Their research and analysis focuses on emerging market trends and provides actionable insights to help businesses identify market opportunities and develop effective strategies to optimize their market positions. With over 500 specialized analysts, Technavio’s report library consists of more than 17,000 reports and counting, covering 800 technologies, spanning across 50 countries. Their client base consists of enterprises of all sizes, including more than 100 Fortune 500 companies. This growing client base relies on Technavio’s comprehensive coverage, extensive research, and actionable market insights to identify opportunities in existing and potential markets and assess their competitive positions within changing market scenarios.
Contact
Technavio Research
Jesse Maida
Media & Marketing Executive
US: +1 844 364 1100
UK: +44 203 893 3200
Email: [email protected]
Website: www.technavio.com
SOURCE Technavio
