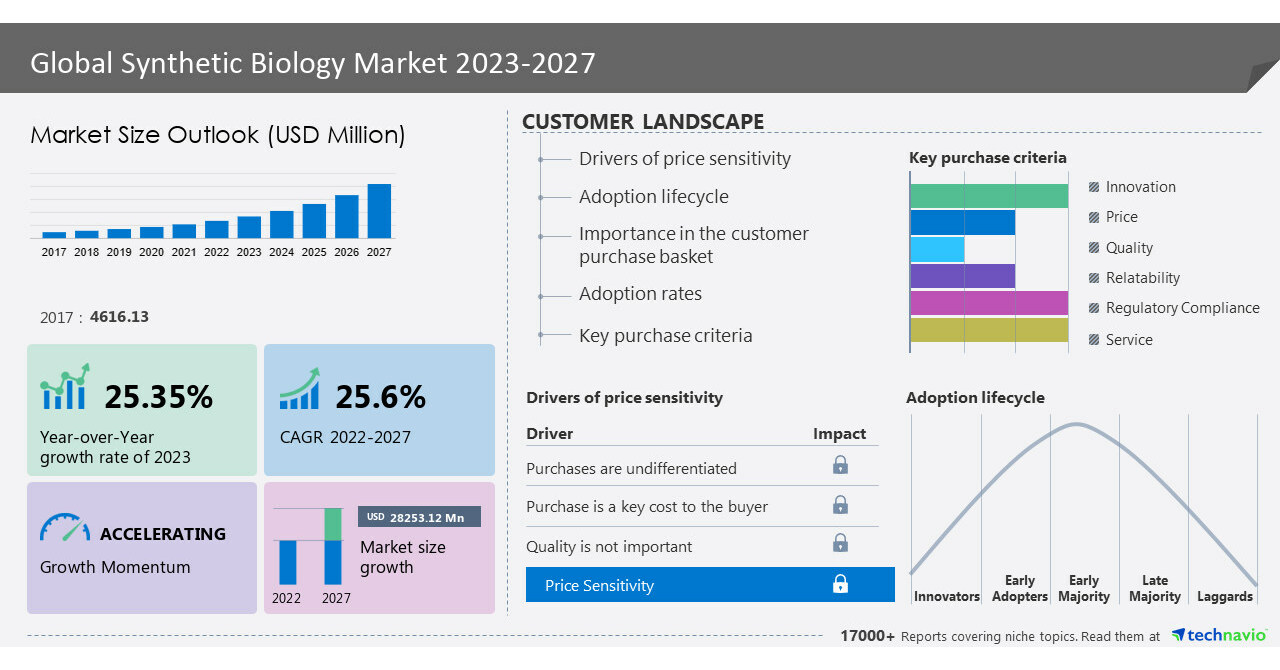
NEW YORK, June 21, 2023 /PRNewswire/ — The global synthetic biology market size is estimated to grow by USD 28,253.12 million from 2022 to 2027, according to Technavio. The market is estimated to grow at a CAGR of 25.6% during the forecast period. The growing applications of synthetic biology are driving the market growth. Synthetic biology helps improve the efficiency of products such as biochemicals, therapeutics, medicine, biofuels, and other bio-based substitutes. It can also be used in industries such as agriculture and F&B. For example, synthetic technology can be used to increase yield by enhancing properties such as efficient use of water and nutrients, nitrogen fixation and better resistance to pests, and photosynthetic performance.
However, technical challenges may impede the synthetic biology market growth. There are various issues related to the deployment of synthetic biology. Currently, there is insufficient knowledge and understanding of synthetic technology. For example, biological functions are determined by genetic circuits that are made of interacting proteins and genes. However, it is difficult to study the core design of the genes. These challenges will hinder the growth of the global synthetic biology market during the forecast period. For more insights on the historic data (2017 to 2021) and forecast market size (2023 to 2027) – Request a sample report
What’s New?
- Special coverage on the Russia–Ukraine war; global inflation; recovery analysis from COVID-19; supply chain disruptions, global trade tensions; and risk of recession
- Global competitiveness and key competitor positions
- Market presence across multiple geographical footprints – Strong/Active/Niche/Trivial – buy the report!
Synthetic biology market – Segmentation assessment
Segment overview
Technavio has segmented the market based on application (healthcare, industrial, food and agriculture, and others) and product (oligonucleotides, enzymes, cloning technology kits, xeno-nucleic acids, and chassis organism).
- The healthcare segment will account for a significant share of the market growth during the forecast period. Synthetic biology is used to create engineered systems of genes and other molecular components. Clinical applications of synthetic biology are expected to expand further in the next few years. For instance, professors at the Massachusetts Institute of Technology (MIT) have developed a paper that has embedded modified genetic machinery from a cell. These factors will drive the growth of this segment during the forecast period.
Geography overview
Based on geography, the global synthetic biology market is segmented into North America, Europe, Asia, and Rest of World (ROW). The report provides actionable insights and estimates the contribution of all regions to the growth of the global synthetic biology market.
- North America is estimated to account for 42% of the growth of the global market during the forecast period. The US and Canada are the key countries in the regional market. The demand for synthetic biology is expected to increase owing to factors such as rising investments in synthetic biology companies, increasing demand for bio-based products, and growing R&D funding. In addition, governments in the region are focusing on the development of personalized therapeutics. Thus, increasing support from government and private institutions is expected to drive the growth of the synthetic biology market in the region during the forecast period.
Insights on the market contribution of various segments, including country- and region-wise historic data (2017 to 2021) and forecast market size (2023 to 2027) – Download a sample report
Synthetic biology market – Leading trends influencing the market
- The evolving regulatory framework around synthetic biology is a key trend in the market.
- Governments of various countries are working on developing standard guidelines, clear policies, and stringent regulations to tackle the risks associated with synthetic biology.
- For instance, in the US, the Toxic Substances Control Act (TSCA) deals with the potential impact of synthetic biology in human health and the environment.
- Europe also has numerous policies at international, community, member state, and local levels.
- Therefore, the evolving regulatory framework for synthetic biology is expected to promote investments, foster innovation, and ensure the safety and efficacy of synthetic biology products, which, in turn, will support market growth during the forecast period.
Insights on market trends, historic period (2017 to 2021), and forecast period (2023 to 2027) – Request a sample report!
What are the key data covered in this synthetic biology market report?
- CAGR of the market during the forecast period
- Detailed information on factors that will drive the growth of the synthetic biology market between 2023 and 2027
- Precise estimation of the size of the synthetic biology market and its contribution to the parent market
- Accurate predictions about upcoming trends and changes in consumer behavior
- Growth of the synthetic biology market across North America, Europe, Asia, and Rest of World (ROW)
- A thorough analysis of the market’s competitive landscape and detailed information about vendors
- Comprehensive analysis of factors that will challenge the growth of synthetic biology market vendors
Gain instant access to 17,000+ market research reports.
Technavio’s SUBSCRIPTION platform
Related Reports:
The rapid microbiology testing market is estimated to grow at a CAGR of 9.31% between 2022 and 2027. The size of the market is forecasted to increase by USD 2,487.91 million. This report extensively covers market segmentation by method (growth-based, nucleic-acid-based, viability-based, and others), end-user (hospitals and diagnostic laboratories, pharmaceutical and biotechnology companies, and others), and geography (North America, Asia, Europe, and Rest of World (ROW)).
The microbiology testing market is estimated to grow at a CAGR of 9.98% between 2022 and 2027. The size of the market is forecasted to increase by USD 3,012.8 million. This report extensively covers market segmentation by method (traditional, rapid, and molecular), product (consumable and instruments), end-user (hospitals and diagnostic laboratories, pharmaceutical and biotechnology companies, and others), and geography (North America, Europe, Asia, and Rest of World).
|
Synthetic Biology Market Scope |
|
|
Report Coverage |
Details |
|
Base year |
2022 |
|
Historic period |
2017-2021 |
|
Forecast period |
2023-2027 |
|
Growth momentum & CAGR |
Accelerate at a CAGR of 25.6% |
|
Market growth 2023-2027 |
USD 28,253.12 million |
|
Market structure |
Fragmented |
|
YoY growth 2022-2023 (%) |
25.35 |
|
Regional analysis |
North America, Europe, Asia, and Rest of World (ROW) |
|
Performing market contribution |
North America at 42% |
|
Key countries |
US, UK, France, Germany, and China |
|
Competitive landscape |
Leading vendors, market positioning of vendors, competitive strategies, and industry risks |
|
Key companies profiled |
Agilent Technologies Inc., Algenol, Amyris Inc., CD Biosynsis, Codexis Inc., Creative Biogene, Eurofins Scientific SE, Genomatica Inc., GenScript Biotech Corp., Ginkgo Bioworks Holdings Inc., Illumina Inc., Merck KGaA, Novozymes AS, Sanofi SA, Twist Bioscience Corp., Danaher Corp., New England Biolabs Inc., Precigen Inc., Synthego Corp., and Thermo Fisher Scientific Inc. |
|
Market dynamics |
Parent market analysis, market growth inducers and obstacles, fast-growing and slow-growing segment analysis, COVID-19 impact and recovery analysis and future consumer dynamics, and market condition analysis for the forecast period. |
|
Customization purview |
If our report has not included the data that you are looking for, you can reach out to our analysts and get segments customized. |
Browse for Technavio health care market reports
Table of contents
1 Executive Summary
- 1.1 Market overview
- Exhibit 01: Executive Summary – Chart on Market Overview
- Exhibit 02: Executive Summary – Data Table on Market Overview
- Exhibit 03: Executive Summary – Chart on Global Market Characteristics
- Exhibit 04: Executive Summary – Chart on Market by Geography
- Exhibit 05: Executive Summary – Chart on Market Segmentation by Application
- Exhibit 06: Executive Summary – Chart on Market Segmentation by Product
- Exhibit 07: Executive Summary – Chart on Incremental Growth
- Exhibit 08: Executive Summary – Data Table on Incremental Growth
- Exhibit 09: Executive Summary – Chart on Vendor Market Positioning
2 Market Landscape
- 2.1 Market ecosystem
- Exhibit 10: Parent market
- Exhibit 11: Market Characteristics
3 Market Sizing
- 3.1 Market definition
- Exhibit 12: Offerings of vendors included in the market definition
- 3.2 Market segment analysis
- Exhibit 13: Market segments
- 3.4 Market outlook: Forecast for 2022-2027
- Exhibit 14: Chart on Global – Market size and forecast 2022-2027 ($ million)
- Exhibit 15: Data Table on Global – Market size and forecast 2022-2027 ($ million)
- Exhibit 16: Chart on Global Market: Year-over-year growth 2022-2027 (%)
- Exhibit 17: Data Table on Global Market: Year-over-year growth 2022-2027 (%)
4 Historic Market Size
- 4.1 Global synthetic biology market 2017 – 2021
- Exhibit 18: Historic Market Size – Data Table on Global synthetic biology market 2017 – 2021 ($ million)
- 4.2 Application Segment Analysis 2017 – 2021
- Exhibit 19: Historic Market Size – Application Segment 2017 – 2021 ($ million)
- 4.3 Product Segment Analysis 2017 – 2021
- Exhibit 20: Historic Market Size – Product Segment 2017 – 2021 ($ million)
- 4.4 Geography Segment Analysis 2017 – 2021
- Exhibit 21: Historic Market Size – Geography Segment 2017 – 2021 ($ million)
- 4.5 Country Segment Analysis 2017 – 2021
- Exhibit 22: Historic Market Size – Country Segment 2017 – 2021 ($ million)
5 Five Forces Analysis
- 5.1 Five forces summary
- Exhibit 23: Five forces analysis – Comparison between 2022 and 2027
- 5.2 Bargaining power of buyers
- Exhibit 24: Chart on Bargaining power of buyers – Impact of key factors 2022 and 2027
- 5.3 Bargaining power of suppliers
- Exhibit 25: Bargaining power of suppliers – Impact of key factors in 2022 and 2027
- 5.4 Threat of new entrants
- Exhibit 26: Threat of new entrants – Impact of key factors in 2022 and 2027
- 5.5 Threat of substitutes
- Exhibit 27: Threat of substitutes – Impact of key factors in 2022 and 2027
- 5.6 Threat of rivalry
- Exhibit 28: Threat of rivalry – Impact of key factors in 2022 and 2027
- 5.7 Market condition
- Exhibit 29: Chart on Market condition – Five forces 2022 and 2027
6 Market Segmentation by Application
- 6.1 Market segments
- Exhibit 30: Chart on Application – Market share 2022-2027 (%)
- Exhibit 31: Data Table on Application – Market share 2022-2027 (%)
- 6.2 Comparison by Application
- Exhibit 32: Chart on Comparison by Application
- Exhibit 33: Data Table on Comparison by Application
- 6.3 Healthcare – Market size and forecast 2022-2027
- Exhibit 34: Chart on Healthcare – Market size and forecast 2022-2027 ($ million)
- Exhibit 35: Data Table on Healthcare – Market size and forecast 2022-2027 ($ million)
- Exhibit 36: Chart on Healthcare – Year-over-year growth 2022-2027 (%)
- Exhibit 37: Data Table on Healthcare – Year-over-year growth 2022-2027 (%)
- 6.4 Industrial – Market size and forecast 2022-2027
- Exhibit 38: Chart on Industrial – Market size and forecast 2022-2027 ($ million)
- Exhibit 39: Data Table on Industrial – Market size and forecast 2022-2027 ($ million)
- Exhibit 40: Chart on Industrial – Year-over-year growth 2022-2027 (%)
- Exhibit 41: Data Table on Industrial – Year-over-year growth 2022-2027 (%)
- 6.5 Food and agriculture – Market size and forecast 2022-2027
- Exhibit 42: Chart on Food and agriculture – Market size and forecast 2022-2027 ($ million)
- Exhibit 43: Data Table on Food and agriculture – Market size and forecast 2022-2027 ($ million)
- Exhibit 44: Chart on Food and agriculture – Year-over-year growth 2022-2027 (%)
- Exhibit 45: Data Table on Food and agriculture – Year-over-year growth 2022-2027 (%)
- 6.6 Others – Market size and forecast 2022-2027
- Exhibit 46: Chart on Others – Market size and forecast 2022-2027 ($ million)
- Exhibit 47: Data Table on Others – Market size and forecast 2022-2027 ($ million)
- Exhibit 48: Chart on Others – Year-over-year growth 2022-2027 (%)
- Exhibit 49: Data Table on Others – Year-over-year growth 2022-2027 (%)
- 6.7 Market opportunity by Application
- Exhibit 50: Market opportunity by Application ($ million)
7 Market Segmentation by Product
- 7.1 Market segments
- Exhibit 51: Chart on Product – Market share 2022-2027 (%)
- Exhibit 52: Data Table on Product – Market share 2022-2027 (%)
- 7.2 Comparison by Product
- Exhibit 53: Chart on Comparison by Product
- Exhibit 54: Data Table on Comparison by Product
- 7.3 Oligonucleotides – Market size and forecast 2022-2027
- Exhibit 55: Chart on Oligonucleotides – Market size and forecast 2022-2027 ($ million)
- Exhibit 56: Data Table on Oligonucleotides – Market size and forecast 2022-2027 ($ million)
- Exhibit 57: Chart on Oligonucleotides – Year-over-year growth 2022-2027 (%)
- Exhibit 58: Data Table on Oligonucleotides – Year-over-year growth 2022-2027 (%)
- 7.4 Enzymes – Market size and forecast 2022-2027
- Exhibit 59: Chart on Enzymes – Market size and forecast 2022-2027 ($ million)
- Exhibit 60: Data Table on Enzymes – Market size and forecast 2022-2027 ($ million)
- Exhibit 61: Chart on Enzymes – Year-over-year growth 2022-2027 (%)
- Exhibit 62: Data Table on Enzymes – Year-over-year growth 2022-2027 (%)
- 7.5 Cloning technology kits – Market size and forecast 2022-2027
- Exhibit 63: Chart on Cloning technology kits – Market size and forecast 2022-2027 ($ million)
- Exhibit 64: Data Table on Cloning technology kits – Market size and forecast 2022-2027 ($ million)
- Exhibit 65: Chart on Cloning technology kits – Year-over-year growth 2022-2027 (%)
- Exhibit 66: Data Table on Cloning technology kits – Year-over-year growth 2022-2027 (%)
- 7.6 Xeno-nucleic acids – Market size and forecast 2022-2027
- Exhibit 67: Chart on Xeno-nucleic acids – Market size and forecast 2022-2027 ($ million)
- Exhibit 68: Data Table on Xeno-nucleic acids – Market size and forecast 2022-2027 ($ million)
- Exhibit 69: Chart on Xeno-nucleic acids – Year-over-year growth 2022-2027 (%)
- Exhibit 70: Data Table on Xeno-nucleic acids – Year-over-year growth 2022-2027 (%)
- 7.7 Chassis organism – Market size and forecast 2022-2027
- Exhibit 71: Chart on Chassis organism – Market size and forecast 2022-2027 ($ million)
- Exhibit 72: Data Table on Chassis organism – Market size and forecast 2022-2027 ($ million)
- Exhibit 73: Chart on Chassis organism – Year-over-year growth 2022-2027 (%)
- Exhibit 74: Data Table on Chassis organism – Year-over-year growth 2022-2027 (%)
- 7.8 Market opportunity by Product
- Exhibit 75: Market opportunity by Product ($ million)
8 Customer Landscape
- 8.1 Customer landscape overview
- Exhibit 76: Analysis of price sensitivity, lifecycle, customer purchase basket, adoption rates, and purchase criteria
9 Geographic Landscape
- 9.1 Geographic segmentation
- Exhibit 77: Chart on Market share by geography 2022-2027 (%)
- Exhibit 78: Data Table on Market share by geography 2022-2027 (%)
- 9.2 Geographic comparison
- Exhibit 79: Chart on Geographic comparison
- Exhibit 80: Data Table on Geographic comparison
- 9.3 North America – Market size and forecast 2022-2027
- Exhibit 81: Chart on North America – Market size and forecast 2022-2027 ($ million)
- Exhibit 82: Data Table on North America – Market size and forecast 2022-2027 ($ million)
- Exhibit 83: Chart on North America – Year-over-year growth 2022-2027 (%)
- Exhibit 84: Data Table on North America – Year-over-year growth 2022-2027 (%)
- 9.4 Europe – Market size and forecast 2022-2027
- Exhibit 85: Chart on Europe – Market size and forecast 2022-2027 ($ million)
- Exhibit 86: Data Table on Europe – Market size and forecast 2022-2027 ($ million)
- Exhibit 87: Chart on Europe – Year-over-year growth 2022-2027 (%)
- Exhibit 88: Data Table on Europe – Year-over-year growth 2022-2027 (%)
- 9.5 Asia – Market size and forecast 2022-2027
- Exhibit 89: Chart on Asia – Market size and forecast 2022-2027 ($ million)
- Exhibit 90: Data Table on Asia – Market size and forecast 2022-2027 ($ million)
- Exhibit 91: Chart on Asia – Year-over-year growth 2022-2027 (%)
- Exhibit 92: Data Table on Asia – Year-over-year growth 2022-2027 (%)
- 9.6 Rest of World (ROW) – Market size and forecast 2022-2027
- Exhibit 93: Chart on Rest of World (ROW) – Market size and forecast 2022-2027 ($ million)
- Exhibit 94: Data Table on Rest of World (ROW) – Market size and forecast 2022-2027 ($ million)
- Exhibit 95: Chart on Rest of World (ROW) – Year-over-year growth 2022-2027 (%)
- Exhibit 96: Data Table on Rest of World (ROW) – Year-over-year growth 2022-2027 (%)
- 9.7 US – Market size and forecast 2022-2027
- Exhibit 97: Chart on US – Market size and forecast 2022-2027 ($ million)
- Exhibit 98: Data Table on US – Market size and forecast 2022-2027 ($ million)
- Exhibit 99: Chart on US – Year-over-year growth 2022-2027 (%)
- Exhibit 100: Data Table on US – Year-over-year growth 2022-2027 (%)
- 9.8 UK – Market size and forecast 2022-2027
- Exhibit 101: Chart on UK – Market size and forecast 2022-2027 ($ million)
- Exhibit 102: Data Table on UK – Market size and forecast 2022-2027 ($ million)
- Exhibit 103: Chart on UK – Year-over-year growth 2022-2027 (%)
- Exhibit 104: Data Table on UK – Year-over-year growth 2022-2027 (%)
- 9.9 China – Market size and forecast 2022-2027
- Exhibit 105: Chart on China – Market size and forecast 2022-2027 ($ million)
- Exhibit 106: Data Table on China – Market size and forecast 2022-2027 ($ million)
- Exhibit 107: Chart on China – Year-over-year growth 2022-2027 (%)
- Exhibit 108: Data Table on China – Year-over-year growth 2022-2027 (%)
- 9.10 France – Market size and forecast 2022-2027
- Exhibit 109: Chart on France – Market size and forecast 2022-2027 ($ million)
- Exhibit 110: Data Table on France – Market size and forecast 2022-2027 ($ million)
- Exhibit 111: Chart on France – Year-over-year growth 2022-2027 (%)
- Exhibit 112: Data Table on France – Year-over-year growth 2022-2027 (%)
- 9.11 Germany – Market size and forecast 2022-2027
- Exhibit 113: Chart on Germany – Market size and forecast 2022-2027 ($ million)
- Exhibit 114: Data Table on Germany – Market size and forecast 2022-2027 ($ million)
- Exhibit 115: Chart on Germany – Year-over-year growth 2022-2027 (%)
- Exhibit 116: Data Table on Germany – Year-over-year growth 2022-2027 (%)
- 9.12 Market opportunity by geography
- Exhibit 117: Market opportunity by geography ($ million)
10 Drivers, Challenges, and Trends
- 10.3 Impact of drivers and challenges
- Exhibit 118: Impact of drivers and challenges in 2022 and 2027
11 Vendor Landscape
- 11.2 Vendor landscape
- Exhibit 119: Overview on Criticality of inputs and Factors of differentiation
- 11.3 Landscape disruption
- Exhibit 120: Overview on factors of disruption
- 11.4 Industry risks
- Exhibit 121: Impact of key risks on business
12 Vendor Analysis
- 12.1 Vendors covered
- Exhibit 122: Vendors covered
- 12.2 Market positioning of vendors
- Exhibit 123: Matrix on vendor position and classification
- 12.3 Agilent Technologies Inc.
- Exhibit 124: Agilent Technologies Inc. – Overview
- Exhibit 125: Agilent Technologies Inc. – Business segments
- Exhibit 126: Agilent Technologies Inc. – Key news
- Exhibit 127: Agilent Technologies Inc. – Key offerings
- Exhibit 128: Agilent Technologies Inc. – Segment focus
- 12.4 Algenol
- Exhibit 129: Algenol – Overview
- Exhibit 130: Algenol – Product / Service
- Exhibit 131: Algenol – Key offerings
- 12.5 Amyris Inc.
- Exhibit 132: Amyris Inc. – Overview
- Exhibit 133: Amyris Inc. – Product / Service
- Exhibit 134: Amyris Inc. – Key offerings
- 12.6 Codexis Inc.
- Exhibit 135: Codexis Inc. – Overview
- Exhibit 136: Codexis Inc. – Business segments
- Exhibit 137: Codexis Inc. – Key offerings
- Exhibit 138: Codexis Inc. – Segment focus
- 12.7 Danaher Corp.
- Exhibit 139: Danaher Corp. – Overview
- Exhibit 140: Danaher Corp. – Business segments
- Exhibit 141: Danaher Corp. – Key news
- Exhibit 142: Danaher Corp. – Key offerings
- Exhibit 143: Danaher Corp. – Segment focus
- 12.8 Genomatica Inc.
- Exhibit 144: Genomatica Inc. – Overview
- Exhibit 145: Genomatica Inc. – Product / Service
- Exhibit 146: Genomatica Inc. – Key offerings
- 12.9 GenScript Biotech Corp.
- Exhibit 147: GenScript Biotech Corp. – Overview
- Exhibit 148: GenScript Biotech Corp. – Business segments
- Exhibit 149: GenScript Biotech Corp. – Key news
- Exhibit 150: GenScript Biotech Corp. – Key offerings
- Exhibit 151: GenScript Biotech Corp. – Segment focus
- 12.10 Ginkgo Bioworks Holdings Inc.
- Exhibit 152: Ginkgo Bioworks Holdings Inc. – Overview
- Exhibit 153: Ginkgo Bioworks Holdings Inc. – Product / Service
- Exhibit 154: Ginkgo Bioworks Holdings Inc. – Key offerings
- 12.11 Merck KGaA
- Exhibit 155: Merck KGaA – Overview
- Exhibit 156: Merck KGaA – Business segments
- Exhibit 157: Merck KGaA – Key news
- Exhibit 158: Merck KGaA – Key offerings
- Exhibit 159: Merck KGaA – Segment focus
- 12.12 New England Biolabs Inc.
- Exhibit 160: New England Biolabs Inc. – Overview
- Exhibit 161: New England Biolabs Inc. – Product / Service
- Exhibit 162: New England Biolabs Inc. – Key offerings
- 12.13 Novozymes AS
- Exhibit 163: Novozymes AS – Overview
- Exhibit 164: Novozymes AS – Business segments
- Exhibit 165: Novozymes AS – Key news
- Exhibit 166: Novozymes AS – Key offerings
- Exhibit 167: Novozymes AS – Segment focus
- 12.14 Sanofi SA
- Exhibit 168: Sanofi SA – Overview
- Exhibit 169: Sanofi SA – Business segments
- Exhibit 170: Sanofi SA – Key news
- Exhibit 171: Sanofi SA – Key offerings
- Exhibit 172: Sanofi SA – Segment focus
- 12.15 Synthego Corp.
- Exhibit 173: Synthego Corp. – Overview
- Exhibit 174: Synthego Corp. – Product / Service
- Exhibit 175: Synthego Corp. – Key offerings
- 12.16 Thermo Fisher Scientific Inc.
- Exhibit 176: Thermo Fisher Scientific Inc. – Overview
- Exhibit 177: Thermo Fisher Scientific Inc. – Business segments
- Exhibit 178: Thermo Fisher Scientific Inc. – Key news
- Exhibit 179: Thermo Fisher Scientific Inc. – Key offerings
- Exhibit 180: Thermo Fisher Scientific Inc. – Segment focus
- 12.17 Twist Bioscience Corp.
- Exhibit 181: Twist Bioscience Corp. – Overview
- Exhibit 182: Twist Bioscience Corp. – Product / Service
- Exhibit 183: Twist Bioscience Corp. – Key offerings
13 Appendix
- 13.2 Inclusions and exclusions checklist
- Exhibit 184: Inclusions checklist
- Exhibit 185: Exclusions checklist
- 13.3 Currency conversion rates for US$
- Exhibit 186: Currency conversion rates for US$
- 13.4 Research methodology
- Exhibit 187: Research methodology
- Exhibit 188: Validation techniques employed for market sizing
- Exhibit 189: Information sources
- 13.5 List of abbreviations
- Exhibit 190: List of abbreviations
About Us
Technavio is a leading global technology research and advisory company. Their research and analysis focus on emerging market trends and provide actionable insights to help businesses identify market opportunities and develop effective strategies to optimize their market positions. With over 500 specialized analysts, Technavio’s report library consists of more than 17,000 reports and counting, covering 800 technologies, spanning across 50 countries. Their client base consists of enterprises of all sizes, including more than 100 Fortune 500 companies. This growing client base relies on Technavio’s comprehensive coverage, extensive research, and actionable market insights to identify opportunities in existing and potential markets and assess their competitive positions within changing market scenarios.
Contact
Technavio Research
Jesse Maida
Media & Marketing Executive
US: +1 844 364 1100
UK: +44 203 893 3200
Email: [email protected]
Website: www.technavio.com/
SOURCE Technavio
