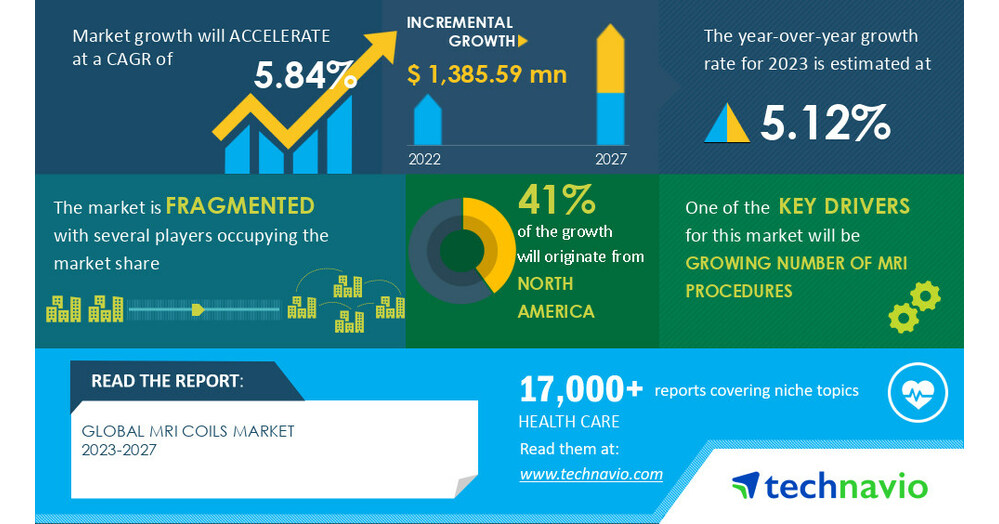
NEW YORK, May 12, 2023 /PRNewswire/ — The MRI coils market size is set to grow by USD 1,385.59 million between 2022 and 2027 and register a CAGR of 5.84%, according to Technavio’s latest market research report estimates. With a focus on identifying dominant industry influencers, Technavio’s reports present a detailed study by way of synthesis, and summation of data from multiple sources. This report offers an up-to-date analysis of the current market scenario, the latest trends and drivers, and the overall market environment. View Sample Report
The growing number of MRI procedures, the rising demand for non-invasive diagnostic procedures, and the growing aging population and chronic disease incidences will offer immense growth opportunities. To leverage the current opportunities, market vendors must strengthen their foothold in the fast-growing segments while maintaining their positions in the slow-growing segments.
MRI Coils Market 2023-2027: Segmentation
- Type
- End-user
- Hospitals
- Diagnostic Imaging Centers
- Ambulatory Care Centers
- Geography
- North America
- Europe
- Asia
- Rest of World (ROW)
By type, the market growth in the adult segment will be significant over the forecast period. MRI coils for adults are integrated with the transmitter at one end and a receiver at another end. This allows homogenous distribution of the radiofrequency signal in the MRI scanner. These coils provide high-quality images of body extremities such as the head, heart, elbow, joint, breast, thorax, foot, abdomen, neck, and spine to diagnose diseases such as tumors. These factors coupled with the increased number of vendors offering MRI coils for adults are driving the growth of the segment.
North America will account for 41% of the market growth during the forecast period. The growth of the regional market can be attributed to factors such as rising capital expenditure on healthcare, the growing geriatric population, and the increasing prevalence of chronic disease. Also, The increased adoption of technologically advanced diagnostic devices for early disease detection and screening by healthcare providers and rising government funding for R&D activities targeted at developing light and flexible MRI coils are other major factors driving the growth of the MRI coils market in North America.
The report comprises of various segments as well as analysis of the trends and factors that are playing a substantial role in the market, download a sample report
MRI Coils Market 2023-2027: Vendor Analysis and Scope
The global MRI coils market is fragmented with the presence of several vendors. The competition in the market is intense with vendors focusing on increasing investments, acquisitions, and initiatives to spread awareness about available imaging diagnostic techniques. Vendors are also increasingly investing in R&D, expanding their business presence, and entering into partnership agreements to advance their technologies and produce upgraded MRI coils.
Key products offered by a few prominent vendors are as follows:
- Agilent Technologies Inc.: The company offers MRI coils called superconducting shim coils used for NMR Imaging.
- AURORA HEALTHCARE US Corp.: The company offers MRI coils called Aurora RF coils..
- Bruker Corp.: The company offers MRI coils called MRI RF coils with color coded plugs and integrated preamplifiers.
Some of the key vendors covered in the report include:
- Canon Medical Systems Corp.
- Esaote Spa
- General Electric Co.
- Hitachi Ltd.
- Hologic Inc.
- Koninklijke Philips NV
- MR Instruments Inc.
- RAPID MR International LLC
- ScanMed LLC
- Shimadzu Corp.
- Siemens Healthineers AG
- Time Medical
Why Buy?
- Add credibility to strategy
- Analyzes competitor’s offerings
- Get a holistic view of the market
Grow your profit margin with Technavio – Buy the Report
The report also covers the following areas:
MRI Coils Market 2023-2027: Key Highlights
- Driver – The market is driven by the growing number of MRI procedures. MRI scans do not involve the use of strong radiation like CT scans and X-rays. MRI scan is used to detect minimal changes in body structures with high accuracy for the diagnosis of various conditions. It can also trace the blood flow in organs and blood vessels and swelling and inflammation of body parts through 3D and cross-section images. Such benefits have increased the preference for MRI scans over other imaging types in healthcare facilities. For instance, in 2018, 912.7 out of 1,000 people in OECD countries underwent MRI procedures in hospitals and ASCs. In addition, the high disposable income and spending and increasing incidences of chronic diseases in these countries will fuel the growth of the MRI coils market during the forecast period.
- Trend – The availability of custom MRI coils is identified as the key trend in the market. Vendors in the market are focused on the development of customized MRI coils to improve patient care. For instance, RAPID MR International offers custom-made, economical, and efficient RF Coils for MRI in clinical studies. Besides, some researchers are focusing on performing clinical trials on custom RF coils. For instance, researchers at the University of Washington developed different custom RF coils with high-resolution imaging at 1.5T and 3T for the temporal lobes of the brain, carotid arteries, peripheral nerves, brachial plexus, wrist, neck, torso, pelvis, and heart. Such developments will positively influence the growth of the market during the forecast period.
- Challenge – The high cost of MRI coils is identified as the major challenge hindering the growth of the market. The expensive nature of MRI coils increases the cost of diagnostics tests. This discourages most patients from opting for such diagnostics due to low affordability. In addition, the burden of radiologists’ fees, equipment fees, hospital fees, and inpatient imaging fees further discourage patients from getting diagnosed with MRI. Moreover, the high cost of MRI coils makes them less accessible and unaffordable for hospitals and primary healthcare providers with limited budgets. All these factors hinder the growth of the market in focus.
Gain instant access to 17,000+ market research reports.
Technavio’s SUBSCRIPTION platform
MRI Coils Market 2023-2027: Key Highlights
- CAGR of the market during the forecast period 2023-2027
- Detailed information on factors that will assist MRI coils market growth during the next five years
- Estimation of the MRI coils market size and its contribution to the parent market
- Predictions on upcoming trends and changes in consumer behavior
- The growth of the MRI coils market
- Analysis of the market’s competitive landscape and detailed information on vendors
- Comprehensive details of factors that will challenge the growth of MRI coils market vendors
Related Reports:
The medical imaging market size is estimated to grow at a CAGR of 5.7% between 2022 and 2027. The size of the market is forecast to increase by USD 12.87 billion. The market is segmented by the increasing prevalence of chronic conditions is notably driving the medical imaging market growth, although factors such as high costs associated with medical imaging may impede the market growth.
The bone biopsy market is estimated to grow at a CAGR of 7.74% between 2022 and 2027. The size of the market is forecast to increase by USD 76.77 million. The rising prevalence of cancer is notably driving the market growth, although factors such as the risk of infections associated with the use of biopsy needles may impede the market growth.
|
MRI Coils Market Scope |
|
|
Report Coverage |
Details |
|
Base year |
2022 |
|
Historic period |
2017-2021 |
|
Forecast period |
2023-2027 |
|
Growth momentum & CAGR |
Accelerate at a CAGR of 5.84% |
|
Market growth 2023-2027 |
USD 1,385.59 million |
|
Market structure |
Fragmented |
|
YoY growth 2022-2023(%) |
5.12 |
|
Regional analysis |
North America, Europe, Asia, and Rest of World (ROW) |
|
Performing market contribution |
North America at 41% |
|
Key countries |
US, Germany, France, Japan, and China |
|
Competitive landscape |
Leading Vendors, Market Positioning of Vendors, Competitive Strategies, and Industry Risks |
|
Key companies profiled |
Abbott Laboratories, Agilent Technologies Inc., AURORA HEALTHCARE US Corp., Bruker Corp., Canon Medical Systems Corp., Esaote Spa, General Electric Co., Hitachi Ltd., Hologic Inc., Kaneka Corp., Koninklijke Philips NV, MicroPort Scientific Corp., MR Instruments Inc., RAPID MR International LLC, ScanMed LLC, Shimadzu Corp., Siemens Healthineers AG, Terumo Medical Corp., Time Medical, and Wallaby Medical Holding Inc. |
|
Market dynamics |
Parent market analysis, market growth inducers and obstacles, fast-growing and slow-growing segment analysis, COVID-19 impact and recovery analysis and future consumer dynamics, and market condition analysis for the forecast period. |
|
Customization purview |
If our report has not included the data that you are looking for, you can reach out to our analysts and get segments customized. |
Table of contents:
1 Executive Summary
- 1.1 Market overview
- Exhibit 01: Executive Summary – Chart on Market Overview
- Exhibit 02: Executive Summary – Data Table on Market Overview
- Exhibit 03: Executive Summary – Chart on Global Market Characteristics
- Exhibit 04: Executive Summary – Chart on Market by Geography
- Exhibit 05: Executive Summary – Chart on Market Segmentation by Type
- Exhibit 06: Executive Summary – Chart on Market Segmentation by End-user
- Exhibit 07: Executive Summary – Chart on Incremental Growth
- Exhibit 08: Executive Summary – Data Table on Incremental Growth
- Exhibit 09: Executive Summary – Chart on Vendor Market Positioning
2 Market Landscape
- 2.1 Market ecosystem
- Exhibit 10: Parent market
- Exhibit 11: Market Characteristics
3 Market Sizing
- 3.1 Market definition
- Exhibit 12: Offerings of vendors included in the market definition
- 3.2 Market segment analysis
- Exhibit 13: Market segments
- 3.4 Market outlook: Forecast for 2022-2027
- Exhibit 14: Chart on Global – Market size and forecast 2022-2027 ($ million)
- Exhibit 15: Data Table on Global – Market size and forecast 2022-2027 ($ million)
- Exhibit 16: Chart on Global Market: Year-over-year growth 2022-2027 (%)
- Exhibit 17: Data Table on Global Market: Year-over-year growth 2022-2027 (%)
4 Historic Market Size
- 4.1 Global MRI coils market 2017 – 2021
- Exhibit 18: Historic Market Size – Data Table on Global MRI coils market 2017 – 2021 ($ million)
- 4.2 Type Segment Analysis 2017 – 2021
- Exhibit 19: Historic Market Size – Type Segment 2017 – 2021 ($ million)
- 4.3 End User Segment Analysis 2017 – 2021
- Exhibit 20: Historic Market Size – End User Segment 2017 – 2021 ($ million)
- 4.4 Geography Segment Analysis 2017 – 2021
- Exhibit 21: Historic Market Size – Geography Segment 2017 – 2021 ($ million)
- 4.5 Country Segment Analysis 2017 – 2021
- Exhibit 22: Historic Market Size – Country Segment 2017 – 2021 ($ million)
5 Five Forces Analysis
- 5.1 Five forces summary
- Exhibit 23: Five forces analysis – Comparison between 2022 and 2027
- 5.2 Bargaining power of buyers
- Exhibit 24: Chart on Bargaining power of buyers – Impact of key factors 2022 and 2027
- 5.3 Bargaining power of suppliers
- Exhibit 25: Bargaining power of suppliers – Impact of key factors in 2022 and 2027
- 5.4 Threat of new entrants
- Exhibit 26: Threat of new entrants – Impact of key factors in 2022 and 2027
- 5.5 Threat of substitutes
- Exhibit 27: Threat of substitutes – Impact of key factors in 2022 and 2027
- 5.6 Threat of rivalry
- Exhibit 28: Threat of rivalry – Impact of key factors in 2022 and 2027
- 5.7 Market condition
- Exhibit 29: Chart on Market condition – Five forces 2022 and 2027
6 Market Segmentation by Type
- 6.1 Market segments
- Exhibit 30: Chart on Type – Market share 2022-2027 (%)
- Exhibit 31: Data Table on Type – Market share 2022-2027 (%)
- 6.2 Comparison by Type
- Exhibit 32: Chart on Comparison by Type
- Exhibit 33: Data Table on Comparison by Type
- 6.3 Adult – Market size and forecast 2022-2027
- Exhibit 34: Chart on Adult – Market size and forecast 2022-2027 ($ million)
- Exhibit 35: Data Table on Adult – Market size and forecast 2022-2027 ($ million)
- Exhibit 36: Chart on Adult – Year-over-year growth 2022-2027 (%)
- Exhibit 37: Data Table on Adult – Year-over-year growth 2022-2027 (%)
- 6.4 Pediatric – Market size and forecast 2022-2027
- Exhibit 38: Chart on Pediatric – Market size and forecast 2022-2027 ($ million)
- Exhibit 39: Data Table on Pediatric – Market size and forecast 2022-2027 ($ million)
- Exhibit 40: Chart on Pediatric – Year-over-year growth 2022-2027 (%)
- Exhibit 41: Data Table on Pediatric – Year-over-year growth 2022-2027 (%)
- 6.5 Market opportunity by Type
- Exhibit 42: Market opportunity by Type ($ million)
7 Market Segmentation by End-user
- 7.1 Market segments
- Exhibit 43: Chart on End-user – Market share 2022-2027 (%)
- Exhibit 44: Data Table on End-user – Market share 2022-2027 (%)
- 7.2 Comparison by End-user
- Exhibit 45: Chart on Comparison by End-user
- Exhibit 46: Data Table on Comparison by End-user
- 7.3 Hospitals – Market size and forecast 2022-2027
- Exhibit 47: Chart on Hospitals – Market size and forecast 2022-2027 ($ million)
- Exhibit 48: Data Table on Hospitals – Market size and forecast 2022-2027 ($ million)
- Exhibit 49: Chart on Hospitals – Year-over-year growth 2022-2027 (%)
- Exhibit 50: Data Table on Hospitals – Year-over-year growth 2022-2027 (%)
- 7.4 Diagnostic imaging centers – Market size and forecast 2022-2027
- Exhibit 51: Chart on Diagnostic imaging centers – Market size and forecast 2022-2027 ($ million)
- Exhibit 52: Data Table on Diagnostic imaging centers – Market size and forecast 2022-2027 ($ million)
- Exhibit 53: Chart on Diagnostic imaging centers – Year-over-year growth 2022-2027 (%)
- Exhibit 54: Data Table on Diagnostic imaging centers – Year-over-year growth 2022-2027 (%)
- 7.5 Ambulatory care centers – Market size and forecast 2022-2027
- Exhibit 55: Chart on Ambulatory care centers – Market size and forecast 2022-2027 ($ million)
- Exhibit 56: Data Table on Ambulatory care centers – Market size and forecast 2022-2027 ($ million)
- Exhibit 57: Chart on Ambulatory care centers – Year-over-year growth 2022-2027 (%)
- Exhibit 58: Data Table on Ambulatory care centers – Year-over-year growth 2022-2027 (%)
- 7.6 Market opportunity by End-user
- Exhibit 59: Market opportunity by End-user ($ million)
8 Customer Landscape
- 8.1 Customer landscape overview
- Exhibit 60: Analysis of price sensitivity, lifecycle, customer purchase basket, adoption rates, and purchase criteria
9 Geographic Landscape
- 9.1 Geographic segmentation
- Exhibit 61: Chart on Market share by geography 2022-2027 (%)
- Exhibit 62: Data Table on Market share by geography 2022-2027 (%)
- 9.2 Geographic comparison
- Exhibit 63: Chart on Geographic comparison
- Exhibit 64: Data Table on Geographic comparison
- 9.3 North America – Market size and forecast 2022-2027
- Exhibit 65: Chart on North America – Market size and forecast 2022-2027 ($ million)
- Exhibit 66: Data Table on North America – Market size and forecast 2022-2027 ($ million)
- Exhibit 67: Chart on North America – Year-over-year growth 2022-2027 (%)
- Exhibit 68: Data Table on North America – Year-over-year growth 2022-2027 (%)
- 9.4 Europe – Market size and forecast 2022-2027
- Exhibit 69: Chart on Europe – Market size and forecast 2022-2027 ($ million)
- Exhibit 70: Data Table on Europe – Market size and forecast 2022-2027 ($ million)
- Exhibit 71: Chart on Europe – Year-over-year growth 2022-2027 (%)
- Exhibit 72: Data Table on Europe – Year-over-year growth 2022-2027 (%)
- 9.5 Asia – Market size and forecast 2022-2027
- Exhibit 73: Chart on Asia – Market size and forecast 2022-2027 ($ million)
- Exhibit 74: Data Table on Asia – Market size and forecast 2022-2027 ($ million)
- Exhibit 75: Chart on Asia – Year-over-year growth 2022-2027 (%)
- Exhibit 76: Data Table on Asia – Year-over-year growth 2022-2027 (%)
- 9.6 Rest of World (ROW) – Market size and forecast 2022-2027
- Exhibit 77: Chart on Rest of World (ROW) – Market size and forecast 2022-2027 ($ million)
- Exhibit 78: Data Table on Rest of World (ROW) – Market size and forecast 2022-2027 ($ million)
- Exhibit 79: Chart on Rest of World (ROW) – Year-over-year growth 2022-2027 (%)
- Exhibit 80: Data Table on Rest of World (ROW) – Year-over-year growth 2022-2027 (%)
- 9.7 US – Market size and forecast 2022-2027
- Exhibit 81: Chart on US – Market size and forecast 2022-2027 ($ million)
- Exhibit 82: Data Table on US – Market size and forecast 2022-2027 ($ million)
- Exhibit 83: Chart on US – Year-over-year growth 2022-2027 (%)
- Exhibit 84: Data Table on US – Year-over-year growth 2022-2027 (%)
- 9.8 Japan – Market size and forecast 2022-2027
- Exhibit 85: Chart on Japan – Market size and forecast 2022-2027 ($ million)
- Exhibit 86: Data Table on Japan – Market size and forecast 2022-2027 ($ million)
- Exhibit 87: Chart on Japan – Year-over-year growth 2022-2027 (%)
- Exhibit 88: Data Table on Japan – Year-over-year growth 2022-2027 (%)
- 9.9 Germany – Market size and forecast 2022-2027
- Exhibit 89: Chart on Germany – Market size and forecast 2022-2027 ($ million)
- Exhibit 90: Data Table on Germany – Market size and forecast 2022-2027 ($ million)
- Exhibit 91: Chart on Germany – Year-over-year growth 2022-2027 (%)
- Exhibit 92: Data Table on Germany – Year-over-year growth 2022-2027 (%)
- 9.10 China – Market size and forecast 2022-2027
- Exhibit 93: Chart on China – Market size and forecast 2022-2027 ($ million)
- Exhibit 94: Data Table on China – Market size and forecast 2022-2027 ($ million)
- Exhibit 95: Chart on China – Year-over-year growth 2022-2027 (%)
- Exhibit 96: Data Table on China – Year-over-year growth 2022-2027 (%)
- 9.11 France – Market size and forecast 2022-2027
- Exhibit 97: Chart on France – Market size and forecast 2022-2027 ($ million)
- Exhibit 98: Data Table on France – Market size and forecast 2022-2027 ($ million)
- Exhibit 99: Chart on France – Year-over-year growth 2022-2027 (%)
- Exhibit 100: Data Table on France – Year-over-year growth 2022-2027 (%)
- 9.12 Market opportunity by geography
- Exhibit 101: Market opportunity by geography ($ million)
10 Drivers, Challenges, and Trends
- 10.3 Impact of drivers and challenges
- Exhibit 102: Impact of drivers and challenges in 2022 and 2027
11 Vendor Landscape
- 11.2 Vendor landscape
- Exhibit 103: Overview on Criticality of inputs and Factors of differentiation
- 11.3 Landscape disruption
- Exhibit 104: Overview on factors of disruption
- 11.4 Industry risks
- Exhibit 105: Impact of key risks on business
12 Vendor Analysis
- 12.1 Vendors covered
- Exhibit 106: Vendors covered
- 12.2 Market positioning of vendors
- Exhibit 107: Matrix on vendor position and classification
- 12.3 Agilent Technologies Inc.
- Exhibit 108: Agilent Technologies Inc. – Overview
- Exhibit 109: Agilent Technologies Inc. – Business segments
- Exhibit 110: Agilent Technologies Inc. – Key news
- Exhibit 111: Agilent Technologies Inc. – Key offerings
- Exhibit 112: Agilent Technologies Inc. – Segment focus
- 12.4 AURORA HEALTHCARE US Corp.
- Exhibit 113: AURORA HEALTHCARE US Corp. – Overview
- Exhibit 114: AURORA HEALTHCARE US Corp. – Product / Service
- Exhibit 115: AURORA HEALTHCARE US Corp. – Key offerings
- 12.5 Bruker Corp.
- Exhibit 116: Bruker Corp. – Overview
- Exhibit 117: Bruker Corp. – Business segments
- Exhibit 118: Bruker Corp. – Key news
- Exhibit 119: Bruker Corp. – Key offerings
- Exhibit 120: Bruker Corp. – Segment focus
- 12.6 Canon Medical Systems Corp.
- Exhibit 121: Canon Medical Systems Corp. – Overview
- Exhibit 122: Canon Medical Systems Corp. – Business segments
- Exhibit 123: Canon Medical Systems Corp. – Key offerings
- Exhibit 124: Canon Medical Systems Corp. – Segment focus
- 12.7 Esaote Spa
- Exhibit 125: Esaote Spa – Overview
- Exhibit 126: Esaote Spa – Product / Service
- Exhibit 127: Esaote Spa – Key offerings
- 12.8 General Electric Co.
- Exhibit 128: General Electric Co. – Overview
- Exhibit 129: General Electric Co. – Business segments
- Exhibit 130: General Electric Co. – Key news
- Exhibit 131: General Electric Co. – Key offerings
- Exhibit 132: General Electric Co. – Segment focus
- 12.9 Hitachi Ltd.
- Exhibit 133: Hitachi Ltd. – Overview
- Exhibit 134: Hitachi Ltd. – Business segments
- Exhibit 135: Hitachi Ltd. – Key news
- Exhibit 136: Hitachi Ltd. – Key offerings
- Exhibit 137: Hitachi Ltd. – Segment focus
- 12.10 Hologic Inc.
- Exhibit 138: Hologic Inc. – Overview
- Exhibit 139: Hologic Inc. – Business segments
- Exhibit 140: Hologic Inc. – Key news
- Exhibit 141: Hologic Inc. – Key offerings
- Exhibit 142: Hologic Inc. – Segment focus
- 12.11 Koninklijke Philips NV
- Exhibit 143: Koninklijke Philips NV – Overview
- Exhibit 144: Koninklijke Philips NV – Business segments
- Exhibit 145: Koninklijke Philips NV – Key news
- Exhibit 146: Koninklijke Philips NV – Key offerings
- Exhibit 147: Koninklijke Philips NV – Segment focus
- 12.12 MR Instruments Inc.
- Exhibit 148: MR Instruments Inc. – Overview
- Exhibit 149: MR Instruments Inc. – Product / Service
- Exhibit 150: MR Instruments Inc. – Key offerings
- 12.13 RAPID MR International LLC
- Exhibit 151: RAPID MR International LLC – Overview
- Exhibit 152: RAPID MR International LLC – Product / Service
- Exhibit 153: RAPID MR International LLC – Key offerings
- 12.14 ScanMed LLC
- Exhibit 154: ScanMed LLC – Overview
- Exhibit 155: ScanMed LLC – Product / Service
- Exhibit 156: ScanMed LLC – Key offerings
- 12.15 Shimadzu Corp.
- Exhibit 157: Shimadzu Corp. – Overview
- Exhibit 158: Shimadzu Corp. – Business segments
- Exhibit 159: Shimadzu Corp. – Key news
- Exhibit 160: Shimadzu Corp. – Key offerings
- Exhibit 161: Shimadzu Corp. – Segment focus
- 12.16 Siemens Healthineers AG
- Exhibit 162: Siemens Healthineers AG – Overview
- Exhibit 163: Siemens Healthineers AG – Business segments
- Exhibit 164: Siemens Healthineers AG – Key news
- Exhibit 165: Siemens Healthineers AG – Key offerings
- Exhibit 166: Siemens Healthineers AG – Segment focus
- 12.17 Time Medical
- Exhibit 167: Time Medical – Overview
- Exhibit 168: Time Medical – Product / Service
- Exhibit 169: Time Medical – Key offerings
13 Appendix
- 13.2 Inclusions and exclusions checklist
- Exhibit 170: Inclusions checklist
- Exhibit 171: Exclusions checklist
- 13.3 Currency conversion rates for US$
- Exhibit 172: Currency conversion rates for US$
- 13.4 Research methodology
- Exhibit 173: Research methodology
- Exhibit 174: Validation techniques employed for market sizing
- Exhibit 175: Information sources
- 13.5 List of abbreviations
- Exhibit 176: List of abbreviations
About Us
Technavio is a leading global technology research and advisory company. Their research and analysis focus on emerging market trends and provides actionable insights to help businesses identify market opportunities and develop effective strategies to optimize their market positions. With over 500 specialized analysts, Technavio’s report library consists of more than 17,000 reports and counting, covering 800 technologies, spanning across 50 countries. Their client base consists of enterprises of all sizes, including more than 100 Fortune 500 companies. This growing client base relies on Technavio’s comprehensive coverage, extensive research, and actionable market insights to identify opportunities in existing and potential markets and assess their competitive positions within changing market scenarios.
Contact
Technavio Research
Jesse Maida
Media & Marketing Executive
US: +1 844 364 1100
UK: +44 203 893 3200
Email: [email protected]
Website: www.technavio.com/
SOURCE Technavio
